An imaging study of the globular cluster systems of NGC 1407 and NGC 1400
Abstract
We present wide-field Keck telescope imaging of the globular cluster (GC) systems around NGC 1407 and NGC 1400 in the Eridanus galaxy cloud. This is complemented by Hubble Space Telescope images from the Advanced Camera for Surveys of NGC 1407 and Wide Field and Planetary Camera 2 images of NGC 1400. We clearly detect bimodality in the GC colour distribution of NGC 1407. The blue GC subpopulation has a mean colour of = 1.61 and a relative contribution of around 40%, whereas the red subpopulation with = 2.06 contributes 60% to the overall GC system. Assuming old ages, this corresponds to [Fe/H] = –1.45 and –0.19. Both subpopulations are intrinsically broad in colour (indicating a range in ages and/or metallicities), with the red subpopulation being broader than the blue. The GC colour distribution for NGC 1400 is less clear cut than for NGC 1407, however, we also find evidence for a bimodal distribution. We find the NGC 1407 red GCs to be 20% smaller in size than the blue ones. This is consistent with the expectations of mass segregation in an old coeval GC system. Half a dozen large objects (20–40 pc), with GC-like colours are identified, which are probably background galaxies.
The HST data sets allow us to probe to small galactocentric radii. Here we find both GC systems to possess a GC surface density distribution which is largely constant in these inner galaxy regions. We fit isothermal-like profiles and derive GC system core radii of 9.4 kpc for NGC 1407 and 5.8 kpc for NGC 1400. For NGC 1407 we are able to separate the surface density distribution into blue and red subpopulations, giving 17.8 and 7.6 kpc respectively. Outside this central region, the radial profile of the GC surface density is similar to that of the galaxy light for NGC 1407 but it is flatter for NGC 1400. The mean GC magnitude appears to be constant with galactocentric radius. We find that for both galaxies, the GC systems have a similar ellipticity and azimuthal distribution as the underlying galaxy starlight. A fit to the GC luminosity function gives a distance modulus of 31.6, which is in good agreement with distances based on the Faber-Jackson relation and the Virgo infall corrected velocity. This distance lies at the midpoint of recent surface brightness fluctuation distance measurements.
1 Introduction
Early-type galaxies can host hundreds to many thousands of globular clusters (GCs). The properties of GC systems provide important clues about the formation and evolutionary history of their host galaxy. This motivation has prompted numerous imaging studies of early-type galaxy GC systems over the years. Imaging of GC systems began with wide-area photographic plates which defined the global structural properties of GC systems (see Harris & Racine 1979). CCD imaging lead to improvements in photometry and the first detections of colour bimodality. However, CCDs suffered from a small field-of-view so studies were often limited to the central regions, in addition contamination from background galaxies and foreground stars was a significant issue under 1 arcsec seeing conditions Harris (1991). The introduction of the Wide Field and Planetary Camera 2 (WFPC2) camera on the Hubble Space Telescope had a large impact on GC studies. Its high spatial resolution meant that it effectively identified GCs out to Virgo-like distances, hence reducing contamination levels to near zero. Accurate photometry led to colour bimodality detections in the GC systems of many/most early-type galaxies (e.g. Forbes et al. 1996; Gebhardt & Kissler-Patig 1999; Larsen et al. 2001; Kundu & Whitmore 2001). The Advanced Camera for Surveys (ACS) camera with its increased area and sensitivity over WFPC2 is some ten times more effective for GC studies. Here we present some of the first results on GC systems using the ACS on the Hubble Space Telescope. This is complemented with some older WFPC2 and wide-field Keck telescope imaging. Here we study the GC systems associated with NGC 1407 and NGC 1400.
NGC 1407 (E0) is the brightest group galaxy (BGG) in an X-ray bright group (Osmond & Ponman 2004; Brough et al. 2005, in prep.), which lies within the larger Eridanus cloud. NGC 1400 (S0-) is some 10 arcmins away from NGC 1407 in the same group. Although the two galaxies have quite different heliocentric velocities (V = 1783 km/s for NGC 1407 and V = 546 km/s for NGC 1400), both are thought to lie at the same distance (Tonry et al., 2001). Based on galaxy velocities, Gould (1993) speculated that NGC 1407 lies at the centre of a massive dark halo with M/L 3000. NGC 1407 has an extinction-corrected magnitude of MV = –21.86 and effective radius of 1.2′ (7.34 kpc; Bender, Burstein & Faber 19927). It lies on the Fundamental Plane and shows no obvious signs of morphological fine structure (Michard & Prugniel, 2004), but does reveal a young central stellar population of 2.5 Gyrs (Denicolo et al. 2005). NGC 1400 has a magnitude of MV = –20.63 and no obvious fine structure, but has a fairly large residual of +0.3 dex with respect to the Fundamental Plane (Prugniel & Simien, 1996).
Motivated by the velocity differences between NGC 1407 and NGC 1400, Perrett et al. (1997) undertook a study of the GC systems of the two galaxies to measure the peak of the GC luminosity functions. They confirmed that NGC 1400 lies at a similar distance to NGC 1407, despite its large peculiar velocity. They also estimated the specific frequency (number of GCs per unit starlight) of NGC 1407 to be 4.0 1.3 and the total GC population to be 2641 443. In their observations they detected 629 76 GCs using the Washington -band and 556 61 GCs using the Kron-Cousins I-band. They noted that the GC system radial profile follows the galaxy halo light profile unusually closely. They did not detect bimodality in their () colour distribution. For NGC 1400, they derived = 5.2 2.0 based on 106 observed GCs, and again did not detect bimodality.
We detect bimodality in the GC colour distribution in both galaxies and discuss the structural properties of the GC systems. In Sections 2 and 3 we present imaging from the ACS and WFPC2 cameras respectively. In Section 4 we present the wide-field Keck imaging. The results for NGC 1407 and NGC 1400 are given in Sections 5 and 6. Our discussion and conclusions are given in Section 7. In Appendix A we give GC candidate lists which include coordinates, magnitudes and colours. Coordinates are only accurate to a few arcsecs in a relative sense, less so on an absolute scale. In this paper we assume a distance to NGC 1407 and NGC 1400 of 21 Mpc, where 1 arcmin corresponds to 6.12 kpc.
2 ACS Observations and Data Reduction
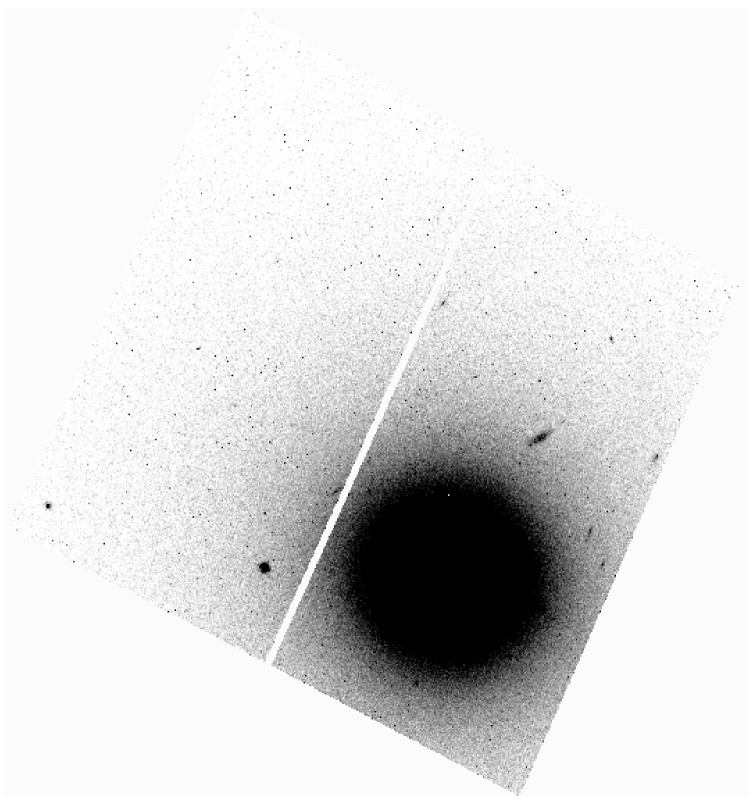
Advanced Camera for Surveys (ACS) images of NGC 1407 were taken in the F435W and F814W filters (proposal ID = 9427, PI = Harris, see also Harris et al. 2005). The exposure times were 1500s in F435W and 680s in F814W. The galaxy centre was offset about 1′ from the centre of the ACS field-of-view. The images were downloaded from the HST archive, reprocessed using the ‘on-the-fly’ software and then drizzled. Figure 1 shows the F435W image.
2.1 Object Detection and Selection
The daophotii software package (Stetson, 1987) was used to detect GC candidates and measure their magnitudes. Objects with roundness values between –1 to 1 and sharpness from 0.5 to 1.5 were selected. We employed a detection threshold of 4, which is the product of the find-sigma parameter and the appropriate gain ratio.
Magnitudes were measured in a 5-pixel radius aperture. Aperture corrections, from 5 to 10 pixels, were then calculated from several bright GCs in the frame. Corrections from 10 pixels to the total light were taken from Sirianni et al. (2005). We then used the transformation equations, with colour terms, from Sirianni et al. (2005) to convert our instrumental F435W and F814W magnitudes into the standard Johnson B and I-band system. Galactic extinction corrections of AB = 0.282 and AI = 0.13 were then applied. After applying a color selection of 1.2 2.5 (which corresponds to –2.5 [Fe/H] 1.0 using the relation of Barmby et al. 2000), we inspected the images and visually removed obvious contaminants (such as background galaxies). This reduced the data set to 952 potential globular clusters. A colour error cut of 0.25 mag. was then applied, leaving 903 objects. The behaviour of the colour error for candidate GCs is shown in Figure 2. The remaining contamination rate of foreground stars or background galaxies is statistically insignificant given the high spatial resolution of the ACS. We did not detect any GCs interior to a galactocentric radius of 1″.
We have performed completeness tests by generating a large number of artifical objects with sizes and colours that resemble GCs. These are then randomly inserted into the F435W and F814W ACS images using the ADDSTAR task. We maintained a density of objects similar to that of the original data so that additional crowding did not affect our results. These were then recovered using the same object detection process as described above. Finally, the test was run three times to improve the statistical significance. In Figure 3 we show the recovered completeness fraction of artifical objects as a function of B and I magnitude. The plot shows that our 50% completeness limits are B 26.0 and I 24.2.
A colour-magnitude diagram of the ACS GCs is shown in Figure 4. It shows evidence for bimodal colours, with the brightest GCs having 22. As can be seen in the figure, there is one object which is significantly brighter than all the others, with = 20.98. Although 1 mag. brighter than the other selected objects, A spectrum from the Keck telescope indicates that it has a velocity consistent with that of NGC 1407 (Cenarro et al. 2005). Its magnitude (MB = –10.62) is similar to that of Omega Cen in our Galaxy. Visually it appears similar to other GCs in the ACS image, it is not obviously a dwarf galaxy. Its effective radius (of 4 pc) is consistent with a GC at the distance of NGC 1407 and not an Ultra Compact Dwarf (Drinkwater et al., 2004). Thus except for this interesting object, our data set has an effective bright magnitude limit of 21.5. The faint limit is 26.
Objects with colours 1.2 and 2.5 are likely to be faint stars or compact galaxies. The small number of such objects indicates that the contamination level in our selected colour range (1.2 2.5) is likely to be quite small.


3 WFPC2 Observations and Data Reduction
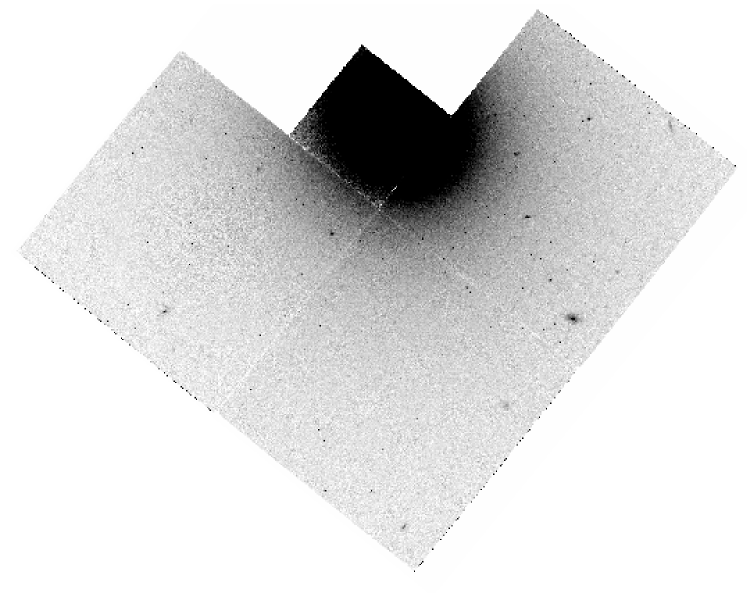
Wide Field and Planetary Camera 2 images of NGC 1400 were taken in the F555W and F814W filters (proposal ID = 5999, PI = Phillips). The data consisted of three 160s F814W images and one 160s F555W image. The pipeline-reduced images were downloaded from the HST archive and the multiple F814W images were average-combined. The four WFPC2 CCDs were mosaiced together using the mosaic task in STSDAS. Figure 5 shows the combined F814W image. To aid in the detection of globular cluster candidates on the PC image, we fitted and subtracted the galaxy isophotes using the ellipse task in iraf allowing the centre, ellipticity and position angle to vary. No objects were detected within 5″ of the galaxy centre.
3.1 Object Detection and Selection
The detection of globular clusters was carried out using the daophotii package. Detection was based solely on the F814W image, which had a higher signal-to-noise ratio than the F555W image but also, more importantly, was largely devoid of cosmic rays. Detection criteria consisted of a roundness range of –1 to 1, a sharpness range of 0.2 to 1 and a threshold of 4 times the background. Objects in the PC image were detected separately from the WFC images due to the different pixel scales and background levels. This gave over 1,000 potential GCs.
Photometry of the detected objects was carried out for both the F555W and F814W images using the coordinates of the objects detected in the F814W image via the qphot task in the apphot package. Zeropoints and the conversion to Johnson and bands were taken following the method described in Forbes et al. (1996) with Galactic extinction corrections of AV = 0.21 and AI = 0.13.
Various selection criteria were applied to the data, i.e. a colour error cut of 0.5 mag., a colour selection of , and a magnitude selection of . The colour error is dominated by the uncertainty in the -band magnitudes which come from a single short F555W image. The colour selection can be seen in Figure 6, and the colour-magnitude selection in Figure 7. These cuts, as well as a visual inspection to remove duplicate matches, obvious galaxies and edge effects resulted in a data set of 204 objects.


4 Keck Telescope Imaging
4.1 Observations and Initial Data Reduction
A mosaic of eight and -band images of NGC 1407 and the surrounding area (including NGC 1400) were acquired using the Low Resolution Imaging Spectrometer (LRIS; Oke et al. 1995) on the 10m Keck I telescope on 2004 October 12 and 13. LRIS is equipped with a TEK 2048x2048 detector which is mounted on the Cassegrain focus with a dual-beam imager so and images can be obtained simultaneously.
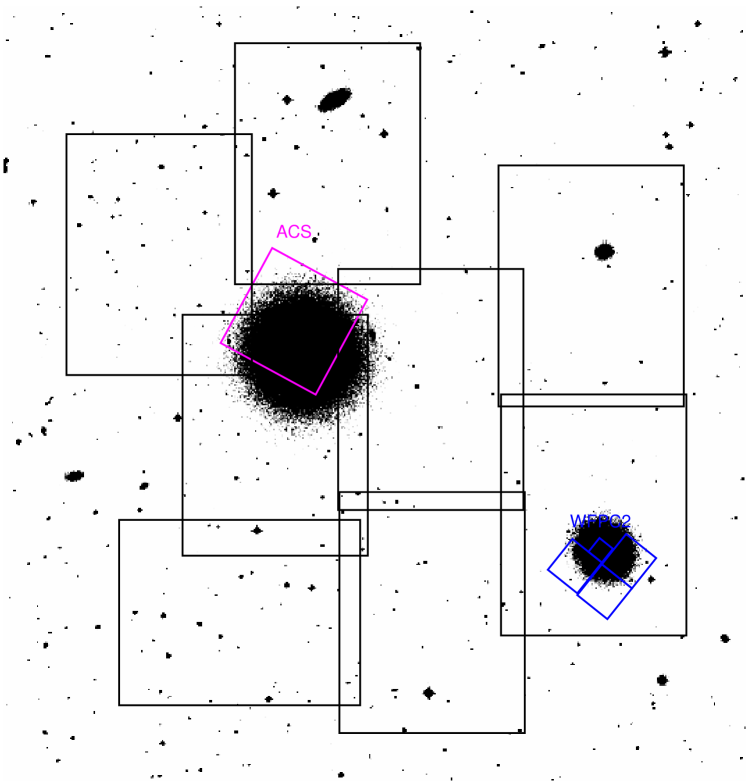
Eight pointings were obtained as shown on Figure 8. Each field had an area of 6 7.8 arcmin2, but since the two CCDs have slightly different scales (0.138″pixel-1 in and the 0.215″pixel-1 in ), the actual field-of-view differed slightly between bands. All pointings had an exposure time of 600s. The seeing conditions were not very good and varied between pointings with a median of 1.3″. Time did not allow for a background field to be observed. Bias subtraction was performed using the wmkolris package provided by the observatory and flat-fielding was performed using standard iraf procedures.
To aid in the detection of inner globular cluster candidates, a model of NGC 1407 and NGC 1400 in the -band was subtracted before running our object detection algorithm (the -band image was saturated). A smooth galaxy model was created using the ellipse task in iraf/stsdas allowing the centre, ellipticity and position angle to vary.
4.2 Object Detection and Selection
The daophot package was used to select potential globular clusters in each of the eight and images. Selection criteria consisted of a roundness range of –1 to 1 and a sharpness range of 0 to 1 with the signal-to-noise (S/N) ratio threshold, full width half maximum (FWHM) and minimum and maximum good data values adjusted to the seeing conditions of each image. This resulted in over 10,000 potential globular clusters for each filter.
The pointing containing the galaxy centre was adopted as the reference field to derive photometric zeropoints because a portion of the field overlapped with a significant portion of the ACS field. A small number of objects in common with both the ACS and central Keck images were identified. The Keck magnitudes were then adjusted to match the photometrically-calibrated ACS magnitudes, thus giving zeropoints for the Keck images.
The qphot task in the apphot package was used to measure the magnitude and error of each object found by daofind, using an inner sky annulus radius of the FWHM and a sky annulus width of half the FWHM and the previously calculated photometric zeropoints. Spatial matching of the and object lists reduced the data set to under 5,000 potential GCs.
Various other selection criteria were then applied to the data, i.e. retaining only objects with roundness between –0.5 and 0.5, colour error less than 0.25 mag., and . The colour error selection can be seen in Figure 9 and the colour and magnitude selection can be seen in the colour magnitude diagram in Figure 10. These cuts, as well as a visual inspection to remove duplicate matches and extended objects resulted in a more manageable and realistic data set of 474 candidate GCs. The bright magnitude cut corresponds to that of the ACS data, while the colour limits are broader to take into account the increased photometric error of the Keck data.


The celestial coordinates of each object were calculated using the Aladin sky atlas and Vizier catalogue service with the usno-b1.0 catalogue to identify four stars in each field. The Starlink astrom program was used to perform the coordinate transformation and fitting, using the transformation of the central image with the best fit for each field.
We determined galactocentric coordinates for each object based on their celestial coordinates and the NGC 1407 galaxy centre. We did not detect any GCs within a galactocentric radius of 20″.
4.3 NGC 1400 Globular Clusters
Visual inspection of the Keck images suggests a population of GCs associated with NGC 1400. From an analysis of the GC surface density distribution centred on NGC 1400 (see Section 6.2), we associate 74 of the 474 candidate GCs described earlier with NGC 1400. We have removed these from the NGC 1407 object list, leaving 400 candidate GCs associated with NGC 1407. We note that an extrapolation of the NGC 1407 GC surface density profile (see Section 5.2 below) would suggest less than 10 GCs associated with NGC 1407 lie at the projected radius of NGC 1400. Figure 11 shows a colour magnitude diagram for the 74 GC candidates thought to be associated with NGC 1400.

5 NGC 1407 Results
5.1 Globular Cluster Colours
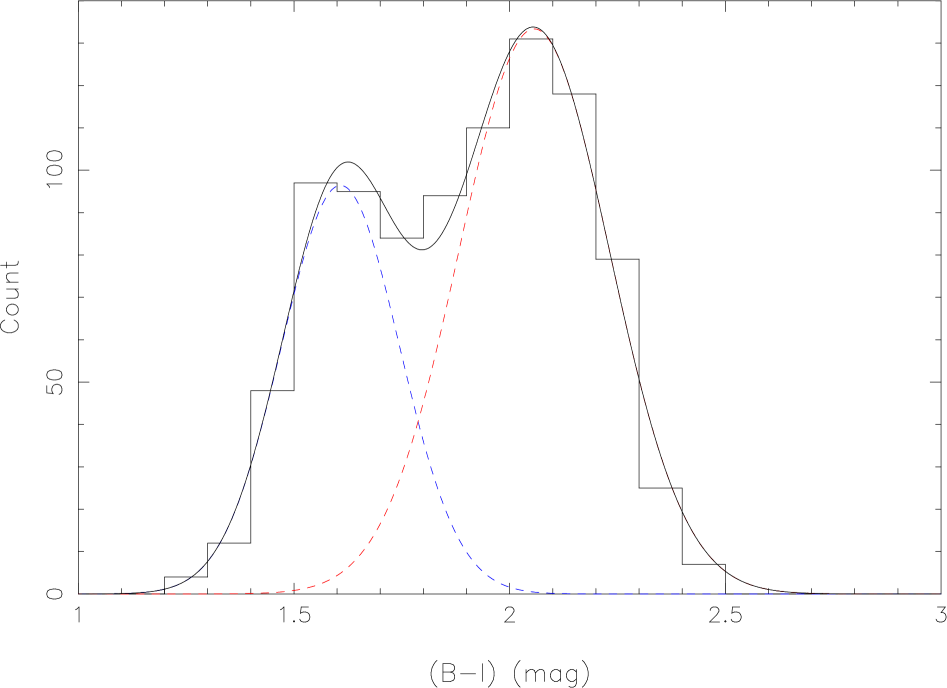
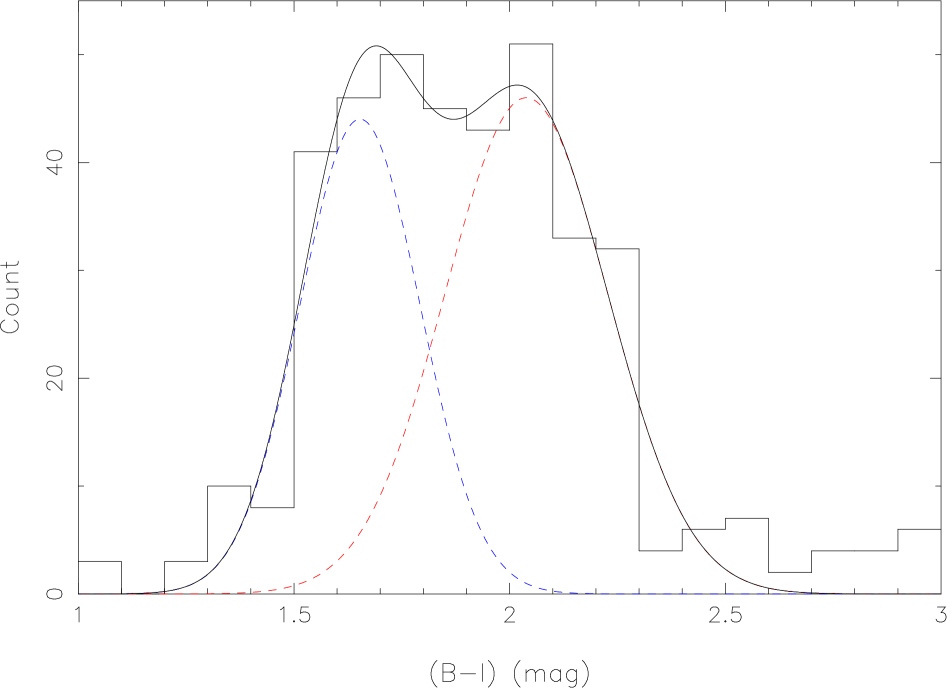
In Figure 12, the colour histogram for the ACS data is shown, with two Gaussians fitted to the distribution. This fit was done using the ngaussfit task in iraf and allowing the amplitudes and central position and FHWM to vary. The system is well fit by two Gaussians with 36% in the blue subpopulation and 64% in the red one. The blue subpopulation has a peak colour of = 1.61 and the red subpopulation peak is at = 2.06; both with an uncertainty of 0.02. This is confirmed by a KMM (Ashman et al. 1994) statistical analysis on the unbinned colour data which gives peaks of = 1.61 and 2.06, with 38% in the blue subpopulation and 62% in the red one.
The blue subpopulation, with a Gaussian width = 0.14 0.03 has a narrower distribution than the red subpopulation, with a = 0.17 0.03. The rms colour error for our sample is 0.06 which indicates an intrinsic widths of = 0.13 and 0.16 mag. for the blue and red subpopulations respectively. Thus both subpopulations contain a range of ages and/or metallicities. If we assume that the GCs are all very old (see Cenarro et al. 2005, in prep.), and that the intrinsic colour widths are entirely due to metallicity, we can derive the metallicity spread. Using the relation of Barmby et al. (2000), we derive widths of [Fe/H] = 0.72 and 0.89 dex for the blue and red subpopulations respectively. Any age differences will make these metallicity ranges upper limits. ACS imaging of GC systems in other galaxies also indicates red subpopulations that are broader in colour than the blue subpopulation (Strader et al. 2005; Harris et al. 2005). We note that equally good fits to the data can be found with widths that are the same for both subpopulations. In the case of equal width colour distributions, the relative proportions are essentially unchanged.
The Keck colour distribution is slightly less well-defined than the ACS one (see Fig. 13), however we were still able to fit two Gaussians using the same method. Best-fit Gaussians were found with peaks at = 1.65 and = 2.04 0.05. The blue subpopulation was 41% and the red one 59% of the total, with an uncertainty of about 10%. These peaks and relative proportions are statistically the same as those found in the ACS data (we might expect to find relatively more blue GCs in the Keck data as it probes to larger galactocentric radii). Again, we see that the blue subpopulation, with = 0.14 is narrower then the red subpopulation, with = 0.19, and that both values are very similar to those in the ACS data. We note that the mean colour for the Keck data ( = 1.92 0.02) is consistent with that from the ACS data ( = 1.89 0.01).
Finally, we note that the bright (B 24) blue GCs are on average slightly redder (by 0.1 mag.) than the faint blue GCs in the ACS data. (The red GCs do not appear to show a similar colour-magnitude trend.) Although this trend is not particularly noticable in our NGC 1407 ACS data, it has been seen recently for the GC systems of other galaxies studied with the ACS (Strader et al. 2005; Harris et al. 2005). The trend is unlikely to be an artifact of photometric errors (see also Harris et al. 2005) nor is it due to size variations (we find no strong size-luminosity trend within a GC subpopulation). Such trends have not been reported in ground-based or even HST WFPC2 studies of GC systems, and we find no obvious trend in our Keck data.
5.2 Globular Cluster System Surface Density
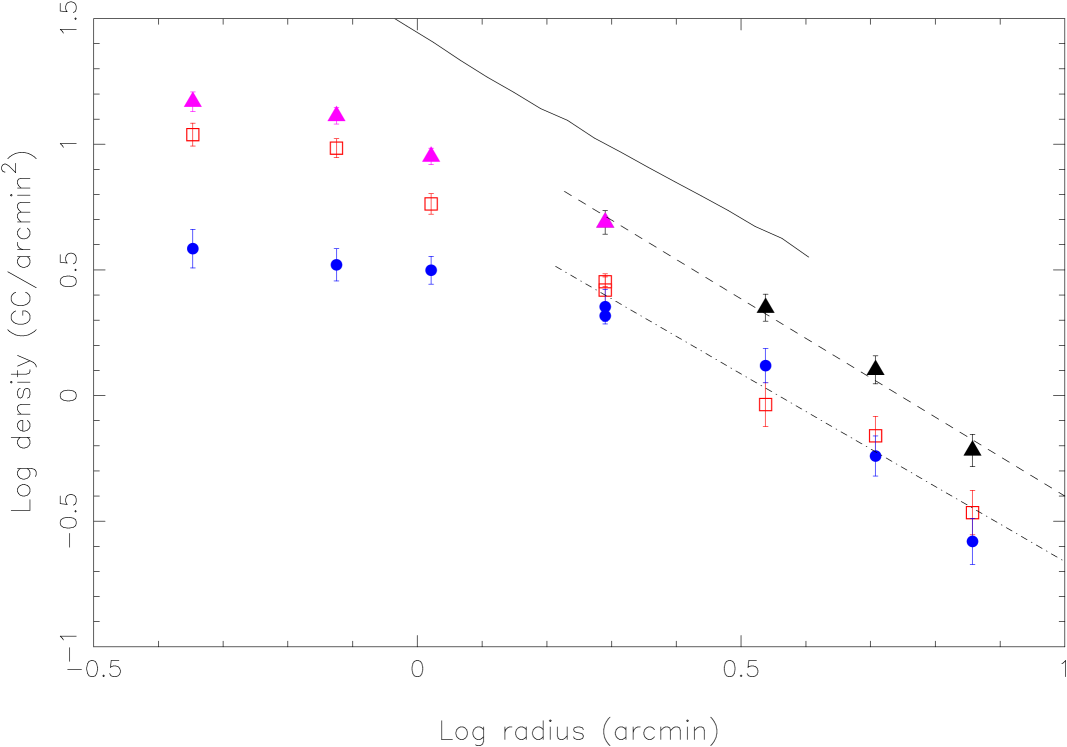
The surface density versus galactocentric radius of both the ACS and Keck data sets (total 1300 objects) is shown in Fig. 14. A correction was made for the missing area in each radial annulus and errors were calculated assuming Poisson statistics. The outermost ACS annulus was chosen to match the innermost Keck annulus so that the ACS data could be normalised to match the Keck data. The subpopulations have been defined where the two Gaussian fits to their colour distributions contribute the same amount to the combined fit, i.e. 1.8 for both the ACS and Keck data.
The outermost Keck annulus, at a mean radius of 70 kpc is consistent with a constant surface density of objects. This suggests that we have reached the background and so these values have been subtracted from all the other Keck annuli. The ACS data are assumed to be free from background contamination.
Each of the data sets (total, blue and red globular cluster populations) show a centrally concentrated globular cluster system with a ‘core’ region of near constant surface density and a power-law like fall-off in the outer regions. Comparing the blue and the red subpopulations, it is noted that the blue subpopulation has a much larger core radius than the red subpopulation. Following Forbes et al. (1996) we fit the core region with an isothermal-like profile of the form: , where is the core radius. Fitting only the ACS data points, we derive for the total population to be , for the red subpopulation and arcmin for the blue subpopulation (where 1 arcmin is 6.12 kpc).
A simple power-law () fit to the outer most four data points, from a radius of 1.95′ to 7.2′, gives a slope of –1.57 0.08 for the total GC system. This can be compared to the steeper values found by Perrett et al. (1997) of in the -band and in the -band. The slopes for the blue and red subpopulations are –1.65 0.29 and –1.50 0.06 respectively, which are statistically the same as each other and the total GC system.
Figure 14 also shows the galaxy -band surface brightness profile from the Keck data as a solid line, after converting to log units and applying an arbitrary vertical normalisation. As can be seen, for the region of overlap with the outer GC system, the galaxy starlight has a similar slope of –1.42 to that of the GC system with slope of –1.57 0.08.
The plot also shows that there are more red globular clusters in the inner parts of the galaxy than blue. At larger radii, there appears to be slightly more red GCs than blue ones, which is an unexpected result as studies of other galaxies have generally found the blue subpopulation dominating the red at large radii. This could be due to increased contamination rates in the red subpopulation at large radii.
5.3 Globular Cluster System Position Angle
Figure 15 shows the position angle dependence of GCs in NGC 1407. This figure was constructed from the annuli in which we had complete coverage; for the Keck data this was a single thin annulus between 2.7′and 4.2′ and for the ACS data, it was all GCs within a 0.9′ radius of the centre of the galaxy. Within the Poisson error bars a flat distribution (i.e. no dependence on position angle) is consistent with the data. Since NGC 1407 is an E0 galaxy, it might be expected that the globular cluster distribution should not depend on position angle. This is indeed what has been found.
Using the position angle of each globular cluster in the complete coverage area, we also computed the ellipticity of the GC system using where is the position angle. We obtained an ellipticity measure of 0.13 0.08 from the Keck data and 0.06 0.04 from the ACS data, both corresponding to an E0–E1 distribution.

5.4 Globular Cluster Sizes
With the superior spatial resolution of the ACS, the GCs in NGC 1407 are marginally resolved. We have convolved a Moffat profile with a PSF taken from a star in the I-band ACS image. Using this PSF with the ISHAPE routine (Larsen 1999), we have determined the size of each GC candidate. We find a large range in the effective radii of individual GCs but the mean value is Reff = 2.9 0.1 pc. This is consistent with the mean value for the Milky Way GC system of 3.5 0.4 pc (Harris 1996). Dividing the sample into blue and red subpopulations (at B–I = 1.8) we find a statistically significant difference in their sizes, i.e. for the blue GCs the mean Reff = 3.24 0.19 pc vs Reff = 2.68 0.12 pc for the red ones. Thus the red GCs appear to be 20% smaller than the blue GCs. A histogram of the blue and red GC distributions is shown in Figure 16. The distributions are similar but the red GC distribution is peaked at a smaller effective radius.
We also find a half dozen objects with sizes 20–40 pc (not shown in Figure 16). Visual inspection shows these large objects to be well-detected and similar in appearance to other GCs. They cover the full range of magnitudes from B = 22.8 to the magnitude limit. They have a mean colour of B–I = 1.78 0.11, i.e. statistically the same as the general GC population. However, as well as larger sizes they are more elliptical (less round) than the general GC population.

5.5 Globular Cluster System Luminosity Function
The luminosity function of GC systems (number of GCs per unit magnitude) has been shown to be remarkably similar, or ‘universal’, across a wide range of galaxies. For example, in a recent review of GC luminosity functions, Richtler (2003) derived a a mean peak, or turnover magnitude in the V-band (which is the most commonly studied) of MV = –7.51 0.24 and 1.2 for a sample of early-type galaxies.
The NGC 1407 GC system has peaks (V–I)o 0.95 and 1.15, which implies an I-band turnover magnitude of MI = –8.46 and –8.66 for the metal-poor and metal-rich subpopulations respectively. For the total GC system, we assume (V–I)o = 1.05 and hence MI = –8.56. For the B-band, we use (B–V)o = 0.7 and 0.9 which corresponds to the expected colours for [Fe/H] = –1.5 and –0.5 of a 15 Gyr old stellar population. This gives MB = –6.81 and –6.61 for the two subpopulations. For the total GC system, we assume (B–V)o = 0.8 and hence MB = –6.71.
We have fit the ACS B and I-band GC luminosity functions to both a Gaussian and t5 function, using a maximum likelihood code developed by J. Secker (Secker & Harris, 1993). This code includes our photometric errors and completeness functions (see Section 2) to make the appropriate correction at faint magnitudes. The results of fitting a Gaussian function are summarised in Table 1 (the results for a t5 function are within 0.05 of the Gaussian turnover magnitude for all fits). We have fit the total GC system as well as the blue and red subpopulations separately (the latter with a fixed = 1.2).
Our results can be directly compared to those of Perrett et al. (1997) for the I-band. For a fixed = 1.2, they found a turnover magnitude of I = 23.12 0.15 (after adjusting for our I-band extinction correction). We derive I = 22.98 0.06 and = 1.17 0.05 which is quite consistent with the Perrett et al. (1997) findings.
We find that the B-band turnover magnitude for the metal-rich GCs is 0.29m fainter than the metal-poor GCs. However in the I-band the metal-rich GCs are brighter than the metal-poor ones by 0.42m. This could be explained qualitatively if the metal-rich GCs were on average somewhat younger than the metal-poor ones (for an old, coeval population the metal-rich GCs are expected to be fainter in the B-band and be of similar brightness in the I-band (Ashman, Conti & Zepf 1995)). We note that in the V-band the Galactic metal-rich GCs are fainter, by 0.46 0.36m, and for a sample of 13 early-type galaxies they are fainter by 0.30 0.16m (Larsen et al. 2001). In terms of the distance modulus, we reassuringly find consistent values between the B and I-bands.
| Table 1. NGC 1407 Globular Cluster Luminosity Function | |||
|---|---|---|---|
| Total | MB = –6.71 | MI = –8.56 | |
| B = 24.95 0.08 | m–M = 31.63 0.09 | = 1.21 0.05 | NGC = 1171 |
| I = 22.98 0.06 | m–M = 31.51 0.07 | = 1.17 0.05 | NGC = 1148 |
| Blue | MB = –6.81 | MI = –8.46 | |
| B = 24.76 0.09 | m–M = 31.57 0.10 | = 1.2 | NGC = 419 |
| I = 23.29 0.09 | m–M = 31.75 0.10 | = 1.2 | NGC = 473 |
| Red | MB = –6.61 | MI = –8.66 | |
| B = 25.05 0.08 | m–M = 31.66 0.09 | = 1.2 | NGC = 753 |
| I = 22.87 0.06 | m–M = 31.53 0.07 | = 1.2 | NGC = 696 |
Notes: The table gives the turnover magnitude, distance modulus, Gaussian dispersion and total number of GCs for the total, blue (metal-poor) and red (metal-rich) populations. The assumed absolute magnitudes are quoted for the B and I bands. For the blue and red fits, the Gaussian width has been fixed to 1.2.
When we examine the the total, blue and red (divided at B–I = 1.8) populations separately we measure 31.57, 31.66 and 31.60 respectively. The uncertainty on these three estimates are similar at about 0.1m. We take as our best distance modulus value 31.6 0.1.
Richtler (2003) recently concluded that GC luminosity functions “…are as accurate as those derived from surface brightness fluctuations, once the conditions of high data quality and sufficiently rich cluster systems are fulfilled.” Interestingly the surface brightness fluctuation (SBF) distance for NGC 1407 appears to be poorly constrained. The SBF distance modulus for NGC 1407 was given in Tonry et al. (1991) as 31.07 0.13. This was revised to 32.30 0.26 in Tonry et al. (2001). Jensen et al. (2003) recalibrated the Tonry et al. (2001) SBF values by –0.16, thus giving 32.14 0.13. A recent SBF analysis of the same ACS data used here (Cantiello et al. 2005) suggests a value of 32.00 0.1.
We note that the Dn– velocity to NGC 1407 is 1990 187 km/s (Faber et al. 1989), which for Ho = 72 km/s/Mpc implies a distance of 27.6 2.6 Mpc (m–M = 32.2 0.2). This is consistent with the larger SBF value. The distance modulus from the Faber-Jackson relation from HyperLeda (i.e. m–M = BT + 6.2 log + 5.9) is 31.59. Using the Virgo infall corrected velocity for NGC 1407 of 1617 km/s, and a Hubble constant of Ho = 72 km/s/Mpc, gives 22.5 Mpc or m–M = 31.76. The latter two measures are similar to the distance from the GC luminosity function. As far as we aware, a distance estimate based on the planetary nebulae luminosity function does not yet exist for NGC 1407. We conclude that NGC 1407 lies at a distance of 31.6 rather than 32.1. If we had assumed the larger distance of 26.3 Mpc, then all of the galactocentric radii and GC sizes quoted in this paper need to be corrected by a factor of 25%.
After examining the value of the turnover magnitude in several radial bins, we find no evidence for a turnover magnitude that varies with galactocentric radius. Integrating under the GC luminosity function gives the total number of GCs, within the ACS field-of-view, to be about 1160. Using photometry from NED we estimate a V-band magnitude within the ACS field-of-view to be V 10.3. This gives a GC specific frequency of SN = 3.5, which as a lower limit to the total SN is consistent with the value of 4.0 1.3 found by Perrett et al. (1997).
6 NGC 1400 Results
6.1 Globular Cluster Colours
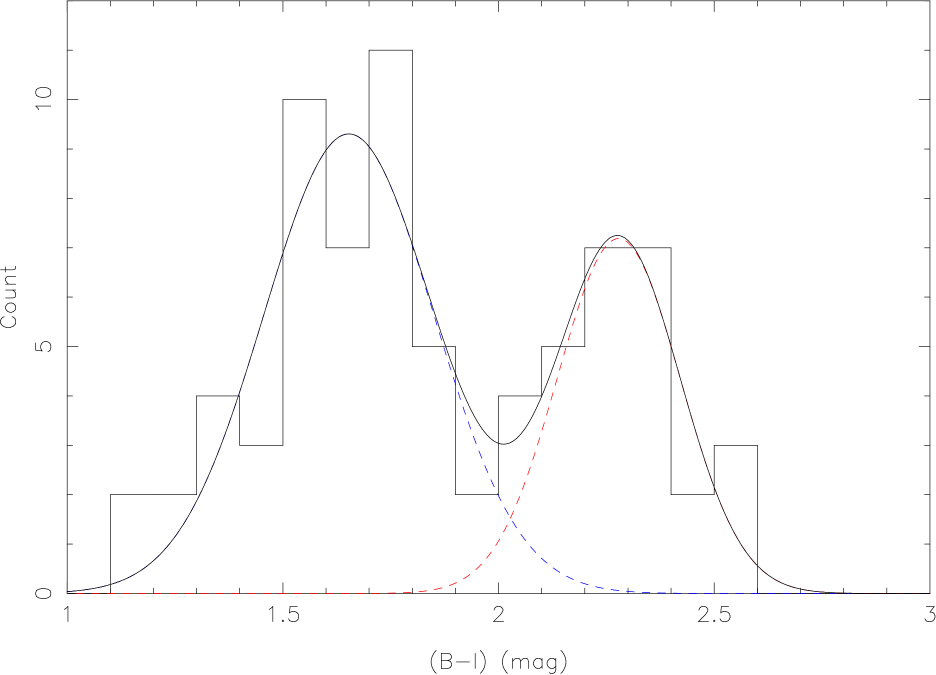
We only associated 74 GCs with NGC 1400 from the Keck images, so any subsequent analysis will be subject to small number statistics. A GC colour distribution is shown in Fig. 17 with two Gaussians fitted to the distribution. The blue subpopulation has a peak colour of = 1.65 and the red subpopulation has a peak colour of = 2.28. The uncertainty in estimating these peak values is 0.1 mag. The blue subpopulation contains 71% of the total, and the red 29%. A KMM analysis supports this finding with peaks at = 1.62 and 2.29 in the ratio of 64% blue to 36% red. The blue peak is similar to that found in NGC 1407 but the red peak seems substantially redder. Small number statistics and contamination (particularly in the red subpopulation) can strongly affect the mean colours. Nevertheless, bimodality in the NGC 1400 GC colours seems reliable.
For peaks of = 1.65 and 2.28, coupled with the conversion formula of Forbes & Forte (2001) we would predict peaks at 0.95 and 1.27 (a red peak at = 2.06 would give = 1.16). In Fig. LABEL:f:wcolourhistm we show the colour distribution for the 200 GCs detected in the WFPC2 images. The distribution shows a peak around 1.1. A KMM analysis does not detect two peaks in the distribution, suggesting a unimodal colour distribution. The metallicity sensitivity of V–I is much less than B–I, so it is possible that the two distributions are consistent with each other. To test this we have performed the exercise of converting our Keck B–I distribution into V–I and convolving with the appropriate V–I colour errors. This model distribution is also shown in Fig. LABEL:f:wcolourhistm and is consistent with the observed V–I distribution according to a KS test. Thus the use of V–I colours can obscure the presence of a bimodal colour distribution (as seen in B–I).

6.2 Globular Cluster System Surface Density
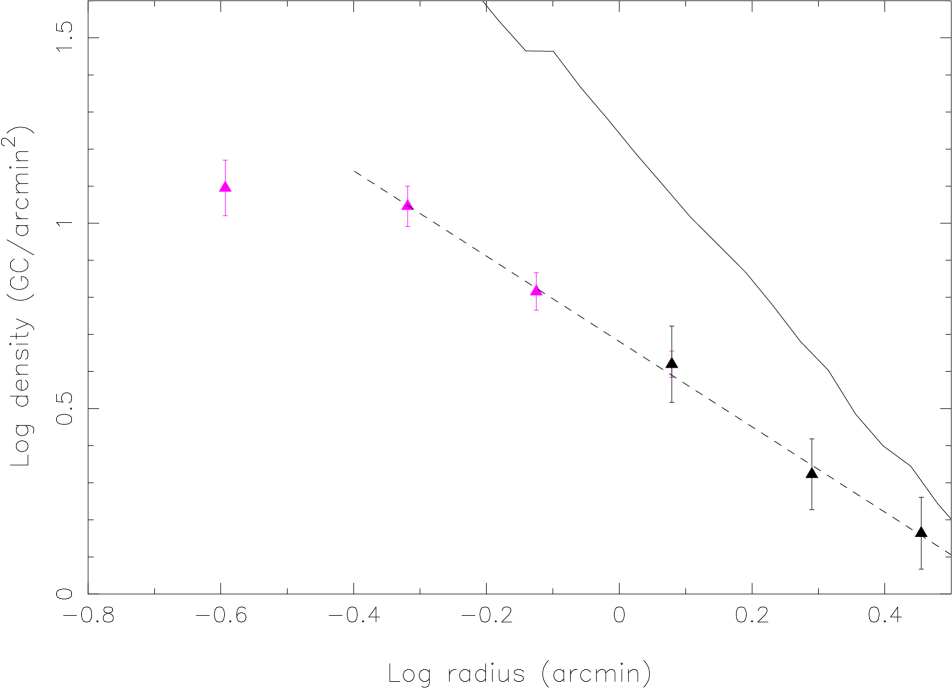
In Figure 19 we show a plot of surface density versus galactocentric radius for NGC 1400 GCs. The local background density calculated previously has been subtracted from the Keck data points (the WFPC2 data points are assumed to have negligible background contamination). A correction has been made for the missing area in each radial annulus. The profile shows a near constant core region and rapid fall-off in the outer parts, similar to that seen in NGC 1407. An isothermal core profile fit to the WFPC2 data points gives a core radius = 0.76 0.10 arcmin (4.7 0.8 kpc). A simple power-law fit (), excluding the inner most point, gives a slope of –1.15 0.01. Perrett et al. (1997) found –2.35 0.78 in the -band and –1.57 0.34 in the -band. The declining slope suggests that the NGC 1400 GC system extends out to at least a galactocentric radius of 3.3′ (20 kpc). The figure also shows the NGC 1400 -band surface brightness profile from the Keck data converted to logarithm space with an arbitrary vertical normalisation applied. The galaxy starlight gradient is –1.88, which is steeper than that of the GCs.
6.3 Globular Cluster System Position Angle
A histogram of folded position angle from the Keck data is given in Figure 20 which shows a fairly flat distribution, within the errors. This was constructed using objects within a 2.6′ radius of the centre of the galaxy, for which we had complete coverage. Thus like NGC 1407, the GC distribution around NGC 1400 is consistent with no preferred position angle as might be expected for a nearly circular host galaxy. This is further reinforced by an ellipticity calculation which yielded 0.2 0.1, corresponding to an E2 distribution.

7 Discussion and Conclusions
From our combined Keck and Hubble Space Telescope imaging we have measured several properties of the globular cluster systems associated with NGC 1407 and NGC 1400 in the Eridanus cloud. We have detected bimodality in the GC colour distribution for both galaxies. This indicates the presence of two GC subpopulations in these galaxies, similar to the situation for most well studied early-type galaxies.
For NGC 1407, we clearly detect bimodality with a blue (metal-poor) 40% subpopulation of mean colour of = 1.61 0.02, and a red (metal-rich) 60% subpopulation with = 2.06 0.02 from HST/ACS imaging. Using the relation of Barmby et al. (2000) to transform colour into metallicity (i.e. assuming that the NGC 1407 GCs are predominately old), then the subpopulations correspond to [Fe/H] = –1.45 and –0.19. The Keck imaging results are less obviously bimodal but consistent with the ACS results.
For NGC 1400 we detect bimodality in the Keck data at 1.65 and 2.28, however with only 74 candidate GCs detected such values could be subject to systematic offset. In the HST/WFPC2 dataset we have over 200 GCs, however the colour is much less sensitive to metallicity than making it more difficult to detect any bimodality. The colour distribution is formally unimodal but hints at peaks around 0.9 and 1.1 0.05. This would correspond to = 1.55 0.1 and 1.95 0.1.
Such colour peaks are reminiscent of the GC systems of NGC 1399 and NGC 1404 in the Fornax cluster (Forbes et al., 1998). These galaxies have similar luminosities (MV = –22.00 and MV = –21.46 respectively for m–M = 31.49) as NGC 1407 and NGC 1400. GC colour peaks were found at = 1.7 and 2.1 0.05 for NGC 1399 and 1.6 and 2.1 0.05 for NGC 1404, i.e. similar to those seen in NGC 1407 and NGC 1400.
We can compare the subpopulation mean colours with predictions from the colour-galaxy luminosity scaling relation of Strader et al. (2004) after conversion . For NGC 1407, peaks at = 1.61 and 2.06 correspond to = 0.93 and 1.16 using the transformation of Forbes & Forte (2001). These values are very consistent with that expected for a MV = –21.86 galaxy. For NGC 1400, the blue peak at = 1.62 or = 0.94 is also consistent for its luminosity of MV = –20.63. However, the red peak at around = 2.29 or = 1.28 is much redder than the Strader et al. (2004) relation. This suggests that the red subpopulation in NGC 1400 is poorly defined in terms of its peak colour.
In addition to measuring the mean colour of the two subpopulations, we have also measured the width of the subpopulations for NGC 1407. We find that both subpopulations are intrinsically broad (indicating a range of ages and/or metallicities), with the red subpopulation being broader than the blue.
We find the half–light radius of red GCs to be on average 20% smaller than those of blue GCs. Smaller relative sizes for the red GCs has been reported for several galaxies (Kundu & Whitmore 1998; Larsen et al. 2001). Larsen & Brodie (2003) have speculated that the sizes differences may not be real but due to projection effects. If so, they predict a relatively strong size–galactocentric radius relation. We find no evidence for such a trend in our data, in either the combined or blue and red GC subpopulations separately. Although we note that a careful modeling of the projected and 3D relations is needed to conclusively rule out this possibility. An alternative explanation, that predicts no size–galactocentric radius trend is that proposed by Jordan (2004). He suggests that the process of mass segregation and stellar evolution effects will result in a smaller measured half–light radius for the metal-rich GCs. Assuming coeval populations, an initial mass function, Michie-King isotropic models and constant half–mass radii, his favoured model predicts that the red subpopulation of NGC 1407 ([Fe/H] = –0.19) will have half–light radii that are 20% smaller than the blue subpopulation ([Fe/H] = –1.45). This is entirely consistent with our measurements. Jordan notes that if the metal-rich GCs were younger by 3 Gyrs, then the predicted size difference would increase to 30%. Thus within the assumptions of the model, our size measurements suggest that the GC system of NGC 1407 is old and coeval.
We also find half a dozen objects with effective radii of 20–40 pc. They may be related to the ‘faint fuzzies’ seen in some S0 galaxies (Larsen & Brodie 2000). However the faint fuzzies tend to be quite red, whereas these large objects in NGC 1407 are not particularly red. Alternatively, they could be related to Ultra Compact Dwarfs (UCDs) which have been observed around some elliptical galaxies (e.g. Drinkwater et al. 2004; Richtler 2005). Although our large objects do not have the bright magnitudes expected of UCDs associated with NGC 1407. Given their large sizes and elongations, we suspect they are background galaxies.
The GC surface density profiles of both galaxies reveal a near constant density central region with a power-law like fall off in the outer parts, similar to those seen in other GC systems. We have fit the central region with an isothermal ‘core’ profile deriving a GC core radius of 7.5 0.7 kpc for NGC 1407 and 4.6 0.8 kpc for NGC 1400. These values can be compared to the GC core radius-galaxy luminosity scaling relation found by Forbes et al. (1996). Both NGC 1407 and NGC 1400 would appear to have larger core radii than galaxies of similar luminosity. Such core radii in GC systems may be due to destruction via tidal shocks (Vesperini et al., 2003). However, we find no evidence for a mean GC magnitude that varies with galactocentric radius as might be expected. An alternative explanation for the GC system core region is that of dissipationless merger events or accretions (Bekki & Forbes, 2005).
For NGC 1407, we had sufficient GC numbers to separate the blue and red subpopulations. We found the red subpopulation to have a core radius of 6.1 0.8 kpc and outer slope of –1.50 0.06, while the blue one was somewhat larger with 14.2 1.0 kpc and slope of –1.65 0.29. This difference in subpopulation core size, if found in a number of galaxies, needs to be understood.
Beyond the central core region the GC surface density slopes were compared to the galaxy starlight. For NGC 1407 the GC and galaxy starlight slopes were very similar, around –1.5. However, the GC profile for NGC 1400 (from the limited Keck data) appears to be significantly flatter than the galaxy slope. Both galaxies reveal GC slopes that lie within the cosmic scatter of the GC slope-galaxy luminosity scaling relation (Harris, 1986).
For both NGC 1407 and NGC 1400 we find that their GC systems have a similar ellipticity (i.e. near zero) and azimuthal distribution (i.e. no strong position angle dependence) as the underlying galaxy starlight. Similar trends have been seen in other galaxies (e.g. Forbes et al. 1996).
Using the ACS data for NGC 1407, we have fit the GC luminosity function taking into account photometric errors and incompleteness. Our I-band fits agree very well with those of Perrett et al. (1997). As well as fitting the total GC system, we fit the blue and red subpopulations separately. In the B-band, we find the red GC subpopulation to have have a turnover magnitude that is 0.29 magnitudes fainter than the blue one. In the I-band the turnover magnitudes are similar.
After applying appropriate colour corrections, the accuracy of the distance modulus is not significantly changed using the total GC system or one of the subpopulations. We derive a distance modulus from the GC luminosity function of 31.6 0.1. This is similar to distance estimates from the Faber-Jackson relation and the Hubble distance for Ho = 72 km/s/Mpc. However, this distance lies at the midpoint of recent SBF distance determinations (i.e m–M = 31.0 and 32.2) and is inconsistent with the Dn– distance of 32.2 0.2.
8 Acknowledgments
We thank M. Beasley for his help obtaining the Keck images, and S. Larsen for useful comments on the text. Both DF and PSB thank the ARC for financial support. JB, JS and LS thank the NSF grant AST 0206139 for financial support. Finally we thank the referee, W. Harris, for several useful suggestions that have improved the paper.
References
- Ashman et al. (1994) Ashman, K., Bird, C., Zepf, S., 1994, AJ, 108, 2348
- Ashman et al. (1995) Ashman, K., Conti, A., Zepf, S., 1995, AJ, 110, 1164
- Barmby et al. (2000) Barmby, P., Huchra, J., Brodie, J., Forbes, D., Schroder, L., Grillmair, C., 2000, AJ, 119, 727
- Bender, Burstein & Faber (19927) Bender, R., Burstein, D., Faber, S. M., 1992, ApJ, 399, 462
- Bekki & Forbes (2005) Bekki, K., Forbes, D., 2005, ApJL, submitted
- Bruzual & Charlot (2003) Bruzual, G., Charlot, S., 2003, MNRAS, 344, 1000
- Cantiello (2005) Cantiello, M., Blakeslee, J., Raimondo, G., Mei, S., Brocato, E., Capaccioli, M., 2005, ApJ, 634, 239
- Cenarro et al. (2005) Cenarro, J., Brodie, J., Strader, J., Beasley, M., 2005, in prep.
- Denicolo et al. (2005) Denicolo, G., Terlevich, R., Terlevich, E., Forbes, D., Terlevich, A., 2005, MNRAS, 358, 813
- Drinkwater et al. (2004) Drinkwater, M., et al. 2004, PASA, 21, 375
- Faber et al. (1989) Faber, S., et al. 1989, ApJS, 69, 763
- Forbes et al. (1996) Forbes, D. A., Franx, M., Illingworth, G. D., Carollo, C. M., 1996, ApJ, 467, 126
- Forbes et al. (1998) Forbes, D., Grillmair, C., Williger, G., Elson, R., Brodie, J., 1998, MNRAS, 293, 325
- Forbes & Forte (2001) Forbes, D., Forte, J., 2001, MNRAS, 322, 257 Gebhardt, K., Kissler-Patig, M., 1999, AJ, 118, 1526
- Gnedin (1997) Gnedin, O., 1997, ApJ, 487, 663
- Gould (1993) Gould, A., 1993, ApJ, 403, 37
- Harris (1979) Harris, W., Racine, R., 1979, ARAA, 17, 241
- Harris (1986) Harris, W., 1986, AJ, 91, 822
- Harris (1991) Harris, W., 1991, ARAA, 29, 543
- Harris (1996) Harris, W., 1996, AJ, 112, 1487
- Harris (2001) Harris, W., 2001, in Star Clusters, ed. L. Labhardt & B. Binggeli, Springer-Verlag, Berlin
- Harris (2005) Harris, W., Whitmore, B., Karakla, D., Okon, W., Baum, W., Hanes, D., Kavelaars, J., 2005, astro-ph/0508195
- Jordon (2004) Jordan, A., 2004, ApJL, 613, 117
- Jensen et al. (2005) Jensen, J., et al., 2005, ApJ, 583, 712
- Kundu & Whitmore (1998) Kundu, A., Whitmore, B., 1998, AJ, 116, 2841
- Kundu & Whitmore (2001) Kundu, A., Whitmore, B., 2001, AJ, 122, 1251
- Larsen & Brodie (2000) Larsen, S., Brodie, J., 2000, AJ, 120, 2938
- Larsen et al. (2001) Larsen, S., Brodie, J., Huchra, J., Forbes, D., Grillmair, C., 2001, ApJ, 556, 801
- Larsen & Brodie (2003) Larsen, S., Brodie, J., 2003, ApJ, 592, 340
- Michard & Prugniel (2004) Michard, R., Prugniel, P., 2004, A&A, 423, 833
- Oke et al. (1995) Oke, J. B., Cohen, J. G., Carr, M., Cromer, J., Dingizian, A., Harris, F. H., Labrecque, S., Lucinio, R., Schaal, W., Epps, H., Miller, J., 1995, PASP, 107, 375
- Osmond & Ponman (2004) Osmond, J. P. F., Ponman, T. J., 2004, MNRAS, 350, 1511
- Perrett et al. (1997) Perrett, K. M., Hanes, D. A., Butterworth, S. T., Kavelaars, J. J., Geisler, D., Harris, W. E., 1997, AJ, 113, 895
- Prugniel & Simien (1996) Prugniel, P., Simien, F., 1996, A&A, 309, 749
- Richtler (2003) Richtler, T., 2003, astro-ph/0304318
- Richtler (2005) Richtler, T., 2005, astro-ph/0505320
- Secker & Harris (1993) Secker, J., Harris, W., 1993, AJ, 105, 1358
- Sirianni et al. (2005) Sirianni, M., et al., 2005, PASP, submitted
- Strader et al. (2004) Strader, J., Brodie, J., Forbes, D., 2004, AJ, 127, 3431
- Strader et al. (2005) Strader, J., Brodie, J., Spitler, L., Beasley, M., 2005, astro-ph/0508001
- Stetson (1987) Stetson, P.B., 1987, PASP, 99, 191
- Tonry et al. (1991) Tonry, J., 1991, ApJL, 373, 1
- Tonry et al. (2001) Tonry, J., Dressler, A., Blakeslee, J. P., Ajhar, E. A., Fletcher, A. B., Luppino, G. A., Metzger, M. R., Moore, C. B., 2001, ApJ, 546, 681
- Vesperini et al. (2003) Vesperini, E., Zepf, S., Kundu, A., Ashman, K., 2003, ApJ, 593, 760
Appendix A Globular Cluster Lists
| ID | R.A. | Dec. | err | err | |||
|---|---|---|---|---|---|---|---|
| (J2000) | (J2000) | (arcsec) | (mag) | (mag) | (mag) | (mag) |
| ID | R.A. | Dec. | err | err | |||
|---|---|---|---|---|---|---|---|
| (J2000) | (J2000) | (arcmin) | (mag) | (mag) | (mag) | (mag) |
| ID | R.A. | Dec. | err | err | |||
|---|---|---|---|---|---|---|---|
| (J2000) | (J2000) | (arcsec) | (mag) | (mag) | (mag) | (mag) |
| ID | R.A. | Dec. | err | err | |||
|---|---|---|---|---|---|---|---|
| (J2000) | (J2000) | (arcmin) | (mag) | (mag) | (mag) | (mag) |