Spectroscopy of QUEST RR Lyrae Variables: the new Virgo Stellar Stream
Abstract
Eighteen RR Lyrae variables (RRLs) that lie in the ” clump” identified by the QUEST survey have been observed spectroscopically to measure their radial velocities and metal abundances. Ten blue horizontal branch (BHB) stars identified by the Sloan Digital Sky Survey (SDSS) were added to this sample. Six of the 9 stars in the densest region of the clump have a mean radial velocity in the galactic rest frame () of 99.8 and = 17.3 , which is slightly smaller than the average error of the measurements. The whole sample contains 8 RRLs and 5 BHB stars that have values of suggesting membership in this stream. For 7 of these RRLs, the measurements of [Fe/H], which have an internal precision of 0.08 dex, yield and = 0.40. These values suggest that the stream is a tidally disrupted dwarf spheroidal galaxy of low luminosity. Photometry from the database of the SDSS indicates that this stream covers at least 106 deg2 of the sky in the constellation Virgo. The name Virgo Stellar Stream is suggested.
1 INTRODUCTION
A cornerstone of the popular hierarchical picture of galaxy formation is the growth of galaxies with time through multiple mergers. For example, simulations of this process in the framework of CDM cosmology by Bullock & Johnston (2004), suggest that a large galaxy such as the Milky Way experienced 100 mergers with dwarf satellite galaxies, and most of them occurred in the first few billion years after the Big Bang. The advent of large-scale surveys of the galactic halo during the past decade has provided conclusive proof of co-moving groups of stars (stellar streams) exhibiting the kinematic and stellar properties of tidally destroyed dwarf galaxies. The most clear-cut of these are the streams from the Sagittarius (Sgr) dwarf spheroidal (dSph) galaxy and the Monoceros stream (Newberg et al., 2002; Ibata et al., 2003) but a few other less conspicuous, and more uncertain, have been reported. It is also clear that other galaxies, most notably M31 (Ibata et al., 2001), have experienced multiple mergers. The question is not whether mergers occurred, but whether or not the number of mergers and their properties match the predictions of the hierarchical picture.
In this paper, we report spectroscopic observations of the ” clump” of RRLs that was first revealed as an over-density in the QUEST RRL survey (Vivas et al., 2001; Vivas, 2002; Vivas & Zinn, 2003; Zinn et al., 2004; Ivezić et al., 2005) and later in the Sloan Digital Sky Survey (SDSS) as an excess of F type main-sequence stars (Newberg et al., 2002). The clump is roughly centered at right ascension (RA) (186), spans the RA range of 175-200, the -2.3 to 0.0 range in declination (Dec) of the QUEST survey, and the galactic longitude and latitude ranges of 279-317 and 60-63, respectively. These RRLs have mean V magnitudes, corrected for extinction, equal to , which with for RRLs, yields a distance from the Sun () of 19 kpc. Speculation on the origin of this clump has centered on the possibility that it is part of the streams of stars from the Sgr dSph galaxy (Majewski et al., 2003; Martinez-Delgado et al., 2004) or the stream from a now extinct dSph galaxy (Vivas & Zinn, 2003).
2 OBSERVATIONS
Our campaign to obtain spectroscopic observations of the RRLs in the clump began in 2001, but only very modest success was obtained until 2005 because of poor weather and instrument malfunction. Eighteen RRLs have now been observed (QUEST # 177, 182, 189, 191, 195, 196, 199, 200, 205, 209, 210, 224, 225, 226, 233, 236, 237, 261), and 12 have been observed more than once. With the ESO 1.5m and the Clay Magellan 6.5m telescopes, we obtained spectra centered at 4500Å with resolutions of 3.1Å and 4.3Å, respectively. With the WIYN telescope, we obtained spectra centered at 8550Å with a resolution of 2.9Å. Comparison lamp exposures were taken before and after each stellar one. Stars from Layden (1994) were also observed to serve as standard stars for radial velocity and for his pseudo-equivalent width system. With the blue spectra, we cross-correlated each target spectrum with 10 spectra of several radial velocity standards of similar spectral type. With the red spectra, we fitted Gaussian line profiles to unblended Paschen lines of hydrogen. To measure the systemic velocity, we fitted the radial velocity curve of X Arietis to the type ab variables (see Vivas, Zinn, & Gallart 2005) and for the type c stars (191 & 224) we fitted a template that we constructed from velocity curves of T Sex and DH Peg. The errors in velocities were calculated taking into account the uncertainties in the phases of the observations, the template velocity curves, and the fits. These errors range from 8 to 22 , with a mean value of 17 . Because the RRLs are spread out over 20 in RA, the Sun’s peculiar motion and the motion of the Local Standard of Rest contribute different amounts to their radial velocities. We have therefore removed these effects and base the following analysis on the galactic standard of rest velocity (), which is the radial velocity measured by an observer at the Sun who is at rest with the galactic center. To measure [Fe/H] from the blue spectra of the type ab variables, we followed closely Layden’s variation of the Preston S technique (Layden, 1994), which cannot be applied to red spectra or to type c stars. The average for stars observed more than once is 0.08 dex, which we consider the internal precision obtained with only one spectrogram (the external error is 0.15 dex, Layden 1994).
To this sample of RRLs, we added 10 BHB stars that were discovered by Sirko et al. (2004a) in the RA range 175-205, the Dec range -2.5-0.0, and the range 15-25 kpc. These stars occupy lines 22, 23, 28, 35, 38, 41, 112, 121, 126, and 774 in table 3 of Sirko et al. (2004a). We have adopted their values of ( in their nomenclature) and also their values of , which are on essentially the same distance scale as the RRLs. Sirko et al. (2004a) estimated that their velocities have an average of about 26 .
3 The Kinematic Signature of the Stream
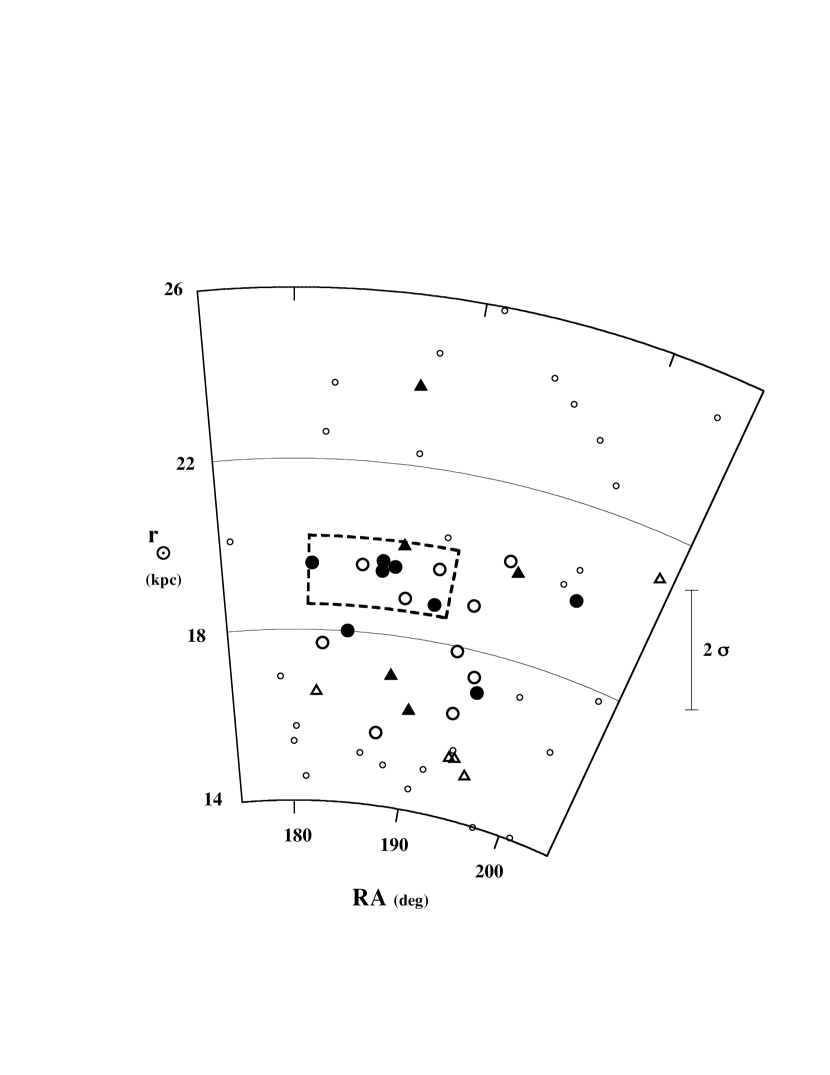
In Fig. 1, we have plotted our selection of RRLs and BHB stars together with the other QUEST RRLs in the region 175RA and 1426 kpc, which encompasses the clump. A very tight configuration of RRLs exists at RA 186 and 19.6 kpc, and we have drawn a box around this ”central region” in Fig. 1. We drew this box so as to include a reasonable sample ( 1/3) of the total number of stars that had been observed spectroscopically and none that had not been observed. The model of the galactic halo that Vivas & Zinn (2003) found was a good match to the distribution of type ab RRLs outside the densest regions in the QUEST catalogue predicts that this box should contain only 0.8 of a type ab variable. Since the type c to ab ratio ranges from 0.2 to 0.8 in globular clusters, depending on Oosterhoff class (Smith, 1995), the box is expected to contain 1 to 1.4 RRLs of all types. The observed number of 8 RRLs, 7 type ab and 1 type c, is clearly a large excess over the expected number. Expanding the box by either reducing the lower limit on by 2 kpc or by increasing the upper RA limit by 5 produces only a little dilution of the kinematic signature of the stream.
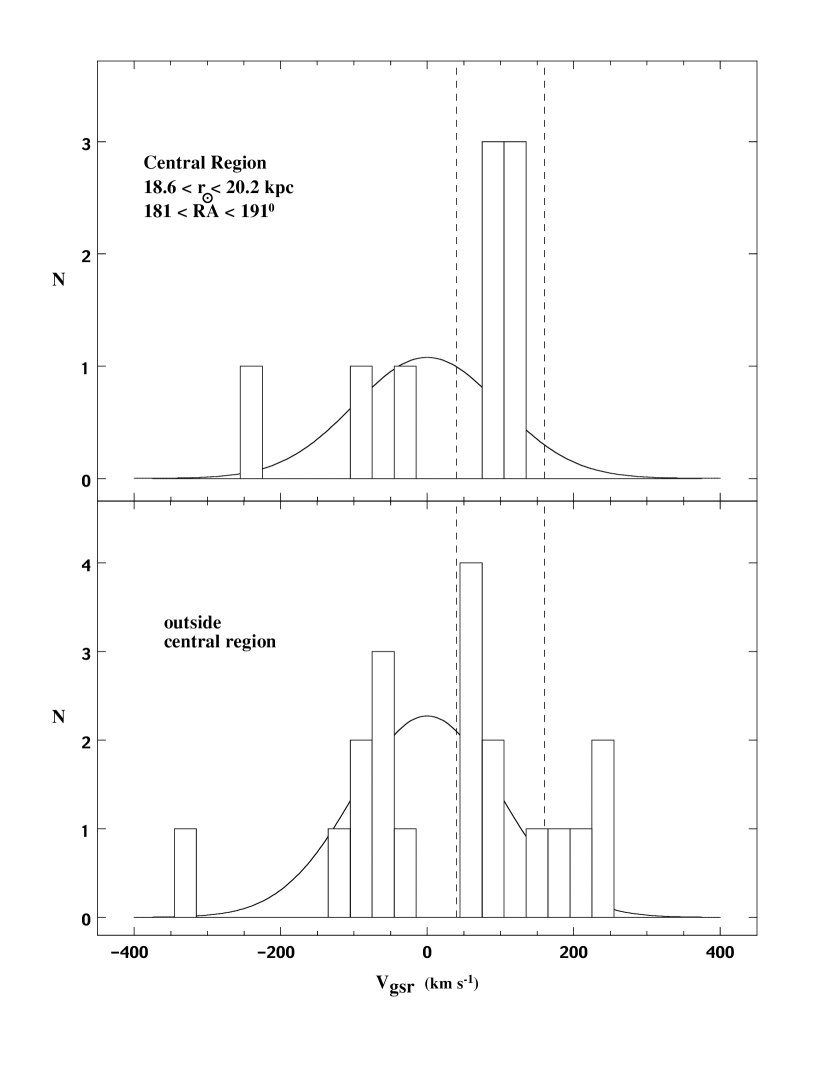
In the upper panel of Fig. 2, we show the histogram of the values of the 9 stars in the box in Fig. 1. The bins are 30 wide, which is slightly larger than the 1 errors of the stars with least precise measurements. Also plotted is a normal distribution for and = 100 . A random selection of halo stars is expected to a have a normal distribution (e.g., Harding et al., 2001) and values of and close to these values (Sirko et al., 2004b; Brown et al., 2005). Harding et al. (2001) recommended the Shapiro & Wilk (1965) statistical test of normality as a criterion to apply to halo fields that may harbor stellar streams. According to this test, the values of the 9 stars are not normally distributed (98% confidence), and this test is completely independent of any choices for the mean or of the normal distribution. Six of the 9 stars have very closely clustered values of , , and remarkably = 17.3 , which is smaller than the average error (18.8 ) of the velocity for these stars. This tight velocity distribution in a volume of space where there is clearly an excess of RRLs is unequivocal evidence for a stellar stream. We suggest that it be called the Virgo Stellar Stream (VSS) after the constellation in which it is found.
We do not expect to see such a narrow peak in as the sample is expanded because our measuring errors are substantial, the stream probably has some intrinsic dispersion in velocity, and perhaps also a gradient in with position. Therefore to investigate the size of the stream, we consider as possible member any star whose lies within 60 of the of the central region (i.e., , between the vertical dashed lines in Fig. 2). In terms of the measuring errors, this range corresponds to 2.3 and 3.6 for the BHB stars and RRLs, respectively. Consequently, in absence of a sizable velocity dispersion and/or gradient, this range is likely to include all the members.
The histogram of the values of for the stars lying outside of the central region is shown in the lower panel of Fig. 2. The kinematic signature is much diluted, but it is not completely absent, for there is an excess of stars in range expected of members. Several of these stars have lower values of than the members in the central region. This could be due to a velocity gradient, but it is also consistent with the measuring errors and the contamination by non-members,which are more likely to have small values of than larger ones. We have plotted as solid symbols in Fig. 1 the 13 stars111Eight of them are RRL stars (177, 189, 195, 196, 199, 210, 237 & 261) and 5 are BHB stars (# 22, 23, 28, 38, 121, in table 3 Sirko et al. 2004a) in the whole sample that meet the criterion for membership. These stars span large ranges in RA and , suggesting that the VSS is both large and diffuse. Two of these stars stand out as the most likely non-members: BHB star 23, which lies 4 kpc more distant than the major concentration, and RRL 261, which is the RRL lying farthest to the East and is also the star in this sample with the largest value of . The removal of these two stars from the sample changes and from 85.4 and 31.4 , respectively, to 83.2 and 24.5 . Since this last is not much larger than the average measuring error for this sample (20.3 ), more precise measurements are needed to refine the membership criterion and to be certain that the velocity dispersion has been resolved. Our future measurements of RRLs should indicate whether the VSS extends in the directions suggested by BHB 23 and RRL 261.
4 The Signature in the Luminosity Function
Newberg et al. (2002) discovered an excess of F type main-sequence stars in SDSS in the direction to the clump and at the appropriate magnitude to be related to the RRLs (feature S297+63-20.0). In fig. 1 of Newberg et al. (2002), the globular cluster Pal 5 appears as a streak pointing radially toward the Sun. This is a sign that this method, which is excellent for finding halo substructure, may not locate precisely an old stellar population. We have therefore examined the SDSS photometry for evidence of the upturn in the luminosity function (LF) of an old stellar population that occurs near the magnitude where the subgiant branch (SGB) and the main-sequence (MS) merge (see also Martinez-Delgado et al. 2002).
The method is illustrated in the top 3 panels of Fig. 3. The top left panel shows the color magnitude diagram (CMD) of 22 centered on the globular cluster Pal 5. The cluster and its tidal tails occupy only a fraction of this field. The top middle panel is the CMD of a control field of equal area. The top right panel shows the LFs of the Pal 5 field and the control field. These functions were constructed using the color indices c1 and c2 as defined by Odenkirchen et al. (2001) and their filtering technique, which minimizes the contamination by poor measurements and by field stars. While the presence of Pal 5 is clearly detectable in the CMD itself, it is very evident in the right panel as a sharp increase in the number of stars at g20.25, which is roughly the magnitude of the SGB (the MS turn-off is 0.5 fainter, Smith et al. 1986).
The middle panels in Fig. 3 show the CMDs and the LFs of the central part of the VSS and a comparison field. The 3 RRLs in this VSS field have , whereas the 5 RRLs in Pal 5 have (Vivas et al., 2004). If VSS resembles Pal 5, a sharp upturn in the LF is expected at g19.9. While the VSS field shows an excess of stars over its comparison field at this magnitude, its LF clearly does not mimic that of Pal 5. However, Pal 5 is a moderately metal-rich globular cluster ([Fe/H] = -1.47, Zinn & West 1984), and it has the combination of age and metallicity that produces a nearly horizontal SGB and consequently a very sharp upturn in the LF . The 7 RRLs in the VSS with measurements of [Fe/H] have a mean value of -1.86, which suggests that a more metal-poor globular cluster than Pal 5 would be a better comparison object. The LF constructed by Zaggia, Piotto, & Capaccioli (1997) for the globular cluster M55 ([Fe/H] = -1.82, Zinn & West 1984) shows a more gradual increase because its SGB is more steeply inclined in the CMD than Pal 5’s. If the LF of VSS resembles that of M55, a relatively gradual climb in the number of stars is expected to start at , or g. Since the LF in the middle panel of Fig. 3 shows this behavior, we believe the excess of F type main-sequence stars first recognized in the SDSS data by Newberg et al. (2002) is indeed the MS of the VSS. The bottom panels show the CMDs and the LFs for a field 10 to the East of the central one, where the VSS appears to be present but not as strongly as in the central one.
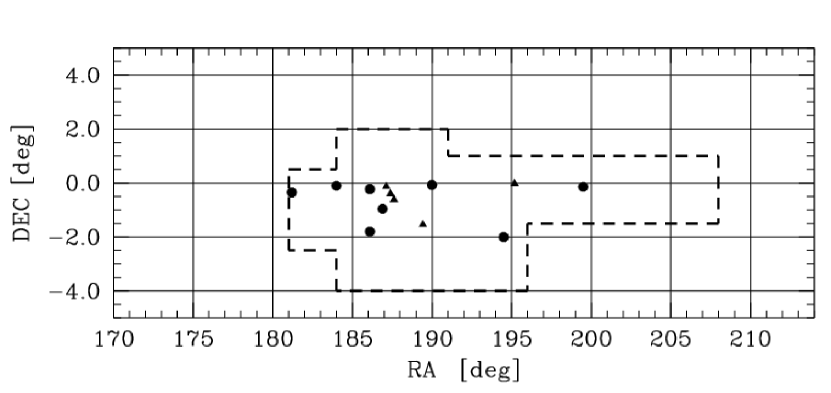
Using this technique with the SDSS photometry, we searched for the VSS in 272 deg2, between 176 RA 210 & -4 Dec +4. We considered that the VSS was detected if in the range the number of stars in the target field was consistently greater than the number in the control field by an amount larger than the combined Poisson errors. The control and target fields had similar galactic latitudes but were offset from each other by 10 or more degrees. Fig. 4 shows the region of the sky ( 106 deg2) where the VSS was detected. Towards the east, the VSS becomes less prominent due to the progressive increase of the field population. The northen part of the VSS ( Dec ) has a somewhat brighter upturn in the LF than the southern portion ( Dec ), which indicates that it is closer to the Sun.
5 Discussion
The previous suggestions (Majewski et al., 2003; Martinez-Delgado et al., 2004) that the clump of RRLs may be part of the streams from the Sgr dSph are inconsistent with our observations. The model of the Sgr streams by Martinez-Delgado et al. (2004) predicts a very low density of Sgr stars in this volume of space, which is in conflict with the concentration seen in Fig. 1. The models by Law, Johnston, & Majewski (2005) that assume either a spherical or an oblate shape for the Milky Way’s dark matter halo, predict more significant numbers of Sgr stars in this volume but with -180 and -260 , respectively. These values are completely incompatible with the of the VSS (+83 or +100 , depending on sample selection). According to the prolate model of Law, Johnston, & Majewski (2005), this region should not contain debris from Sgr.
Based on our measurements for 7 type ab RRLs that have values of that are consistent with membership, the VSS has and = 0.40. Because this dispersion is several times the average of the values (0.08), we conclude that the VSS has a significant range in [Fe/H]. A range of this magnitude is characteristic of all the dSph satellite galaxies of the Milky Way, but not of the vast majority of globular clusters. The VSS is probably the debris of a disrupted dSph galaxy. There is no sign of a significant intermediate age population in the CMDs from the SDSS data (Newberg et al. 2002 and the ones we produced), and the lists of halo carbon stars (Totten & Irwin, 1998; Mauron et al., 2004; Mauron, Kendall, & Gigoyan, 2005) do not contain any that are consistent with membership in the VSS. Thus, the progenitor of the VSS appears to have been a system dominated by its very old stellar population. These properties suggest that of the extant dSph galaxies, the VSS may most closely resemble the ones of the lowest luminosity, e.g., Ursa Minor, Draco, and Sextans (Mateo, 1998).
Finally, our measurements have also revealed a few other interesting features. Ignoring the VSS stars, there are some smaller groups of stars that have positions and values of that suggest possible membership in the same ”moving group” (e.g., RRL 226, 233, & BHB 35; RRL 224, 225, 236 & BHB 126). Furthermore, if we consider together the 15 stars that are not members of the VSS and the two that have low probabilities of membership (RRL 261 & BHB 23), we find and = 163.7 . This value of is remarkably large, and it is inconsistent at above the 95% confidence level (F test) with the value of 101.6 that Sirko et al. (2004b) found from their sample of 1170 BHB stars with median 25 kpc. The origin of this kinematically hot distribution, the possibility of other streams besides the VSS, and the relationship of the VSS to the large feature recently reported by Jurić et al. (2005) in Virgo are being investigated as we obtain additional spectroscopy of QUEST RRLs.
References
- Bullock & Johnston (2004) Bullock, J. S. & Johnston, K. V. 2004, ASPC, 327, 80
- Brown et al. (2005) Brown, W. R. et al., 2005, AJ, 130, 1097
- Harding et al. (2001) Harding, P. et al., 2001, AJ, 122, 1397
- Ibata et al. (2001) Ibata, R. et al., 2001, Nature, 412, 49
- Ibata et al. (2003) Ibata, R. A. et al., 2003, MNRAS, 340, L21
- Ivezić et al. (2005) Ivezić, Ž. et al., 2005, AJ, 129, 1096
- Jurić et al. (2005) Jurić, M., et al., 2005, astro-ph/0510520
- Layden (1994) Layden, A. C. 1994, AJ, 108, 1016
- Law, Johnston, & Majewski (2005) Law, D. R., Johnston, K. V., & Majewski, S. R. 2005, ApJ, 619, 807
- Majewski et al. (2003) Majewski, S. R. et al., 2003, ApJ, 599, 1082
- Martinez-Delgado et al. (2002) Martinez-Delgado, D. et al., 2002, ApJ, 573, L19
- Martinez-Delgado et al. (2004) Martinez-Delgado, D. et al., 2004, ApJ, 601, 242
- Mateo (1998) Mateo, M. 1998, ARA&A, 36, 435
- Mauron et al. (2004) Mauron, N. et al., 2004, A&A, 418, 77
- Mauron, Kendall, & Gigoyan (2005) Mauron, N., Kendall, T. R., & Gigoyan, K. 2005, A&A, 438, 867
- Newberg et al. (2002) Newberg, H. J. et al., 2002, ApJ, 569, 245
- Odenkirchen et al. (2001) Odenkirchen, M. et al., 2001, ApJ, 548, L165
- Shapiro & Wilk (1965) Shapiro, S. S. & Wilk, M. B. 1965, Biometrika, 52, 591
- Sirko et al. (2004a) Sirko, E. et al., 2004a, AJ, 127, 899
- Sirko et al. (2004b) Sirko, E. et al., 2004b, AJ, 127, 914
- Smith et al. (1986) Smith, G. H. et al., 1986, AJ, 91, 842
- Smith (1995) Smith, H. A. 1995, RR Lyrae Stars, Cambridge University Press, 1995
- Totten & Irwin (1998) Totten, E. J. & Irwin, M. J. 1998, MNRAS, 294, 1
- Vivas et al. (2001) Vivas, A. K. 2001, ApJ, 554, L33
- Vivas (2002) Vivas, A. K. 2002, PhD Thesis, Yale University
- Vivas & Zinn (2003) Vivas, A. K. & Zinn, R. 2003, Mem. Soc. Astron. Italiana, 74, 928
- Vivas et al. (2004) Vivas, A. K. et al. 2004, AJ, 127, 1158
- Vivas, Zinn, & Gallart (2005) Vivas, A. K., Zinn, R., & Gallart, C. 2005, AJ, 129, 189
- Zaggia, Piotto, & Capaccioli (1997) Zaggia, S. R., Piotto, G., & Capaccioli, M. 1997, A&A, 327, 1004
- Zinn & West (1984) Zinn, R. & West, M. J. 1984, ApJS, 55, 45
- Zinn et al. (2004) Zinn, R. et al., 2004, ASPC, 327, 92