The Young Open Cluster NGC 2129
Abstract
The first CCD photometric study in the area of the doubtful open cluster NGC 2129 is presented. Photometry of a field offset 15 arcmin northward is also provided, to probe the Galactic disk population toward the cluster. Using star counts, proper motions from the UCAC 2 catalog, colour-magnitude and colour-colour diagrams we demonstrate that NGC 2129 is a young open cluster. The cluster radius is 2.5 arcmin, and across this region we find evidence of significant differential reddening, although the reddening law seems to be normal toward its direction. Updated estimates of the cluster fundamental parameters are provided. The mean reddening is found to be E=0.800.08 and the distance modulus is = 11.70. Hence, NGC 2129 is located at 2.20.2 kpc from the Sun inside the Local spiral arm. The age derived from 37 photometrically selected members is estimated to be approximately 10 million years. These stars are used to provide new estimates of the cluster absolute proper motion components.
keywords:
Open clusters and associations: general – open clusters and associations: individual: NGC 2129 -Hertzsprung-Russell (HR) diagramThe open clusters NGC 2129
1 Introduction
NGC 2129 ( = OCL 467 = C 0558+233) with , and ,
, J2000.0) is a clustering of stars located in the
Gemini constellation, about 2 degrees southwest of the more
conspicuous open clusters M 35 and NGC 2158 towards the Galactic
anticenter.
According to Trumpler (1930) the cluster is moderately
concentrated, has a wide range in star brightness, and it is
relatively rich (class II 3 m ).
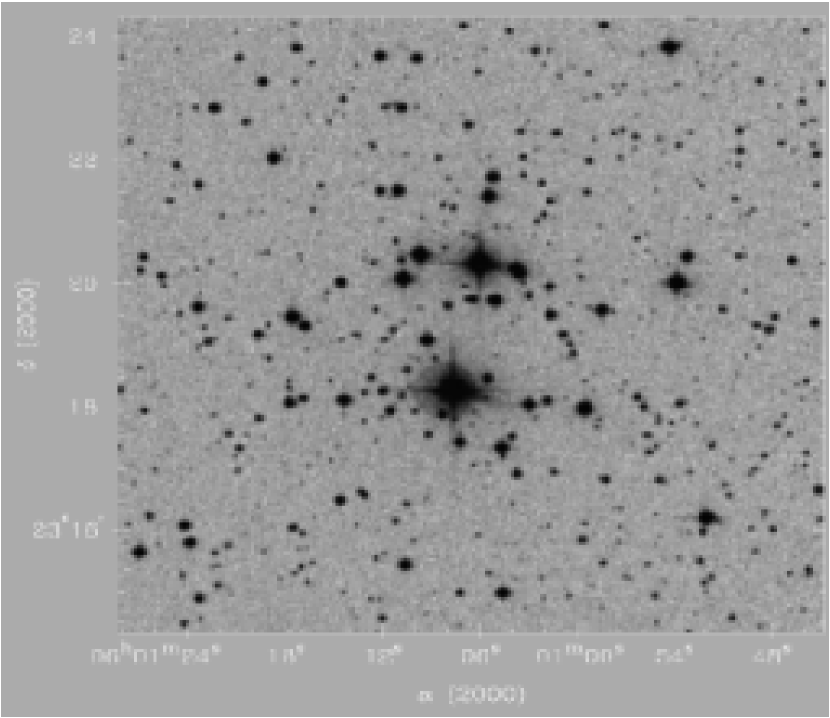
The group is dominated (see Fig. 1) by two close bright stars HD 250289 (LS V +23 15, V = 8.25) and HD 250290 (LS V +23 16, V = 7.36). Within the errors, these two stars share the same proper motion (Høg et al. 2000) and radial velocity (Liu et al. 1989). HD 250289 has , , and [km/sec] while HD 250290 has -+, and [km/sec]. Therefore these two stars likely constitute a pair, and are the two brightest members of the clustering.
The first study of NGC 2129 was performed by Cuffey (1938), who obtained photographic photometry of 111 stars and concluded that this group of stars is a cluster with a diameter of about 5 arcmin located 570 pc from the Sun. He suggested that the two bright stars are members of the system due to the concentration of faint stars about them (see Fig. 1). Hoag et al. (1961) and Johnson et al. (1961) obtained and analyzed photoelectric/photographic UBV photometry of 45 stars down to V 16, concluding that the cluster is characterized by variable extinction across its area with a mean reddening E(B-V)=0.67 and a distance of 2.1 kpc.
Additional BV photographic photometry was secured by Voroshilov (1969) with the same limiting magnitude, and UBV photoelectric photometry by Lindgren & Bern (1980, Table V). Both these studies, however, did not providing information on the cluster parameters. More recently, Peña & Peniche (1994) performed a Stromgren ubvy- study of 37 stars in the region of NGC 2129 and, based upon star counts, they concluded that there is no star clustering in the direction of NGC 2129. Hence, NGC 2129 might simply be a chance alignment of a few bright stars and not a true star cluster.
To clarify this issue, we obtained deep CCD UBVRI photometry of a field centered on NGC 2129, and CCD BVRI photometry of a control field 15 arcmin away. The size of our fields (about 8 squared arcmin) allows us to cover the entire cluster region (see Fig. 1).
The paper is organized as follows. Section 2 describes the data acquisition and reduction procedure. In §3 we compare our photometry to previous studies. Section 4 presents a star count analysis which is used to determine the cluster size. In §5 we discuss NGC 2129 Colour Magnitude Diagrams (CMDs). An analysis of the cluster reddening and differential absorption is performed in §6. Section 7 provides estimates for the cluster age and distance. The basic results of this investigation are highlighted in §8.
2 Observations and Data Reduction
photometry of two fields in the region of NGC 2129 were taken at MDM observatory with the 1.3m McGraw-Hill telescope on the nights of February 18 and 19, 2004. The comparison field was observed only on the first night, while the cluster field was observed in a similar manner both nights. The pixel scale of the 1024 1024 Templeton CCD is 0.50′′, leading to a field of view of 8.5 arcmin in the sky. The nights were photometric with an average seeing of 1.4 arcsec. We took several short (4-12 secs), medium (40-120 secs) and long (400-1200 secs) exposures in all the filters to avoid saturation of the brightest stars. Nonetheless the two bright stars HD 250289 and HD 250290 were saturated in all exposures, and we used the photoelectric photometry from Hoag et al. (1961) for these two stars.
The data have been reduced with the IRAF111IRAF is distributed by NOAO, which are operated by AURA under cooperative agreement with the NSF. packages CCDRED, DAOPHOT, ALLSTAR and PHOTCAL using the point spread function (PSF) method (Stetson 1987). Calibration was secured by the observation of the Landolt (1992) standard fields PG 1047, PG 0231, SA 101, and Rubin 149 for a total of 50 standard stars each night. The two nights turned out to be photometrically very similar, and therefore we decided to use all of the standard stars in a a single photometric solution. The calibration equations have the following form:
and the final r.m.s. of the calibration was 0.020 mag for all the pass-bands except for U which had an r.m.s. of 0.045 mag. The standard stars have the colour coverage , , and .


Photometric errors have been estimated following Patat & Carraro (2001). Stars brighter than mag have global (internal from DAOPHOT plus calibration) photometric errors lower than 0.15 mag in magnitude and lower than 0.21 mag in colour. The final photometric data (coordinates, U, B, V, R and I magnitudes and errors) consist of about 2,500 stars in the cluster field.
The SkyCat tool and the Guide Star Catalogue v2 (GSC-2) at ESO was used to determine an astrometric solution for our photometry and obtain J2000.0 coordinates for all of the stars. There were approximately 200 stars for which we have both the celestial coordinates on the GSC-2 and the corresponding pixel coordinates from our photometry. Using the IRAF tasks CCXYMATCH, CCMAP and CCTRAN, we find the corresponding transformations between the two coordinate systems and compute the individual celestial coordinates for all the detected stars. The transformations have an r.m.s. value of , in agreement with other studies (Momany et al. 2001, Carraro et al. 2005).
Important information on the kinematics of the luminous stars in and around our target can be derived from the proper motions available in the UCAC2 catalogue (Zacharias et al. 2003). We retrieved from the catalogue 140 stars located in the same area of our CCD photometry. The result is shown in the vector point diagram of Fig. 2. There is clearly a condensation of stars centered at and , which indicates the presence of a cluster. Recently Beshenov & Loktin (2003) report for 10 stars in NGC 2129 the value and from Tycho 2. A new estimate of the cluster mean proper motion, based upon a new, larger sample of confirmed cluster stars will be presented in §8.
3 Comparison with previous studies
Our CCD investigation is a considerable improvement over previous studies in the region of NGC 2129. In Fig. 3 we compare the CMDs from various authors with ours in the V vs (B-V) plane . As noted before the two bright stars HD 250289 and HD 250290 are missed in our CCD photometry since they were saturated. The photometry by Hoag et al. (1961) (panel a,b) is clearly of much better quality than the Voroshilov (1969) photometry (panel c). The main sequence (MS) is narrow in the Hoag et al. (1961) photometry and nicely compares with the present study (panel d). For this reason we took the photometry of two bright stars from this work. The CMD in panel c) does not present any distinctive feature, and from this alone one might conclude we are viewing simply a Galactic disk field. We note that the photometry from Cuffey (1938) is the deepest one before the present study, although the quality of the photographic magnitudes and colours (which are not in the standard Johnson photometric system) is poor (see Cuffey 1938, Fig. 9).
We performed a comparison on a star by star basis with Hoag et al. (1961) photoelectric photometry and found from 16 stars in common:
where the suffix H stands for Hoag et al. (1961), and CC for the present paper. A comparison to the Hoag et al. (1961) photographic photometry (61 common stars) yields
These comparisons are shown in Fig. 4 and 5. The photoelectric photometry agrees well with our photometry to V = 12.5, but fainter than this magnitude some scatter starts to be present (Fig. 4). There appears to be systematic offsets between the datasets in Fig. 5, although the sizes of the differences are reasonable in a comparison between CCD and photographic photometry. Finally, we notice that there appears to be a colour term effect in the U band, which runs in opposite direction in the photoelectric (Fig 4) and photographic (Fig. 5) photometry.


4 Star counts and cluster size
The cluster radius is one of the most important cluster parameters, useful, together with cluster mass, for a determination of cluster dynamical parameters. The aim of this section is to obtain the surface density distribution of NGC 2129, and derive the cluster size by means of star counts. Star counts allow us to determine statistical properties of clusters with respect to the surrounding stellar background.


In Fig. 1, NGC 2129 appears as a concentration of bright stars in a region of about 4 arcmin diameter. To derive the radial stellar surface density we determine the highest peak in the stellar density to find the cluster center. The two bright stars HD 250289 and HD 250290 have been included in this, and the following star count calculations. The adopted center is placed at ; , similar to that given by Dias et al. (2002).
The radial density profile is constructed by performing star counts inside increasing concentric annuli wide, around the cluster center and then dividing by their respective surface areas. This is done as a function of apparent magnitude, and compared with the mean density of the surrounding Galactic field in the same brightness interval. The contribution of the field has been estimated through star counts in the region outside 6 arcmin from the cluster center. Poisson standard deviations have been computed and normalized to the area of each ring as a function of the magnitude, both for the cluster and for the field. The result is shown in Fig. 6, where one readily sees that NGC 2129 emerges significantly from the mean field for magnitudes brighter than V18. At fainter magnitudes the cluster starts to mix with the Galactic disk population. Based on the radial density profiles in Fig. 6, we find that stars brighter than V=20 provide a cluster radius of approximately 2 arcmin. We adopt as a final estimate of the radius arcmin. This value of the cluster radius is adopted throughout this work and is in basic agreement with the estimate of 2.5 arcmin reported by Cuffey (1938), which was simply based on visual inspection. We stress however that this radius is not the limiting radius of the cluster, but the distance form the cluster center at which the cluster population starts to be confused with the field population. At odds with Peña & Peniche (1994), we find that NGC 2129 appears as a clear star cluster standing above the mean Galactic field.
5 Analysis of the CMDs
Further confirmation of the cluster nature of NGC 2129 can be found in the comparison of the CMD for the cluster and the control field region depicted in Fig. 7. In this figure we show the V vs (V-I) and V vs (V-R) CMDs of NGC 2129 star within 2.5 arcmin from the cluster center, and the same CMDs for stars in a similar area region taken from the control field. We considered only the stars brighter than V = 21 and with . It is readily seen that the cluster actually exists, and it exhibits a nice MS extending from V = 10 down to V = 21. On the other hand, the field MS sharply stops at V 17.5, and contains only an handful of brighter stars. The cluster MS presents some scatter, larger than expected from the sole photometric errors (see §2), and which we ascribe mostly to differential reddening across the cluster area (see next Section). This is not unexpected, due to the cluster position, low in the Galactic thin disk.
6 Individual reddenings, membership and differential reddening
We use photometry to derive stars’ individual reddenings and membership. Briefly, individual reddening values have been computed by means of the usual reddening free parameter :
and the distribution of the stars in the two colour diagram. We follow the procedure described in Carraro (2002), Ortolani et al. (2002) and Baume et al. (2005), where the young open clusters Trumpler 15, NGC 1220 and Markarian 50 were studied. This method is a powerful one to isolate early spectral type (from to ) stars having common reddening, which are most probably cluster members (see also, for a reference, the study of Trumpler 14 by Vazquez et al. (1996). Note that the reddening based membership selection gives similar results to proper motion based membership selection (see Cudworth et al. (1993) and Patat & Carraro (2001) for some applications to star clusters in the Carina region).
Our results are shown in Fig 8, where we plot all the stars brighter than V = 19 having photometry in the two-colour Diagram. In this plot the solid line is an empirical ZAMS taken from Schmidt-Kaler (1982). The bulk of the stars are confined within a region defined by two ZAMS shifted by = 0.60 and 0.90 (dashed lines), respectively. The 37 stars (filled symbols) which occupy this region have a mean reddening . Since the spread in reddening is larger than the photometric errors, which are typically , this indicates the presence of differential reddening across the cluster, as suggested also by Cuffey (1938). This technique has been applied to all the stars but for HD 250289 and HD 250290, which are stars with spectral type B2IIIe and B3I (Morgan et al. (1955) and Hoag & Applequist (1965)) and are probably evolved stars. For these two stars absolute magnitudes and colours have been derived from Wegner (1994), assuming their spectral types and luminosity classes.
For some stars, an unambiguous reddening solution is not possible, and these stars are plotted with open symbols. A reddening solution is not possible since these stars are located in a region where larger reddening ZAMS cross the E =0.90 mag ZAMS, making it impossible to effectively disentangle members from non members.


In summary, there are 37 photometric members, for which we can derive estimates of the distance and age of the cluster. The member stars are listed in Table 1, together with coordinates, magnitudes, colours and proper motion component from UCAC2. We derived the photometric spectral type from the parameter (columns 10 and 11 in Table 1). These spectral types compare very well with what we can found in the literature. In fact, Hoag & Applequist (1965) report for stars 3, 4 and 7 spectral type of B3 III, B6 and B5, very close to our determinations. In addition, McCuskey (1967) found that the 7 brightest stars in the field of NGC 2129 are of OB spectral type and Chargeishvili (1988) reports for a few bright stars spectral classification from an objective prism analysis, suggesting that they are of B spectral type.
In Fig. 9 we plot all the stars having UBV photometry in the (V-I) vs (B-V) diagram. In this plot the solid line is the normal reddening vector from Dean et al. (1978), whereas the dotted and dashed lines are the intrinsic positions for stars of luminosity classes V and II, respectively, taken form Cousins 1978a,b . Given that the stars follow the standard reddening vector, the ratio of total to selective absorption [] is basically normal.
| ID | Hoag et al.(1961) | RA | DEC | V | E | Sp.Type | |||||||
|---|---|---|---|---|---|---|---|---|---|---|---|---|---|
| 4 | 3 | 6:01:05.25 | +23:21:24.85 | 10.115 | 0.442 | -0.516 | 0.245 | 0.528 | 0.707 | -0.695 | B2 | 0.00.9 | -2.30.7 |
| 5 | 4 | 6:01:17.50 | +23:19:30.80 | 11.391 | 0.547 | -0.351 | 0.283 | 0.721 | 0.812 | -0.660 | B3 | -0.81.0 | -1.70.9 |
| 6 | 7 | 6:00:59.64 | +23:17:57.11 | 11.431 | 0.490 | -0.463 | 0.198 | 0.603 | 0.779 | -0.629 | B3 | 0.21.0 | -7.60.6 |
| 7 | 6:01:04.81 | +23:17:20.00 | 11.400 | 0.535 | -0.429 | 0.200 | 0.649 | 0.824 | -0.639 | B3 | 0.86.5 | -0.66.3 | |
| 9 | 6:00:52.14 | +23:16:05.46 | 11.794 | 0.523 | 0.042 | 0.090 | 0.493 | 0.649 | -0.347 | B7 | 4.46.5 | 22.26.8 | |
| 10 | 6:01:03.04 | +23:18:02.17 | 12.043 | 0.551 | -0.362 | 0.291 | 0.710 | 0.821 | -0.674 | B3 | -1.73.7 | -2.11.4 | |
| 12 | 6:01:14.43 | +23:18:08.68 | 12.277 | 0.534 | -0.227 | 0.299 | 0.703 | 0.755 | -0.627 | B3 | 3.96.4 | -2.97.2 | |
| 13 | 6:01:03.46 | +23:20:09.15 | 12.286 | 0.603 | -0.198 | 0.345 | 0.801 | 0.832 | -0.652 | B3 | 0.61.0 | -1.00.8 | |
| 14 | 8 | 6:00:58.45 | +23:19:32.38 | 12.224 | 0.504 | -0.329 | 0.253 | 0.631 | 0.751 | -0.705 | B2 | -0.71.4 | 1.20.8 |
| 15 | 6:01:04.94 | +23:21:43.33 | 12.426 | 0.563 | -0.149 | 0.306 | 0.747 | 0.765 | -0.571 | B4 | -2.52.6 | -2.41.3 | |
| 16 | 10 | 6:01:10.84 | +23:21:31.74 | 12.586 | 0.488 | -0.376 | 0.233 | 0.553 | 0.747 | -0.640 | B3 | 1.10.6 | -2.50.6 |
| 17 | 11 | 6:01:10.88 | +23:15:28.03 | 12.614 | 0.591 | -0.210 | 0.254 | 0.695 | 0.820 | -0.653 | B2 | 0.86.3 | -9.56.3 |
| 18 | 6:01:17.80 | +23:18:07.07 | 12.552 | 0.578 | -0.267 | 0.278 | 0.690 | 0.824 | -0.701 | B2 | 2.76.3 | 1.36.3 | |
| 19 | 6:01:11.77 | +23:23:42.82 | 12.884 | 0.509 | 0.082 | 0.262 | 0.659 | 0.619 | -0.298 | B8 | -1.31.9 | -1.01.9 | |
| 20 | 6:01:10.63 | +23:20:05.94 | 12.941 | 0.634 | -0.075 | 0.339 | 0.866 | 0.829 | -0.552 | B4 | -0.61.8 | -2.91.8 | |
| 21 | 6:01:16.75 | +23:19:20.91 | 12.810 | 0.601 | -0.010 | 0.253 | 0.673 | 0.766 | -0.462 | B5 | -0.61.8 | -5.51.3 | |
| 24 | 6:01:01.59 | +23:19:29.59 | 13.515 | 0.632 | -0.199 | 0.308 | 0.740 | 0.868 | -0.675 | B2 | -10.16.3 | 5.26.3 | |
| 25 | 6:01:18.46 | +23:22:04.92 | 13.242 | 0.732 | 0.182 | 0.344 | 0.777 | 0.867 | -0.372 | B7 | -1.71.9 | -1.61.9 | |
| 26 | 6:01:08.42 | +23:17:53.81 | 13.461 | 0.628 | -0.121 | 0.296 | 0.737 | 0.838 | -0.594 | B3 | 0.22.0 | -4.62.0 | |
| 28 | 6:01:09.50 | +23:23:39.74 | 13.876 | 0.633 | -0.102 | 0.345 | 0.890 | 0.837 | -0.578 | B4 | -1.31.9 | -1.01.9 | |
| 30 | 6:01:08.02 | +23:18:19.20 | 13.529 | 0.627 | -0.059 | 0.289 | 0.748 | 0.816 | -0.532 | B4 | 0.22.0 | -4.62.0 | |
| 31 | 6:00:53.55 | +23:19:58.22 | 13.787 | 0.648 | -0.032 | 0.327 | 0.787 | 0.833 | -0.521 | B4 | 0.60.6 | -1.30.6 | |
| 34 | 6:01:05.91 | +23:20:13.47 | 14.068 | 0.672 | 0.341 | 0.196 | 0.762 | 0.738 | -0.166 | B9 | -1.11.9 | -5.91.9 | |
| 35 | 6:01:14.49 | +23:20:03.71 | 14.234 | 0.718 | 0.056 | 0.334 | 0.894 | 0.892 | -0.487 | B5 | -12.66.4 | -15.56.4 | |
| 38 | 6:01:08.12 | +23:18:13.08 | 14.290 | 0.672 | 0.321 | 0.250 | 0.750 | 0.744 | -0.185 | B9 | 2.76.3 | 1.36.3 | |
| 42 | 6:01:11.95 | +23:21:31.40 | 14.449 | 0.638 | 0.178 | 0.323 | 0.706 | 0.749 | -0.302 | B8 | 1.10.6 | -2.50.6 | |
| 49 | 17 | 6:00:48.13 | +23:19:11.53 | 14.760 | 0.686 | 0.194 | 0.282 | 0.741 | 0.804 | -0.323 | B8 | -1.16.3 | -10.26.4 |
| 50 | 6:01:07.28 | +23:18:13.54 | 14.886 | 0.707 | 0.238 | 0.324 | 0.865 | 0.816 | -0.296 | B8 | 2.76.3 | 1.36.3 | |
| 55 | 6:01:07.89 | +23:19:39.38 | 14.919 | 0.607 | 0.253 | 0.294 | 0.632 | 0.685 | -0.203 | B9 | -4.46.5 | -21.56.3 | |
| 56 | 6:01:06.40 | +23:22:34.49 | 14.727 | 0.640 | 0.170 | 0.287 | 0.726 | 0.754 | -0.312 | B8 | 7.26.3 | -5.46.3 | |
| 57 | 6:00:57.93 | +23:24:09.39 | 14.987 | 0.728 | 0.276 | 0.329 | 0.847 | 0.830 | -0.275 | B8 | 1.76.4 | -12.46.4 | |
| 62 | 6:00:53.78 | +23:18:00.92 | 15.179 | 0.734 | 0.336 | 0.315 | 0.819 | 0.818 | -0.219 | B9 | -1.73.7 | -2.11.4 | |
| 68 | 22 | 6:00:54.18 | +23:19:58.06 | 15.336 | 0.790 | 0.399 | 0.366 | 0.933 | 0.867 | -0.201 | B9 | 0.60.6 | -1.30.6 |
| 72 | 24 | 6:01:05.90 | +23:20:30.71 | 15.518 | 0.770 | 0.381 | 0.345 | 0.857 | 0.848 | -0.203 | B9 | -1.11.9 | -5.91.9 |
| 81 | 6:01:00.26 | +23:18:50.96 | 15.643 | 0.801 | 0.434 | 0.360 | 0.954 | 0.870 | -0.175 | A0.5 | -0.26.4 | -4.26.3 | |
| 84 | 6:01:12.76 | +23:18:30.40 | 15.619 | 0.816 | 0.437 | 0.354 | 0.934 | 0.887 | -0.184 | A0.5 | 3.96.4 | -2.97.2 |

7 age and distance
The reddening corrected CMDs for the likely member stars from Table 1 are plotted in Fig. 1.. We have superposed the empirical Schmidt-Kaler (1982) ZAMS (solid line), shifted by mag, which provides a nice fit to the observed distribution of stars. A 0.70 mag brighter ZAMS (dashed line) is shown to mimic the location of unresolved binary stars. The two brightest stars HD 250289 and HD 250290 are plotted as solid squares. The open circle is a star () that was found to be a photometric member, but whose proper motion components differ significantly from the mean. Therefore we consider it as a foreground star. Its position in the CMDs supports this conclusion.
The absolute distance modulus implies that NGC 2129 is located pc from the Sun. The relatively large uncertainty is due to the difficulty of fitting the almost vertical structure of the MS. The Galactocentric coordinates are pc, pc, pc and the Galactocentric distance is kpc. The cluster lies in the extension of the Local spiral arm towards the Galactic Third Quadrant. The distance modulus we find is in nice agreement with Johnson et al. (1961), who found and a distance of 2100 pc.
The two brightest stars HD 250289 and HD 250290 are of spectral type B2III and B3I and are likely evolved stars. On the other hand, the star at appears to be on the main sequence with an absolute magnitude of , and an estimated spectral type of approximately B2-B3. The two colour diagram (Fig. 8) enables one to estimate the spectral classification of stars with spectral types ranging from B2 to A5 (see Table 1). If the stars having spectral type are still along the MS, we infer that the age of NGC 2129 is around 10 Myrs.
8 Conclusions
In this paper we have presented the first CCD multicolour photometry for the stars in the field of NGC 2129, and provide the first estimate of its fundamental parameters. Our findings can be summarized as follows:
-
•
NGC 2129 is a compact group of stars with a radius of 2.0-2.5 arcmin, or 1.0-1.3 pc at the distance of the cluster;
-
•
we identified 37 likely members with spectral type earlier than on the basis of reddening, proper motion and the position in the reddening corrected CMDs;
-
•
the cluster is situated about 2200 pc away from the Sun in the anticenter direction, inside the Local spiral arm;
-
•
the mean reddening is , and there is substantial differential reddening;
-
•
the probable age of NGC 2129 is approximately 10 Myrs;
-
•
the mean proper motion components of the 37 cluster members are and .
Acknowledgements
GC is profoundly indebted to Brian Skiff for providing numberless very useful comments and suggestions. The work of GC is supported by Fundación Andes. Research supported in part by a NSF CAREER grant 0094231 to BC. BC is a Cottrell Scholar of the Research Corporation.
References
- [] Baume G., Vazquez R.A., Carraro G. 2005, MNRAS, 355, 475
- [] Beshenov G.V. & Loktin A.V. 2004, A&AT, 23, 103
- [] Carraro G. 2002, MNRAS, 331, 785
- [] Carraro G. , Baume G., Piotto G., Mendez R.A., Schmidtobreick L. 2005, A&A 436, 527
- [] Chargeishvili K. B., 1988, Abastumanskaia Astrof. Obs. Bul., 65, 3
- [] Cousins A.W.J. 1978a, Mon Notes Astron. Soc. S. Afr., 37, 62
- [] Cousins A.W.J. 1978b, Mon Notes Astron. Soc. S. Afr., 37, 77
- [] Cudworth, K.M., Martin, S.C., DeGioia-Eastwood, K. 1993, AJ, 105, 1822
- [] Cuffey J. 1938, Ann. Harv. Coll. Obs., 106, 39
- [] Dean, J.F., Warren, P.R. & Cousins, A.W.J., 1978, MNRAS, 183, 569
- [] Dias, W.S., Alessi, B.S., Moitinho, A., Lepine, J.R.D., 2002, A&A, 389, 871
- [] Hoag A.A., Iriarte B., Mitchell R.I., Hallam K.L., Sharpless S., 1961, Publ. US Nav. Obs., 17, 347
- [] Johnson H.L., Hoag A.A., Johnson H.L., Iriarte B., Mitchell R.I., Hallam K.L. 1961, Lowell Obs. Bull., 113, 8, p. 133
- [] Hoag A.A. & Applequist L. 1965, ApJS, 12, 215
- [] Høg, E., Fabricius, C., Makarov, V.V., et al., 2000, A&A, 355, L27
- [] Landolt, A.U., 1992, AJ, 104, 340
- [] Lindgren H., Bern K., 1980, A&AS, 42, 335
- [] Liu T., Janes K.A., Bania T.M. 1989, AJ, 98, 626
- [] Momany Y., Vandame B., Zaggia S. et al., 2001, A&A, 379, 452
- [] Ortolani S., Carraro G., Covino S., Bica E., Barbuy B. 2002, A&A, 391,179
- [] McCuskey S.W. 1967, AJ, 72, 1199
- [] Morgan W.W., Code A.D., Whitford A.E. 1955, ApJS, 2, 41
- [] Patat, F. & Carraro, G. 2001, MNRAS, 325, 1591
- [] Peña J.H., Peniche R. 1994, Rev. Mex. Astron. Astrop., 28, 139
- [] Schmidt-Kaler, Th. 1982, Landolt-Börnstein, Numerical data and Funct ional Relationships in Science and Technology, New Series, Group VI, Vol. 2(b), K. Schaifers and H.H. Voigt Eds., Springer Verlag, Berlin, p.14
- [] Stetson, P. B., 1987, PASP, 99, 191
- [] Trumpler R. 1930, Lowell Observatory Bulletin, 14, 171
- [] Vazquez R.A., Baume G., Feinstein A., Prado P., 1996, A&AS, 116, 75
- [] Voroshilov V.I. 1969, Publication of Kiev University
- [] Wegner W. 1994, MNRAS 270, 229
- [] Zacharias, N., Urban, S.E., Zacharias, M.I., et al. 2004, AJ, 127, 3043