Mass Profiles and Shapes of Cosmological Structures
Mass-to-light ratios of ellipticals in CDM
Abstract
We use the mass-to-light gradients in early-type galaxies to infer the global dark matter fraction, MM∗, for these systems. We discuss implications about the total star formation efficiency in dark-matter halos and show that the trend of with mass produces virial mass-to-light ratios which are consistent with semi-analitical models. Preliminary kurtosis analysis of the quasi-constant M/L galaxies in Romanowsky et al. seems at odd with Dekel et al. simulations.
1 Introduction
Recent finding of a sample of galaxies with a poor dark matter content within several effective radii (Romanowsky et al. 2003, R03 hereafter) seems to challenge the current paradigm of galaxy formation in CDM cosmology where galaxies are seen to evolve in extended halos of dark matter with cuspy density profile (Navarro et al. 1997). Systems with a significant dark-matter component are expected to have mass-to-light ratios (M/L or hereafter) deviating from the values typical of their stellar population. On the contrary R03 have shown that the kinematics of three intermediate luminosity galaxies can be modeled with a quasi–constant M/L consistent with the one expected from stellar population synthesis models.
This unexpected result have produced different interpretation either in the CDM framework (Dekel et al. 2005 D05) or in MOND theory (Milgrom & Sanders 2003). In particular, D05 address very radial stellar orbits and projection effects in order to explain declining velocity dispersion profiles.
On the other hand, [Napolitano et al. (2005)] (N05 hereafter) made predictions of gradients of mass-to-light ratios ( hereafter) in early-type galaxies and have ascertained that “quasi-constant M/L” are indeed expected within CDM, albeit the R03 sample shows which are too low and conflicting with acceptable star formation efficiency and baryon fraction.
Low M/L gradients systems are a part of a generalised trend of with stellar mass/luminosity
(see Section 3).
Here we show some preliminary results on the PNe’s anisotropy of the R03 sample and compare them with the models from D05 and finally discuss whether the trend of the star formation efficiency is consistent with virial M/Ls.
2 Kurtosis profiles of PNe and anisotropy
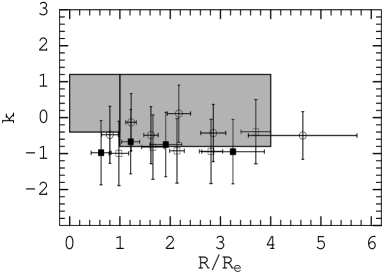
Simulations from D05 of galaxy merging of equal mass progenitors have shown that radial anisotropy naturally raises in the outskirts of merging remnants, where positive parameters should be measured. By converting to kurtosis using the approximated formula as in [van der Marel & Franx (1993)], it is possible to compare PN kurtosis to this predictions. In Fig. 1 we show the radial kurtosis profiles of galaxies NGC821, NGC3379 and NGC4494, obtained with the latest PN.S data reduction run compared with the quoted average values from Dekel et al. (represented as shaded boxes). It looks like the observed values, albeit consistent within the errorbars, are systematically lower than the prediction from D05, which is already an indication of non strong radial anisotropy di per se.
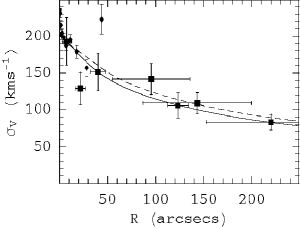
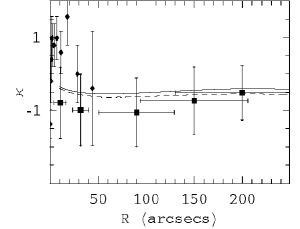
A direct estimate of orbital anisotropy needs data modeling: following [Lokas & Mamon (2003)] we have constrained the anisotropy parameter with Jeans analysis using 2nd and 4th velocity moments. Fig. 2 shows the best-fit to the velocity dispersion and kurtosis for the case without dark-matter: best-fit parameters are and . Radial anisotropy () is marginally allowed when forcing the models to a stellar mass-to-light ratio in order to accommodate a dark halo. For this case halo concentration is , i.e. much lower then expected from N-body simulations (Bullock et al. 2001).
3 Global dark-matter fraction and star formation efficiency
In Fig. 3 (left) we compare the model to the observed gradients of a sample of 21 early-type galaxies.
As discussed in N05, are considered as a two parameter family models (stellar, , and dark mass, or as adopted in Fig. 3). The dark-to-luminous fraction, , can be interpreted in terms of star formation efficiency, , i.e. the fraction of baryonic mass cooled in stars, assuming baryon conservation, such that (see N05 for further details).
In Fig. 3, the observed gradients do not seem to follow the simple increase of
with that is expected for a “universal” . This is made clearer in Fig. 3 (right) where the inferred () are plotted against the galaxy masses: massive (brightest) sample is broadly distributed within the physical meaningful range marked by the dashed lines, while less massive galaxies (included the R03 sample) have a very sharp distribution around a maximum () values which is unphysical. The mass scale marking this “dichotomy” is [].
The overall trend seems to confirm other independent evidences that the star formation efficiency is a function of the halo masses with a minimum around galaxies (Benson et al. 2000, Dekel & Bornboi 2004, see also Marinoni & Hudson 2002, van den Bosch et al. 2003).

The too high (too low ) we have found around is still far to be understood and it remains a challenge for the theory.
Driven by the results of [Benson et al. (2000)] and [Dekel & Bornboi (2004)], we can interpolate a smoothed function through the values plotted in Fig. 3 of the form where 111The dependence of the on the mass can be obtained by the transformation (see also N05).
. Forcing the fit to a more physical minimum (we take , i.e. ), the best fit (overplotted in Fig. 3, right panel) is found for and with for and for .
Is this result consistent with semi-analytical N-body simulations?
Models from [Benson et al. (2000)] make explicit prediction of the M/L at the virial radius.
We use the toy-model illustrated in N05 (in their Sect. 3) in order to compute the M/L at the virial radius produced by the function derived above.
Indeed, by the definition of M/L:
| (1) |
where and are referred to the virial radius, is a constant stellar mass-to-light ratio (from population synthesis models) and we have used the cosmic baryon fraction .
This shows that M/Ls at the virial radius depend on luminosity (and mass) through the quantities and .
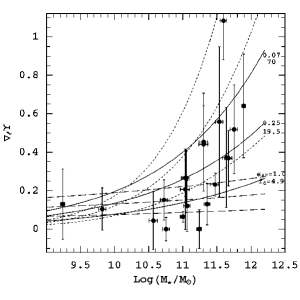
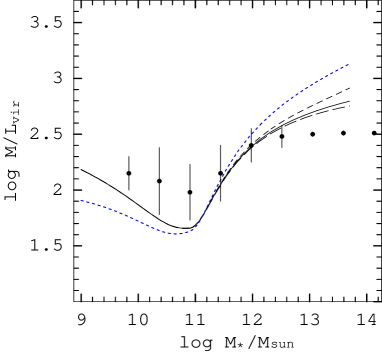
There are indications that has only a weak dependence on (Trujillo et al. 2004, we use their results in the following) which would leave as the main player of the virial dependence on the mass. Virial predicted according with Eq. 1 are compared with results from [Benson et al. (2000)] in Fig. 4, where we have rescaled their halo masses to stellar masses trough our . There is a substantial agreement with semi-analytical model prediction except in the low mass regime where our estimates are based on poor data. But the overall behavior is reproduced. We also see that if we assume a stronger dependence of the on the mass (), the trend of our predicted virial M/L is inconsistent with [Benson et al. (2000)].
4 Conclusions
The main conclusions are: 1) for the moderate luminosity sample of R03, strong radial anisotropy does not seem to be an issue; 2) we have shown that the global dark-matter fraction in ellipticals is a smoothed function of the stellar mass, consistently with the predictions of semi-analytical models; 3) the low-M/L gradients found by R03 and N05, for intermediate luminosity systems, imply too low dark-matter fraction challenging the standard , a problem that can be alleviated assuming low concentrated halos (R03, N05) or a lower (Napolitano 2004).
References
- [Benson et al. (2000)] Benson A.J., Cole S., Frenk C.S., Baugh C.M., Lacey C.G., 2000, MNRAS, 311, 793
- [Bullock et al.(2001)] Bullock J.S., et al., 2001, MNRAS, 321, 559
- [Dekel & Bornboi (2004)] Dekel, A., & Birnboim, Y., 2005 [preprint:astro-ph/0412300]
- [Dekel et al. (2005)] Dekel, A., et al., 2005 [preprint:astro-ph/0501622]
- [Lokas & Mamon (2003)] Lokas, E.L. & Mamon, G.A. 2001, MNRAS, 343, 401
- [Marinoni & Hudson (2002)] Marinoni, C. & Hudson, M.J., 2002, ApJ, 569, 101
- [Milgrom & Sanders (2003)] Milgrom, M., & Sanders, R.H., 2003, ApJL, 599, 25
- [Napolitano et al. (2005)] Napolitano N.R., et al., 2005, MNRAS, 357, 691 (N05)
- [Napolitano (2004)] Napolitano N.R., 2004. SISSA, Proceedings of Science, http://pos.sissa.it, p.67.1
- [Navarro et al. (1997)] Navarro J.F., Frenk C.S., White S.D., 1997, ApJ, 490, 493 (NFW)
- [Romanowsky et al. (2003)] Romanowsky A.J. et al., 2003, Science, 301, 1696 (R03)
- [Trujillo et al. 2004] Trujillo I., Burkert A., Bell E. F., 2004, ApJ, 600, L39
- [van den Bosch, Mo & Yang (2003)] van den Bosch F.C., Mo H.J., Yang X., 2003, MNRAS, 345, 923
- [van der Marel & Franx (1993)] van der Marel, R.P., & Franx, M. 1993, ApJ, 407, 525