An X-ray view of Mrk 705
Mrk 705 exhibits optical properties of both narrow- and broad-line Seyfert 1 galaxies. We examine the X-ray properties of this borderline object utilising proprietary and public data from Chandra, ASCA, ROSAT and RXTE, spanning more than twelve years. Though long-term flux variability from the pointed observations appears rather modest (), we do find examples of rare large amplitude outbursts in the RXTE monitoring data. There is very little evidence of long-term spectral variability as the low- and high-energy spectra appear constant with time. A emission line is detected in the ASCA spectra of Mrk 705, but not during the later, higher flux state Chandra observation. However, the upper limit on the equivalent width of a line in the Chandra spectrum is consistent with a constant-flux emission line and a brighter continuum, suggesting that the line is emitted from distant material such as the putative torus. Overall, the X-ray properties of Mrk 705 appear typical of BLS1 activity.
Key Words.:
galaxies: active – galaxies: individual: Mrk 705 – galaxies: nuclei – X-ray: galaxies1 Introduction
Narrow-line Seyfert 1 (NLS1) galaxies are defined on the bases of their optical properties, primarily that they possess narrow permitted lines, weak [O iii] and strong Fe ii (Osterbrock & Pogge 1985; Goodrich 1989). It was realised that these objects often exhibit extreme X-ray behaviour as well (e.g. Puchnarewicz et al. 1992; Boller et al. 1996), such as steep spectra and rapid, large amplitude variability.
However, the traditional definition has become blurred by the discovery of objects which are not NLS1, but exhibit characteristic X-ray behaviour; and objects which are NLS1, but do not behave as such (e.g. Reeves et al. 2002; Williams et al. 2002, 2004; Dewangan & Griffiths 2005). It has been suggested that NLS1 activity is an evolutionary phase that all active galaxies go through (e.g. Grupe 1996; Mathur 2000), and there is growing evidence in support of this conjecture. NLS1 and broad-line Seyfert 1s (BLS1) appear to follow different loci on the black hole mass – bulge velocity dispersion plane, implying that black holes in NLS1 are still growing (Mathur et al. 2001; Grupe & Mathur 2004; Mathur & Grupe 2005a, b). As such, it is important to examine objects which could be in a transition phase between NLS1 and BLS1.
In consideration of the optical spectrum, Mrk 705 is usually defined as an NLS1. By virtue of also being a relatively nearby () PG quasar (PG 0923+129), and X-ray bright in the ROSAT All-Sky Survey (RASS; Voges et al. 1999), it is often found in many sample studies of AGN behaviour, but until now it has not benefited from a dedicated examination.
Mrk 705 would perhaps be better classified as an intermediate-type NLS1. The optical properties appear to be on the border that distinguishes NLS1 from BLS1. For example, the of the H emission line is approximately (e.g. Boroson & Green 1992; Véron-Cetty et al. 2001; Botte et al. 2004), and the [O iii] emission is relatively strong (). Between the spectrum is somewhat steeper (see Section 4) than the canonical found in BLS1 (e.g. Porquet et al. 2004) On the other hand, the low-energy X-ray spectrum, as observed with ROSAT, is relatively flat and hard111 The hardness ratio () used in this paper will be defined as , where and are count rates in a hard and soft energy band, respectively. During the ROSAT era and were typically used. We will adopt this convention unless stated otherwise (as in Sect. 5.2). compared to NLS1 (e.g. Wang et al. 1996; Grupe 1996; this study), but typical for BLS1. Mrk 705 was the only NLS1 that exhibited a significant hard spectrum at the time Grupe (1996) selected the soft X-ray AGN sample.
In comparing the known properties of Mrk 705 with a sample of NLS1 and BLS1 (Grupe 2004) we find several discrepancies. Mrk 705 has a flat spectral index more typical of BLS1. Like NLS1, it does possess strong Fe ii emission (in terms of equivalent width), but with respect to H the relative Fe ii emission is actually weak (comparable to BLS1). Finally, as with the H emission line width, (Baskin & Laor 2004) lies in the region occupied by both NLS1 and BLS1.
We report the first dedicated Chandra X-ray observation of Mrk 705, obtained through the Guaranteed Time programme. In addition we make use of archival ROSAT, ASCA and RXTE data to examine the X-ray () properties of Mrk 705 in detail.
2 Observations and data reduction
X-ray spectroscopic observations of Mrk 705, which are either proprietary to us or publicly available, have been performed with ROSAT, Chandra and ASCA. The spectroscopic data utilised in this analysis are described in Table 1.
In addition, Mrk 705 is observed nearly daily with the RXTE All-Sky Monitor (ASM). Quick-look results provided by the ASM/RXTE team are briefly discussed in Sect. 5.
| (1) | (2) | (3) | (4) | (5) | (6) |
| Observatory | Inst. | Date | Energy | Exp. | Counts |
| year.mm.dd | (keV) | (s) | (cts) | ||
| ROSAT | PSPC | 1992.11.05 | 0.1–2.4 | 3855 | 5510 |
| ROSAT | PSPC | 1993.26.04 | 0.1–2.4 | 5245 | 5652 |
| ASCA | SIS0 | 1998.14.11 | 0.7–10 | 23904 | 13746 |
| SIS1 | 0.7–10 | 20844 | 9536 | ||
| GIS2 | 1–10 | 29068 | 7871 | ||
| GIS3 | 1–10 | 29068 | 9242 | ||
| Chandra | 0-order | 2004.18.03 | 0.5–7.5 | 20893 | 3545 |
| ASIS-S | MEG | 0.6–5 | 20991 | 5989 | |
| HEG | 0.8–7.5 | 20991 | 2559 | ||
2.1 Chandra observation
Mrk 705 was observed with Chandra on 2004 March 18 with the Advanced CCD Imaging Spectrometer (ACIS-S) for about . To minimise pile-up effects on the ACIS image, a grating was inserted in the photon path; the High-Energy Transmission Grating Spectrometer (HETGS) was used to disperse photons and so to reduce the count rate on the zeroth order image Unfortunately, pile-up was still problematic at about the level. Accordingly, a pile-up model (Davis 2001) was adopted in all spectral fits.
Data were processed with the Chandra Interactive Analysis of Observations software (CIAO 3.2), using the Chandra Calibration Database (CALDB 3.0.0). We applied the recently released, time–dependent gain correction222http://asc.harvard.edu/ciao/threads/acistimegain/, which is necessary to adjust the “effective gains”, which drift with time due to an increasing charge transfer inefficiency (CTI).
The data were filtered to include only the standard event grades 0, 2, 3, 4 and 6. We filtered time intervals with high background by performing a clipping of the background level using the script analyze_ltcrv333http://cxc.harvard.edu /ciao/threads/filter_ltcrv/. This yielded an effective exposure time of about 21 ks for the ACIS–S3 chip in the energy range keV.
The background was selected from an off–source circular region of radius . To extract the zeroth and higher order grating spectra we followed the standard procedures. We analyse the 0-order spectrum as well as the combined (negative and positive) 1st-order spectra from the Medium Energy Grating (MEG) and the High Energy Grating (HEG).
2.2 ASCA observation
ASCA observed Mrk 705 for a total of during which time all instruments were functioning normally. The processed data from all the ASCA instruments (SIS0, SIS1, GIS2, GIS3) were obtained from the TARTARUS website444http://astro.ic.ac.uk/Research/Tartarus/ (version 3.0), where all the information describing the processing procedures can be found. The total exposure utilised for this observation is between depending on the instrument (see Table 1).
2.3 ROSAT observations
Mrk 705 was observed with ROSAT on numerous occasions as part of the RASS or because it fell in the field-of-view of other pointings. Two dedicated observations of Mrk 705 with the Position Sensitive Proportional Counter (PSPC; Pfeffermann et al. 1987) on ROSAT were performed about one year apart with the AGN viewed on-axis. Details of the observations are found in Table 1.
The data were processed in the standard manner with EXSAS v03OCT (Zimmermann et al. 1994). Spectra were created from source plus background counts extracted from a circular region with a radius of 2 arcmin and centred on the source. Background counts were extracted from a larger off-source region and appropriately scaled to the source cell size. Spectral files were then converted into FITS format so that the data could be analysed in XSPEC.
3 X-ray coordinates
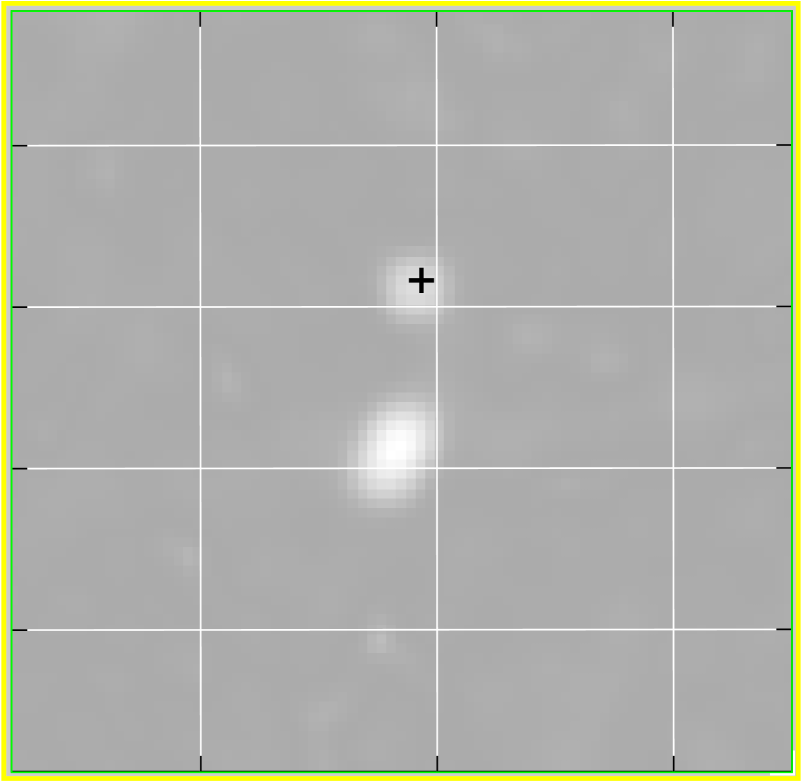
The high-resolution capabilities of Chandra allows us to determine the X-ray position of Mrk 705 with arcsecond precision. The X-rays originate from a point source with coordinates and , which agree well with the optical position of the AGN (Clements 1981). In comparing the Chandra image with the PSF expected from the observation, we found no extended X-ray emission within the spatial resolution of the instrument ( at the redshift of the source).
In Figure 1 the Chandra coordinates are over-plotted on the archival FIRST555http://sundog.stsci.edu/ (White et al. 1997) image obtained with the VLA. Although Mrk 705 is considered radio-quiet it is detected in the sensitive FIRST survey with an integrated flux density of about . The X-ray position is also in good agreement with the origin of the radio emission.
Of interest may be the elongated radio source located south of Mrk 705. In the low-resolution instruments (i.e. ROSAT and ASCA), where the source extraction region is typically arcminutes in size, this source could contribute to the X-ray flux of Mrk 705. Little is known about this object other than that it is associated with the infrared source 2MASX J09260351+1243341, with a K-band flux density of , and a FIRST (GHz) integrated flux density of .
At the redshift of Mrk 705, 2MASX J09260351+1243341 would be located from the AGN. We considered the possibility that this could be a radio jet associated with Mrk 705. However, the infrared emission, assuming a jet with a power-law spectrum () and typical spectral index in the range (e.g. Ferrari 1998; Worrall & Birkinshaw 2004), is at least times too high. More importantly, the object is not detected in the Chandra exposure, indicating that the X-ray fluxes measured with ASCA and ROSAT are dominated by Mrk 705.
4 Spectral analysis
The energy band in which the data from each instrument is analysed is given in Table 1. All of the spectra were grouped such that each bin contained at least 20 counts. Spectral fitting was performed with XSPEC v11.3.1 (Arnaud 1996) and fit parameters are reported in the rest frame of the object. The quoted errors on the model parameters correspond to a 90% confidence level for one interesting parameter (i.e. a criterion). K-corrected luminosities were derived assuming isotropic emission, a value for the Hubble constant of =, and a standard cosmology with = 0.3 and = 0.7. The value of the Galactic column density toward Mrk 705 was taken to be (Elvis et al. 1989).
4.1 The ROSAT spectra
The PSPC is sensitive in the range and this offers the opportunity to examine lower levels of absorption than possible with ASCA or Chandra. First attempts were made to fit the ROSAT spectra of Mrk 705 with a power-law modified by a neutral hydrogen column. Leaving the absorption component free to vary resulted in measurements consistent with the value given by Elvis et al. (1989). Fixing the photoelectric absorption to the Galactic value and including an additional component to estimate cold absorption intrinsic to the source did not enhance the fits or result in any meaningful detection of intrinsic absorption. As such, in subsequent fits (in particular with the ASCA and Chandra data) the photoelectric absorption component was simply fixed to the Galactic value.
A simple power-law was a reasonable fit to the 1993 (second) observation of Mrk 705 (see Figure 2 and Table LABEL:tab:rosfit). Including additional components to mimic a multi-component continuum did not improve the simple model. However, the 1992 (first) PSPC observation appeared more complicated. A simple power-law provided a mediocre fit (dof ) to the data. Multi-component models (e.g. broken power-law, and blackbody plus power-law) provided a substantial improvement over the single power-law (Table LABEL:tab:rosfit).
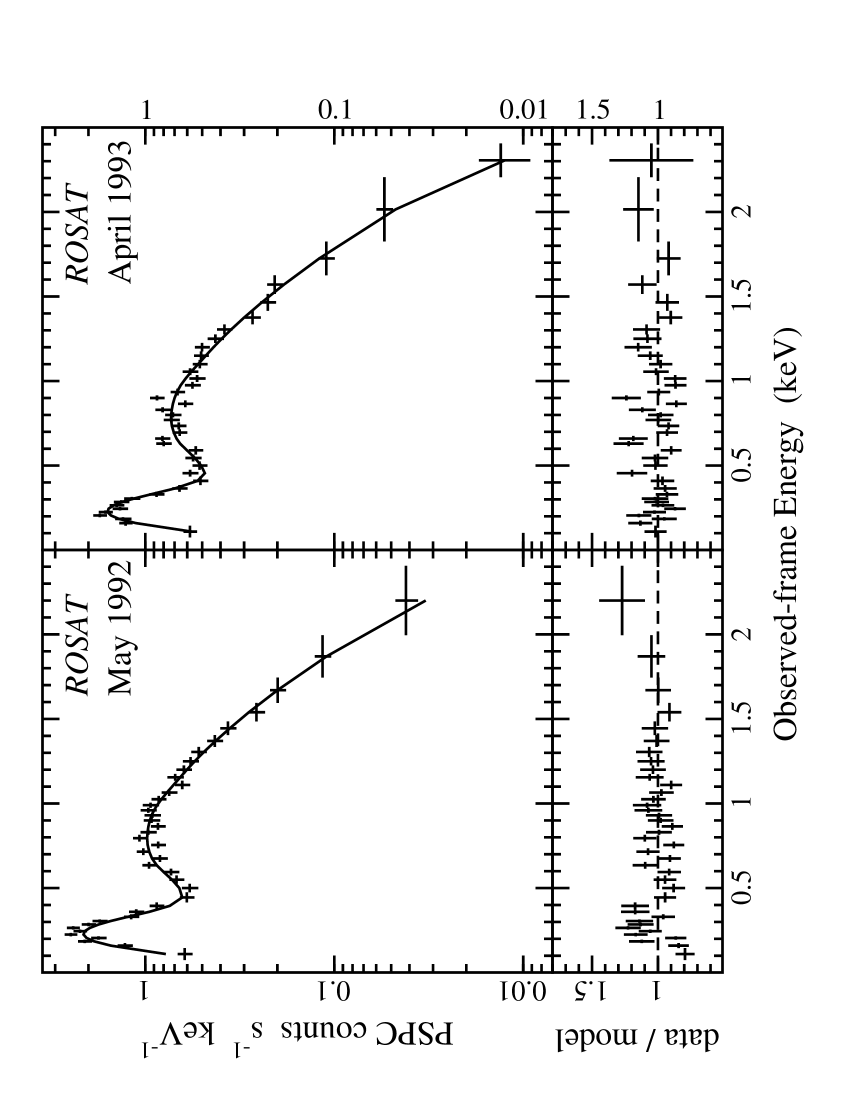
The most apparent difference between the two ROSAT observations is that the 1992 spectrum requires a second component in addition to a power-law. However, the hardness ratio at both epochs is comparable (, ), indicating that the spectral differences between the two observations may not be as significant as suggested by the modelling. Indeed, the primary differences in the two spectra are between , where the sensitivity of the instrument begins to diminish. Therefore, it is not conclusive whether apparent changes are due to intrinsic variability in the AGN or signal-to-noise.
Results from modelling the ROSAT PSPC data of Mrk 705 are tabulated in Table LABEL:tab:rosfit.
| (1) | (2) | (3) | (4) |
|---|---|---|---|
| Model | Parameters | Obs 1 | Obs 2 |
| (1992) | (1993) | ||
| power-law | /dof | ||
| broken | /dof | ||
| power-law | |||
| (keV) | |||
| blackbody | /dof | ||
| plus | (eV) | ||
| power-law |
4.2 The ASCA spectra
Modelling the data from the four ASCA instruments separately revealed relatively good agreement in the measured fit parameters (within 90 per cent confidence levels). As such, the data from all the instruments were fitted simultaneously while allowing for an energy-independent scale factor between the SIS and GIS spectra. The residuals from each instrument were examined separately to ensure agreement. Since there was no evidence of intrinsic cold absorption from the ROSAT observations, the photoelectric absorption parameter was fixed to the value of the Galactic column.
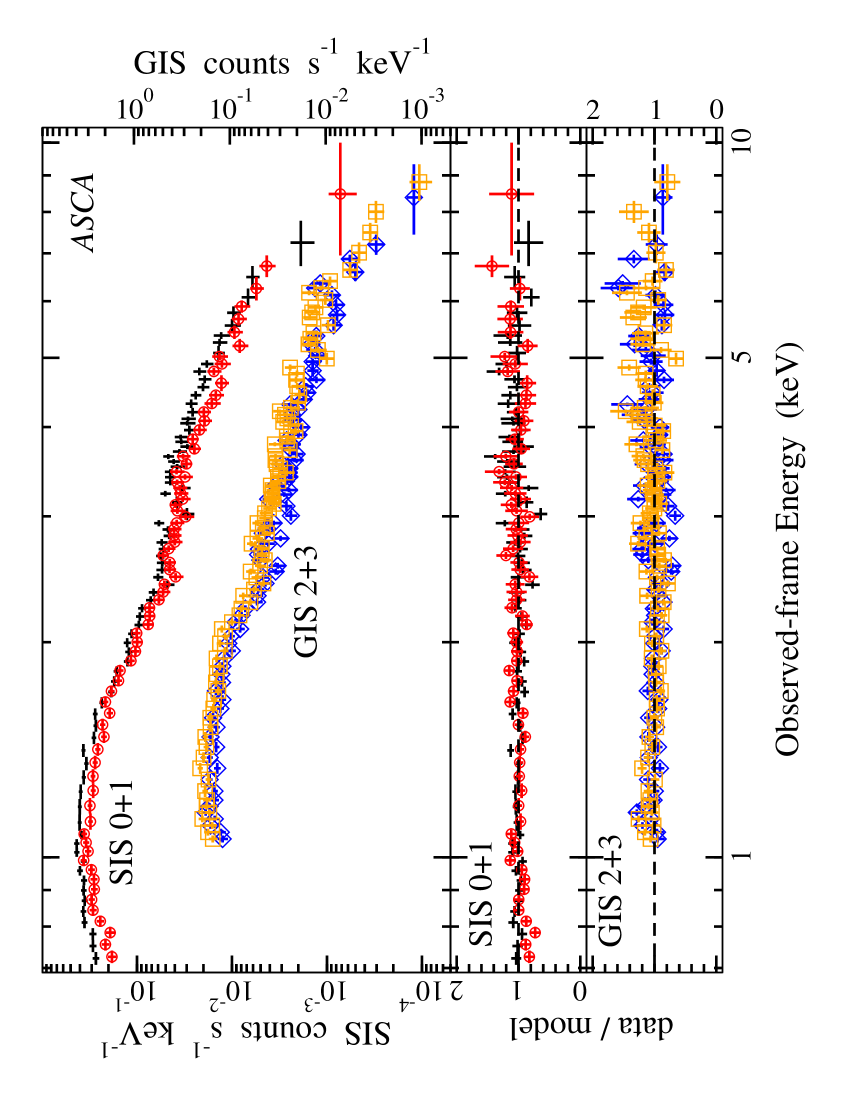
Fitting the spectra with a power-law () resulted in a reasonable fit (dof ); however positive residuals remained at in the observed-frame. Adding a Gaussian profile to the power-law model improved the fit considerably ( for 3 additional free parameters), suggesting emission from Fe K at a rest frame energy of . Extrapolating the fit to 0.7 keV in the SIS and 1 keV in the GIS showed some residuals at lower energies. These residuals did not require additional model components to minimise, but could be adequately improved by simply allowing for a slight change in the slope of the current power-law. The resulting unabsorbed flux was , and the corresponding intrinsic luminosity was . The best-fit model is displayed in Figure 3 and the parameters are given in Table 3.
| (1) | (2) | (3) | (4) | (5) | (6) |
|---|---|---|---|---|---|
| Instrument | /dof | ||||
| (keV) | (eV) | (eV) | |||
| SIS0+1 | 0.90/175 | ||||
| GIS2+3 | 1.18/209 | ||||
| SIS+GIS | 1.09/384 |
4.3 The Chandra spectra
In order to minimise the effects of pile-up in the zeroth order spectrum, the pile-up model of Davis (2001) was used in all spectral fits. The parameters of this model component are give in Table 4.
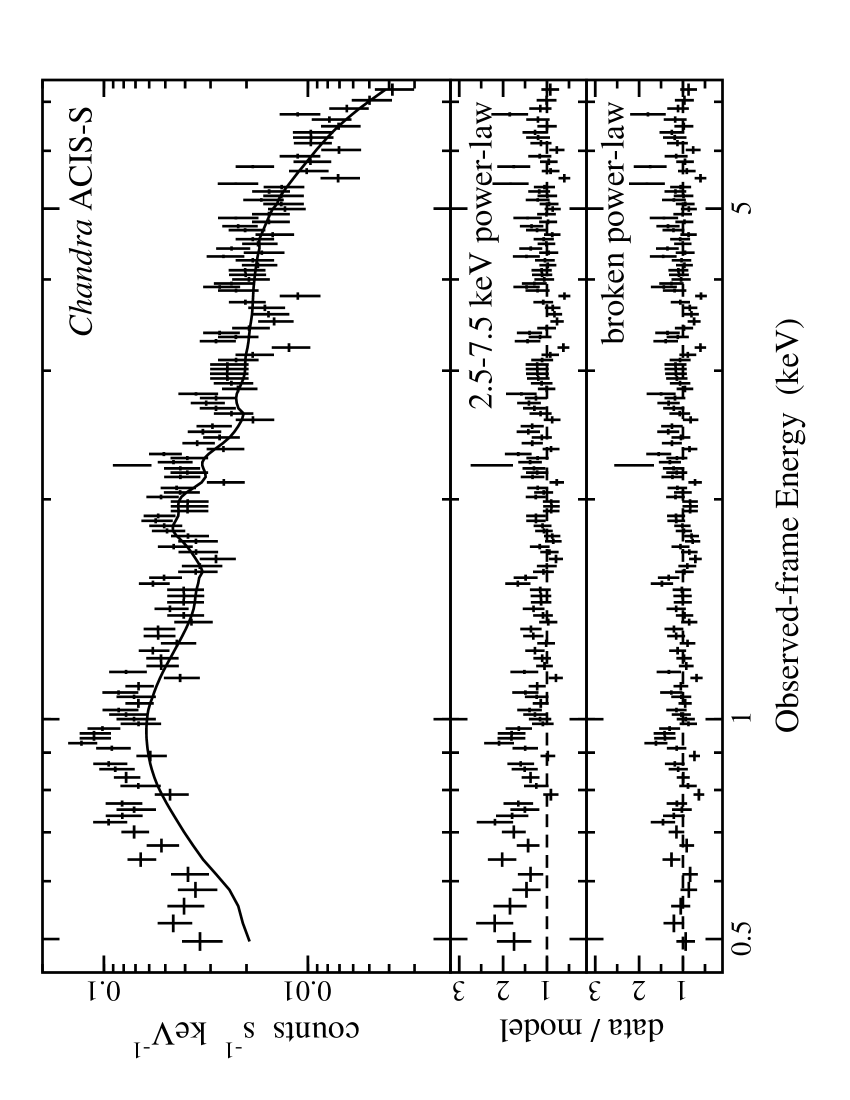
As with the ASCA analysis, we began by fitting the high-energy () Chandra (0-order) data with a power-law () modified by Galactic absorption. This resulted in a rather poor fit (dof ), and there were no indication of possible emission features (Figure 4).
Extrapolating the power-law down to , showed evidence of a slight excess below (Figure 4). Fitting the broadband continuum with just the single power-law (as was done to the ASCA data) did not result in an entirely satisfactory fit (see Table 4 for broadband fit results).
The addition of a second continuum component, in the form of a blackbody or a broken power-law, improved the power-law model equally well ( for 2 additional free parameters). The unabsorbed and fluxes obtained from the broken power-law fit were and , respectively. The rest frame luminosity was .
The addition of a Gaussian profile did not significantly improve the fit ( for 3 additional parameters). Fixing a narrow (), Gaussian profile to , as was found with ASCA, allowed estimation of a upper-limit on the equivalent width of .
The best-fit models to the Chandra data are described in Table 4. The available statistics in the HEG and MEG are quite low. Nevertheless, application of the zeroth order best-fit model to the grating spectra resulted in comparable fits.
| (1) | (2) | (3) | (4) |
|---|---|---|---|
| Continuum | /dof | Continuum | Pile up |
| Model | Parameters | Parameters | |
| power-law | 1.26/137 | ||
| broken | 1.22/135 | ||
| power-law | |||
| blackbody | 1.22/135 | ||
| plus | |||
| power-law |
5 Timing properties
5.1 Long-term timing behaviour
The four observations analysed here were spread over more than ten years; however the flux in the range, which is the only band sampled at every epoch, varied by less than a factor of three (see Figure 5). The variability appears modest in comparison to other Seyferts (e.g. Markowitz & Edelson 2004), but a fair comparison cannot be made given our poorly sampled long-term light curve.
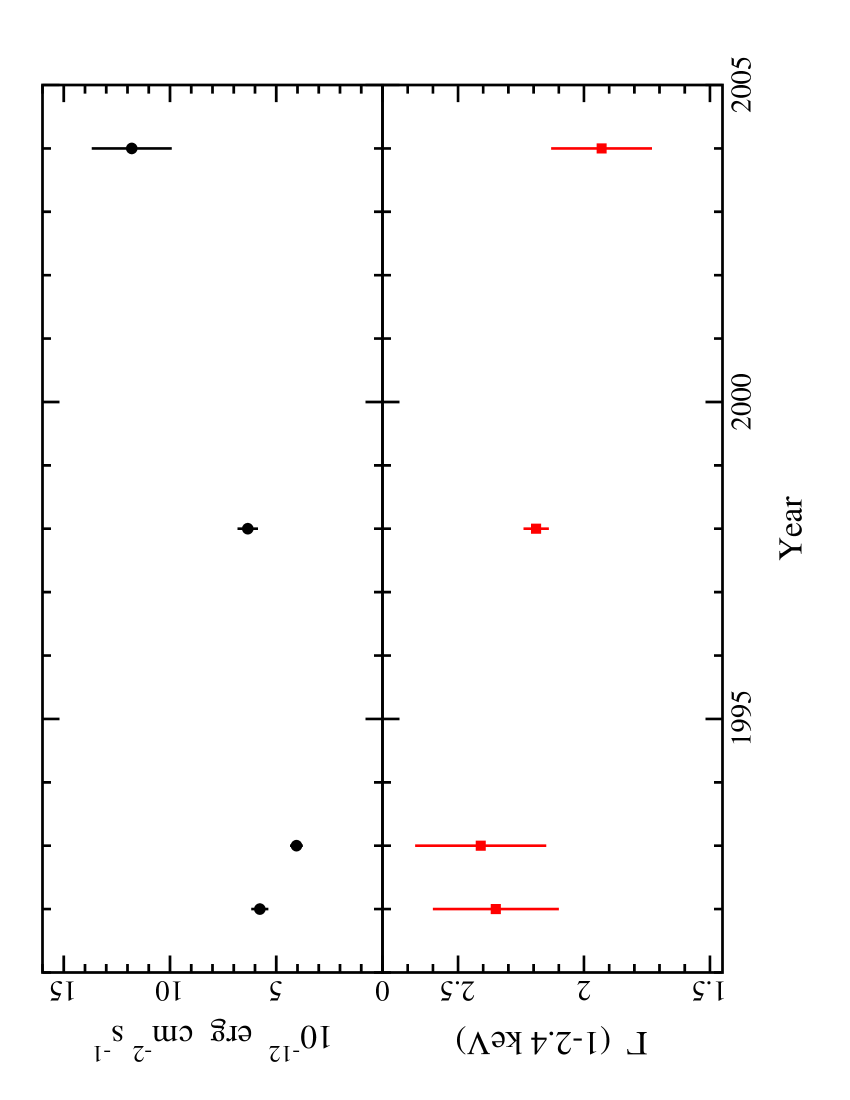
Moreover, there is no significant spectral variability over this period. Within uncertainties, the spectral slope between is constant (Figure 5). In addition, the spectral fits to the two ROSAT and Chandra data sets suggest that the low-energy () spectral form remains constant, and comparable to a power-law with a spectral index of .
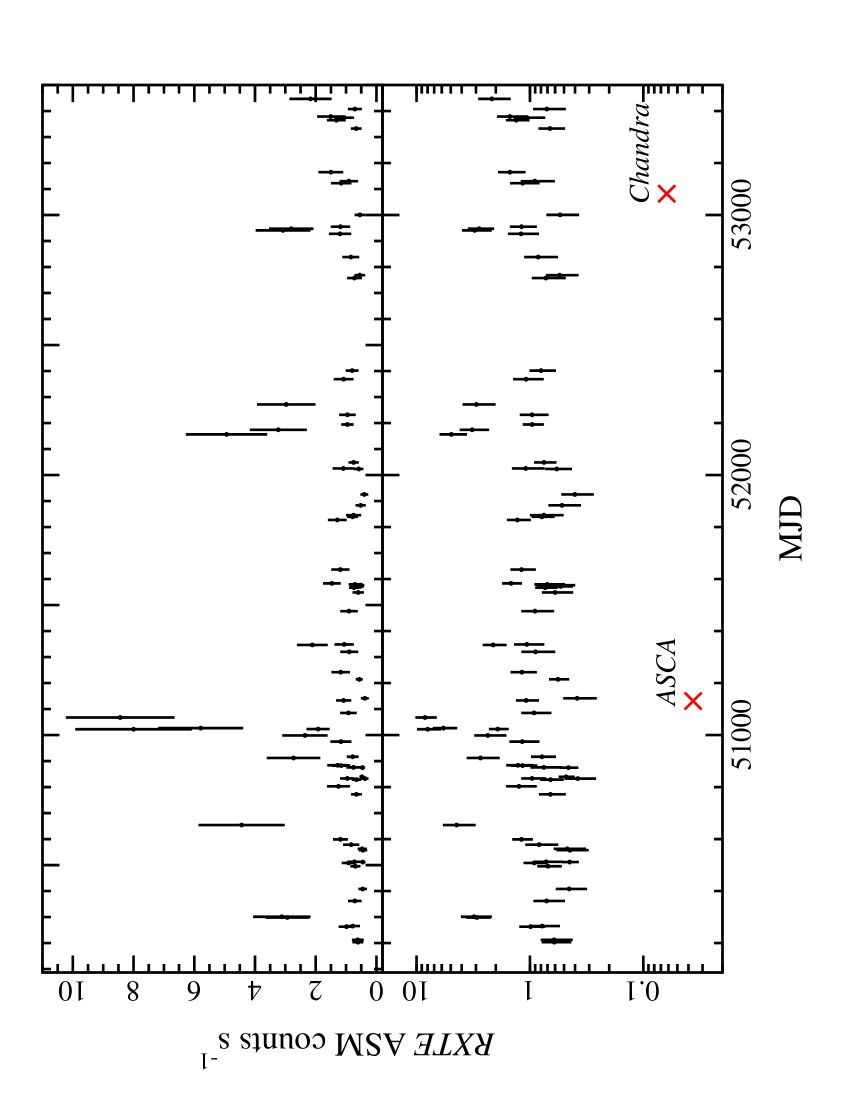
Mrk 705 has been observed nearly daily with the RXTE ASM since 1996 January. As of 2005 April 27 over 2600 observations were made. Mrk 705 has been detected above a level about 85 times. In Figure 6, the data points from the quick-look light curve provided by the ASM/RXTE team are plotted. Using the ASCA and Chandra best-fit models, we have estimated an ASM count rate with WebPIMMS666http://heasarc.gsfc.nasa.gov/Tools/w3pimms.html, and over-plotted these estimates on Figure 6. Since most of the time Mrk 705 is not significantly detected, it seems reasonable to assume that during the ASCA and Chandra observations (and likely the ROSAT observations as well), Mrk 705 was in a typical flux state. Assuming so, the ASM light curve demonstrates several examples of flaring events in which the flux increases by one, possibly even two orders of magnitude.
5.2 Short-term timing behaviour
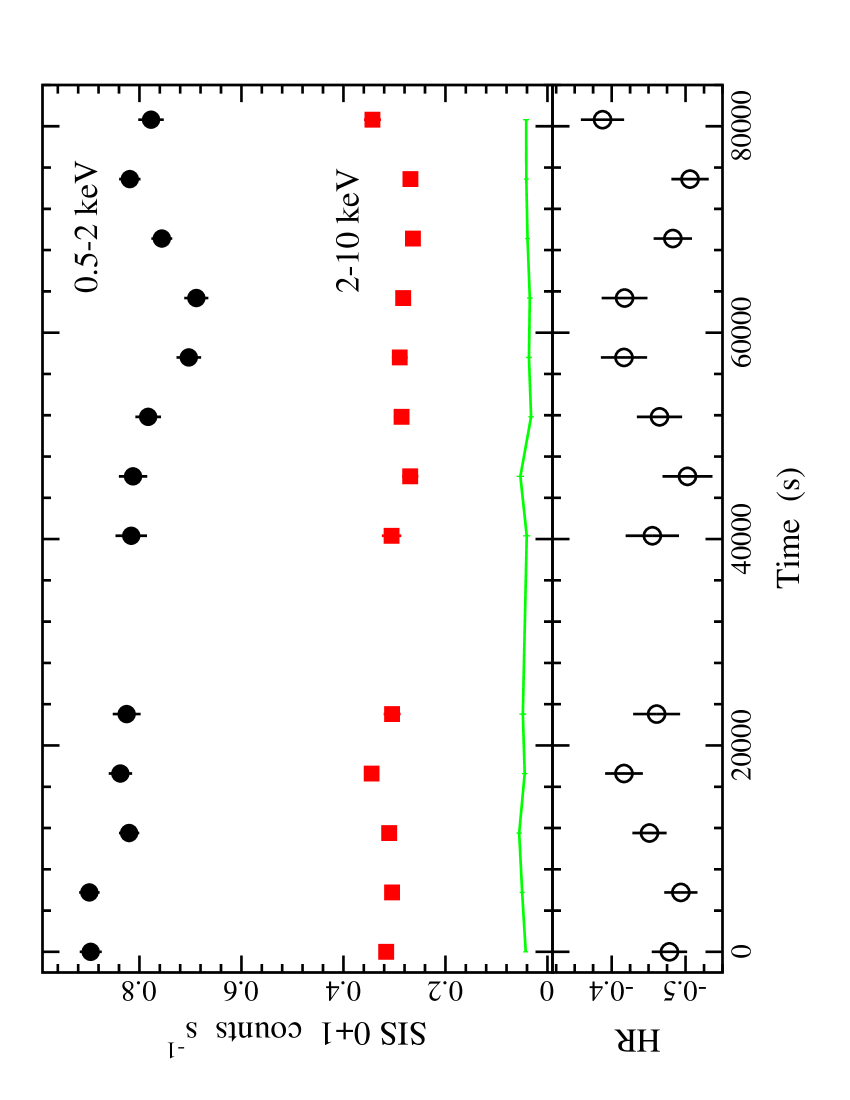
The combined ASCA SIS0 and SIS1 light curves in a hard () and soft () band over the duration () of the observation are shown in Figure 7. On this time scale, both light curves fluctuate by about the mean and are inconsistent with a constant according to a -test ( and dof for the soft and hard light curves, respectively). In addition, the hardness ratio between these two bands also shows variations over this period (lower panel of Figure 7); however, there is no clear correlation between flux and spectral variability.
When examining the Chandra light curve, and the ASCA light curves during each telescope revolution, the fluctuations are greatly diminished (primarily due to statistics). For example, the Chandra light curve in bins was entirely consistent with a constant (). To compare the rapid variability in Mrk 705 to other AGN we calculated the excess variance () following Nandra et al. (1997), using binning of the SIS light curve. We estimate a value of . In comparing the excess variance derived for Mrk 705 with figure 3 of Leighly (1999), in which both NLS1 and BLS1 are plotted, it is clear that the weak variations of Mrk 705 on short time scales are typical of BLS1 of comparable luminosities.
6 Conclusions
We present spectra from four pointed observations of the borderline NLS1, Mrk 705, utilising data from ROSAT, ASCA and Chandra which span over ten years. In addition, we also present the light curve obtained with the RXTE ASM. The main results of this analysis are the following:
-
•
The X-ray position is well correlated with the optical and radio positions of Mrk 705. There is an unidentified radio source located within of Mrk 705; however, this object is not detected with Chandra, suggesting that the X-ray emission measured with ROSAT and ASCA is dominated by Mrk 705.
-
•
Comparing the measured flux during the pointed observations with the long-term ASM light curve, the four spectra of Mrk 705 appear to have been obtained during flux states typical for the source. The flux during these pointed observations is comparable within a factor of .
-
•
In the ROSAT and Chandra observations there is indication of an additional low-energy emission component, which appears constant in spectral form () at all three epochs.
-
•
The high-energy () photon index does not vary significantly between the ASCA and Chandra observations, although the flux increases by about a factor of two. An Fe K emission with is detected in the ASCA spectrum. A line is not statistically required in the Chandra data, and the upper-limit on the equivalent width of a narrow line is . The measured equivalent widths at the two epochs are in agreement with the flux of the line remaining constant while the continuum flux varies. This suggests that the line probably originates in distant material such as the torus.
-
•
The long-term light curve obtained with the RXTE ASM indicates that large amplitude flaring-type events are rare in Mrk 705, but they do occur.
-
•
During the ASCA observation, Mrk 705 does show fluctuations of about in the hard, soft and hardness ratio variability curves. On shorter time scales the variability is diminished.
The optical properties of Mrk 705 place it on the borderline distinguishing NLS1 and BLS1. The X-ray properties examined at various epochs over more than ten years do not allow a clearer definition, but suggest that Mrk 705 is more similar to BLS1. The rather flat slope of the soft-excess, weak short-term variability and neutral iron line (Porquet et al. 2004) are consistent with BLS1 X-ray properties. However, there is some evidence from the RXTE light curve of, albeit rare, large amplitude fluctuations, which have been seen frequently in some NLS1 (e.g. Boller et al. 1997; Brandt et al. 1999).
Deeper studies of samples and individual objects which seem to exhibit properties of both NLS1 and BLS1 could be fruitful in establishing a more accurate defining scheme, as well as revealing the underlying physics.
Acknowledgements.
This research has made use of the Tartarus (Version 3.0) database, created by Paul O’Neill and Kirpal Nandra at Imperial College London, and Jane Turner at NASA/GSFC. Tartarus is supported by funding from PPARC, and NASA grants NAG5-7385 and NAG5-7067. This work has also made use of results provided by the ASM/RXTE teams at MIT and at the RXTE SOF and GOF at NASA’s GSFC. Many thanks are due to the referee for a quick report.References
- (1) Arnaud K., 1996, in: Astronomical Data Analysis Software and Systems, Jacoby G., Barnes J., eds, ASP Conf. Series Vol. 101, p17
- (2) Baskin A., Laor A., 2004, MNRAS, 350, 31
- (3) Boller Th., Brandt W. N., Fink H., 1996, A&A, 305, 53
- (4) Boller Th., Brandt W. N., Fabian A. C., Fink H., 1997, MNRAS, 289, 393
- (5) Boroson T. A., Green R. F., 1992, ApJS, 80, 109
- (6) Botte V., Ciroi S., Rafanelli P., Di Mille F., 2004, AJ, 127, 3168
- (7) Brandt W. N., Boller Th., Fabian A. C., Ruszkowski M., 1999, MNRAS, 303, 58
- (8) Clements E. D., 1981, MNRAS, 197, 829
- (9) Davis J., 2001, ApJ, 562, 575
- (10) Dewangan G., Griffiths R., 2005, ApJ, 625, 31
- (11) Elvis M., Lockman F. J., Wilkes B. J., 1989, AJ, 97, 777
- (12) Ferrari A., 1998, ARA&A, 36, 539
- (13) Goodrich R. W., 1989, ApJ 342, 234
- (14) Grupe D., 1996, PhD thesis, Univ. Göttingen
- (15) Grupe D., 2004, AJ, 127, 1799
- (16) Grupe D., Mathur S., 2004, ApJ, 606, 41
- (17) Leighly K. 1999, ApJS, 125, 297
- (18) Markowitz A., Edelson R., 2004, ApJ, 617, 939
- (19) Mathur S., 2000, MNRAS, 314, 17
- (20) Mathur S., Kuraszkiewicz J., Czerny B., 2001, NewA, 6, 321
- (21) Mathur S., Grupe D., 2005a, A&A, 432, 463
- (22) Mathur S., Grupe D., 2005b, ApJ, accepted (astro-ph/0507624)
- (23) Nandra K., George I. M., Mushotzky R. F., Turner T. J., Yaqoob T., 1997, ApJ, 476, 70
- (24) Osterbrock D. E., Pogge R. W., 1985, ApJ 297, 166
- (25) Porquet D., Reeves J., O’Brien P., Brinkmann W., 2004, A&A, 422, 85
- (26) Pfeffermann E. et al. , 1987, Proc. SPIE, 733, 519
- (27) Puchnarewicz E. M. et al. , 1992, MNRAS, 256, 589
- (28) Reeves J., Wynn G., O’Brien P., Pounds K., 2002, MNRAS, 336, 56
- (29) Véron-Cetty M.-P., Véron P., Gonçalves A., 2001, A&A, 372, 730
- (30) Voges W. et al. , 1999, A&A, 349, 389
- (31) Wang T., Brinkmann W., Bergeron J., 1996, A&A, 309, 81
- (32) White R., Becker R., Helfand D., Gregg M., 1997, ApJ, 475, 479
- (33) Williams R., Pogge R., Mathur S., 2002, AJ, 124, 3042
- (34) Williams R., Mathur S., Pogge R., 2004, ApJ, 610, 737
- (35) Worrall D., Birkinshaw M., 2004, (astro-ph/0410297)
- (36) Zimmermann H. et al. , 1994, MPE Report, 257