XMM-Newton observations of bright ROSAT selected active galactic nuclei with low intrinsic absorption
Abstract
We present a sample of twenty-one ROSAT bright active galactic nuclei (AGN), representing a range of spectral classes, and selected for follow-up snap-shot observations with XMM-Newton. The typical exposure was between . The objects were primarily selected on the bases of X-ray brightness and not on hardness ratio; thus the sample cannot be strictly defined as a “soft” sample. One of the main outcomes from the XMM-Newton observations was that all of the AGN, including eleven type 1.8–2 objects, required low levels of intrinsic absorption (). The low absorption in type 2 systems is a challenge to account for in the standard orientation-based unification model, and we discuss possible physical and geometrical models which could elucidate the problem. Moreover, there does not appear to be any relation between the strength and shape of the soft excess, and the spectral classification of the AGN in this sample. We further identify a number of AGN which deserve deeper observations or further analysis: for example, the LINERs NGC 5005 and NGC 7331, where optically thin thermal and extended emission is detected, and the narrow-line Seyfert 1 II Zw 177, which shows a broad emission feature at .
keywords:
galaxies: active – galaxies: nuclei – X-ray: galaxies1 Introduction
Orientation-based unification models adopt the same physical emission process in all active galactic nuclei (AGN), attributing the apparent diversity to line-of-sight obscuration. The crux of the model is a dense, obscuring torus. When our line-of-sight crosses the torus, emission from the accretion disc and broad line region (BLR) is obscured, and we identify objects as type 2 AGN. When we see the torus face-on, our view of the accretion disc and BLR is unobscured and we recognise a type 1 AGN. There is substantial evidence, mostly based on the detection of the BLR in polarised light (e.g. Antonucci & Miller 1985), that this model is correct in distinguishing between type 1 and type 2 AGN.
There are two pieces of compelling X-ray evidence in support of this model (e.g. Awaki et al. 1991; Moran et al. 2001). First, in most type 2 Seyferts the direct continuum below is highly absorbed, indicating that the X-rays transverse a large column density () as expected from a torus. Secondly, a reflection component is often detected in Seyfert 2s. It is primarily identified by the presence of a strong Fe K fluorescence line, which is produced when the primary X-rays reflect off the cold inner walls of the putative torus. Heavily absorbed AGN are not likely to exhibit many of the X-ray properties seen in type 1 AGN (e.g. relativistic lines, rapid variability, soft excess emission), which are associated with the inner-most regions of the accretion disc.
Recently, X-ray observations have been presented which complicate matters. Objects which are clearly identified by optical means as type 2 AGN; nevertheless exhibit type 1 AGN behaviour in the X-rays (e.g. Risaliti et al. 2005; Barcons et al. 2003; Matt et al. 2003, Panessa & Bassani 2002, hereafter PB02; Boller et al. 2002; Pappa et al. 2001). The apparent lack of emission from the BLR and low intrinsic absorption measured in the X-rays is a challenge to explain with orientation-based unified models. It requires that we preferentially obscure the BLR while viewing the accretion disc directly.
We present a small sample of AGN observed with XMM-Newton (Jansen et al. 2001) that cover a range of spectral types. The objects were all detected with ROSAT and most were optically observed in a follow-up survey by Pietsch et al. (1998) and Bischoff (2004). The benefit of such a soft X-ray selected sample is that it allows the identification and investigation of intrinsic low-absorption type 2 systems, which do not clearly fit into the orientation-based unification scheme. In addition, we identify a number of AGN, which are individually interesting and certainly warrant deeper observations.
2 Sample selection
Cross correlation of the ROSAT All Sky Survey (RASS; Voges et al. 1999) source catalogue with the Catalogue of Principal Galaxies (Paturel et al. 1989) yielded 904 X-ray sources with galaxy counterparts (Zimmermann et al. 2001). Follow-up optical spectroscopy was conducted to identify many of the X-ray bright objects. Many were identified for the first time as active galaxies, resulting in the discovery of nearby AGN (Pietsch et al. 1998; Bischoff 2004).
We have compiled twenty-four XMM-Newton observations of twenty-one AGN from this sample with the intention of studying AGN unification. Most of the objects were observed as part of the Guaranteed Time allocated to the XMM-Newton Telescope Scientist. The objects were selected for follow-up observations because they were:
-
(i)
bright in the RASS energy band () with count rates (corresponding to a flux for a standard AGN power law spectrum with );
-
(ii)
nearby (; )
-
(iii)
observed through a relatively low Galactic column ();
As such, a reasonable broadband () spectrum could be obtained with a typical exposure of . To acquire representation from all AGN spectral types a few objects were retrieved from the XMM-Newton Science Archive. In total the sample includes: six type 1 (two of which are Narrow-line Seyfert 1), three type 1.2 (five observations), one type 1.5, six type 1.8 (seven observations), four type 1.9 (1 of which is a LINER), one type 2 (which is also a LINER). The above classification is based on optical analysis.
Note that this sample differs from the soft X-ray selected sample presented in Grupe et al. (2001) and Grupe et al. (2004), which did not yield any type 2 AGN. The primary difference (aside from brightness) being that the Grupe samples included a hardness ratio cut, which favoured softer AGN. Such a hardness criterion was not adopted in this study.
3 Observations and data reduction
All of the observations were conducted with XMM-Newton between 2000 August and 2002 December. During these observations the EPIC pn (Strüder et al. 2001) detector and MOS (MOS1 and MOS2; Turner et al. 2001) cameras were operated in imaging mode. For simplicity we do not present data acquired with the other instruments. Observational details are found in Table LABEL:tab:log.
The Observation Data Files were processed to produce calibrated event lists using the XMM-Newton Science Analysis System (SAS v6.1.0). Unwanted hot, dead, or flickering pixels were removed as were events due to electronic noise. Event energies were corrected for charge-transfer losses, and response matrices were generated for each spectrum using the SAS tasks ARFGEN and RMFGEN. Light curves were extracted from these event lists to search for periods of high background flaring. Background flaring was problematic in several observations. Data which were corrected for background flaring are indicated in Table LABEL:tab:log. The source plus background photons were extracted from a circular region with a radius of 35′′, and the background was selected from an off-source region with a radius of 50′′ and appropriately scaled to the source region. Single and double events were selected for the pn and single-quadruple events for the MOS. The data quality flag was set to zero (i.e. events next to a CCD edge or bad pixel were omitted).
| (1) | (2) | (3) | (4) | (5) | (6) | (7) | (8) | (9) | (10) |
|---|---|---|---|---|---|---|---|---|---|
| Object | Type | Date | rev. | Window | Exposure (s) | Notes | |||
| year.mm.dd | mode | pn/mos1/mos2 | |||||||
| HCG 4a | 00 34 13.5 | -21 26 19 | S1.8 | 0.027 | 2002.05.29 | 452 | FF | 13661/21177/21394 | ,1 |
| ESO 113– G 010 | 01 05 16.8 | -58 26 13 | S1.8 | 0.026 | 2001.05.03 | 256 | FF | 4071/6911/6911 | 1 |
| ESO 244– G 017 | 01 20 19.6 | -44 07 43 | S1.5 | 0.024 | 2000.12.18 | 188 | FF | 17145/7182/7182 | 1 |
| Mrk 590 | 02 14 33.7 | -00 46 03 | S1 | 0.026 | 2002.01.01 | 378 | SW | 7006/–/10493 | 4, |
| ESO 416– G 002 | 02 35 13.4 | -29 36 18 | S1.9 | 0.059 | 2001.06.28 | 284 | FF | 4269/7182/7182 | ,1 |
| Mrk 609 | 03 25 25.2 | -06 08 30 | S1 | 0.034 | 2002.08.13 | 490 | FF | 6803/8861/8861 | 6 |
| ESO 15– IG 011 | 04 35 16.2 | -78 01 57 | S1.8 | 0.061 | 2000.09.29 | 148 | FF | 5025/7766/7765 | 1 |
| 2001.10.31 | 347 | FF | 4230/7385/7385 | ,1 | |||||
| MCG–01-13-025 | 04 51 41.4 | -03 48 34 | S1.2 | 0.016 | 2000.08.29 | 133 | FF | 906/7445/7445 | ,1 |
| 2002.08.28 | 498 | FF | 2363/6421/6421 | ,1 | |||||
| MCG–02-14-009 | 05 16 21.2 | -10 33 40 | S1 | 0.028 | 2000.09.04 | 135 | FF | 4419/4804/4804 | ,1 |
| PMN J0623–6436 | 06 23 07.7 | -64 36 21 | S1 | 0.129 | 2000.10.13 | 155 | LW | 5941/8591/8591 | ,1 |
| UGC 3973 | 07 42 32.9 | 49 48 30 | S1.2 | 0.022 | 2000.10.09 | 153 | SW | 1680/1861/1838 | 5 |
| 2001.04.26 | 253 | SW | 3590/5737/5736 | 5 | |||||
| Mrk 728 | 11 01 01.4 | 11 02 46 | S1.9 | 0.036 | 2002.05.23 | 449 | FF | 6150/8850/8851 | 7 |
| CGCG 039–167 | 11 24 07.9 | 06 12 56 | S1.8 | 0.038 | 2002.12.19 | 555 | FF | 6387/8410/8410 | 8 |
| NGC 5005 | 13 10 56.3 | 37 03 37 | L1.9 | 0.003 | 2002.12.13 | 551 | eFF | 8796/13103/13118 | 3 |
| CGCG 021–063 | 15 16 39.8 | 00 14 54 | S1.9 | 0.052 | 2002.08.02 | 485 | eFF | 8961/13182/13184 | 2 |
| NGC 7158 | 21 56 56.5 | -11 39 32 | NLS1 | 0.028 | 2001.11.27 | 361 | FF | 4479/7337/7337 | 1 |
| II Zw 177 | 22 19 18.8 | 12 07 57 | NLS1 | 0.082 | 2001.06.07 | 274 | FF | 8650/11954/11954 | ,2 |
| ESO 602– G 031 | 22 36 55.9 | -22 13 12 | S1.8 | 0.034 | 2001.05.25 | 267 | FF | 6136/10785/10785 | ,1 |
| NGC 7331 | 22 37 05.9 | 34 25 19 | L2 | 0.003 | 2002.12.08 | 549 | eFF | 7407/11549/11564 | ,3 |
| UGC 12138 | 22 40 17.7 | 08 03 16 | S1.8 | 0.025 | 2001.06.03 | 272 | FF | 3359/7280/7284 | ,4 |
| AM 2354–304 S | 23 57 28.4 | -30 27 39 | S1.2 | 0.031 | 2001.05.25 | 267 | FF | 4437/6250/6250 | ,1 |
PROCESSING NOTES: () Observation is corrected for background flaring. Source is detected above the background in the band () , () , () , () . () MOS1 was operated in timing mode and the data are ignored here. REFERENCES: (1) Pietsch et al. (1998). (2) Bischoff (2004). (3) Ho et al. (1997). (4) Osterbrock & Martel (1993). (5) Osterbrock & Shuder (1982). (6) Kewley et al. (2001). (7) Kuraszkiewicz et al. (2004). (8) Veron-Cetty & Veron (2003).
4 Spectral analysis
Each AGN spectrum was compared to the respective background spectrum to determine the energy range in which the source was reasonably detected above the background. Most of the objects were detected between . Sources which were not detected in this entire energy band are marked in Table LABEL:tab:log.
The source spectra were grouped such that each bin contained at least 20 counts. Spectral fitting was performed using XSPEC v11.3.1 (Arnaud 1996). Fit parameters are reported in the rest frame of the object, although most of the figures remain in the observed frame. The quoted errors on the model parameters correspond to a 90% confidence level for one interesting parameter (i.e. a = 2.7 criterion). The fit parameters, uncertainties, and statistics are reported for the combined fits to all the EPIC data; however the figures display only the pn data for clarity. K-corrected luminosities were derived assuming isotropic emission. A value for the Hubble constant of = and a standard cosmology with = 0.3 and = 0.7 were adopted. The value for the Galactic column density toward each object was taken from Dickey & Lockman (1990) and is given in Table LABEL:tab:cont.
4.1 The broadband X-ray continuum
As a first approximation, the spectrum of each object was fitted with a single power law which was shaped by a fixed Galactic column density (Dickey & Lockman 1990) and a free intrinsic column density. This simple fit is plotted in Figure 1 for each AGN, and the quality of the fits are reported in column 2 of Table LABEL:tab:cont. For four objects: Mrk 728, Mrk 609, CGCG 021–063, and MCG–01-13-025, this simple model provided a statistically acceptable fit ().
To examine a multi-component broadband continuum, the single power law was replaced by: (1) a broken power law model, and (2) a blackbody plus power law model. Both multi-component continuum models provided improvement over the single power law continuum, and in most cases, an acceptable fit as well. However, for the two LINERs, NGC 5005 and NGC 7331, strong residuals remained at low energies indicating that neither multi-component continuum was completely satisfactory. A significant improvement was established when a power law plus optically thin emission (i.e. a Raymond-Smith plasma; Raymond & Smith 1977), rather than optically thick blackbody emission, was considered. Comparable fits were obtained when the XSPEC model MEKAL (Mewe, Gronenschild & van den Oord 1985; Mewe, Lemen, & van den Oord 1986; Kaastra 1992) was employed instead of the Raymond-Smith model.
The improvement over the single power law model obtained with the broken power law and the power law plus blackbody (or Raymond-Smith) models are shown in column 3 and 4 of Table LABEL:tab:cont, respectively.
For simplicity, the thermal continuum models are adopted for the remaining analysis in order to characterise the individual spectra and generalise the sample. Implications of this decision are discussed in Sect. 6.1. The resulting best-fit parameters are provided in Table LABEL:tab:cont.
| (1) | (2) | (3) | (4) | (5) | (6) | (7) | (8) | (9) | (10) | (11) |
|---|---|---|---|---|---|---|---|---|---|---|
| Object | /dof | |||||||||
| HCG 4a | ||||||||||
| ESO 113- G 010 | ||||||||||
| ESO 244- G 017 | ||||||||||
| Mrk 590 | ||||||||||
| ESO 416- G 002 | ||||||||||
| Mrk 609 | ||||||||||
| ESO 15- IG 011(1) | ||||||||||
| ESO 15- IG 011(2) | ||||||||||
| MCG–01-13-025(1) | ||||||||||
| MCG–01-13-025(2) | ||||||||||
| MCG–02-14-009 | ||||||||||
| PMN J0623-6436 | ||||||||||
| UGC 3973(1) | ||||||||||
| UGC 3973(2) | ||||||||||
| Mrk 728 | ||||||||||
| CGCG 039-167 | ||||||||||
| NGC 5005 | ||||||||||
| CGCG 021-063 | ||||||||||
| NGC 7158 | ||||||||||
| II Zw 177 | ||||||||||
| ESO 602- G 031 | ||||||||||
| NGC 7331 | ||||||||||
| UGC 12138 | ||||||||||
| AM 2354-304 |
: The temperatures given for NGC 5005 and NGC 7331 are for an optically thin thermal plasma rather then for blackbody emission (see text for details).


4.2 Additional spectral features
4.2.1 High-energy emission features
The most common emission features in the band of AGN spectra are those of iron between (depending on the ionisation state of Fe). The width and profile of the line can potentially reveal its physical origin. If the line is emitted from the BLR or the molecular torus the width would be narrow and unresolved in the XMM-Newton pn spectrum, which has a resolution of ( at 7 keV; Ehle et al. 2004). On the other hand, a significantly broadened and asymmetric profile can be manifested from a line emitted in the inner accretion disc close to the putative supermassive black hole.
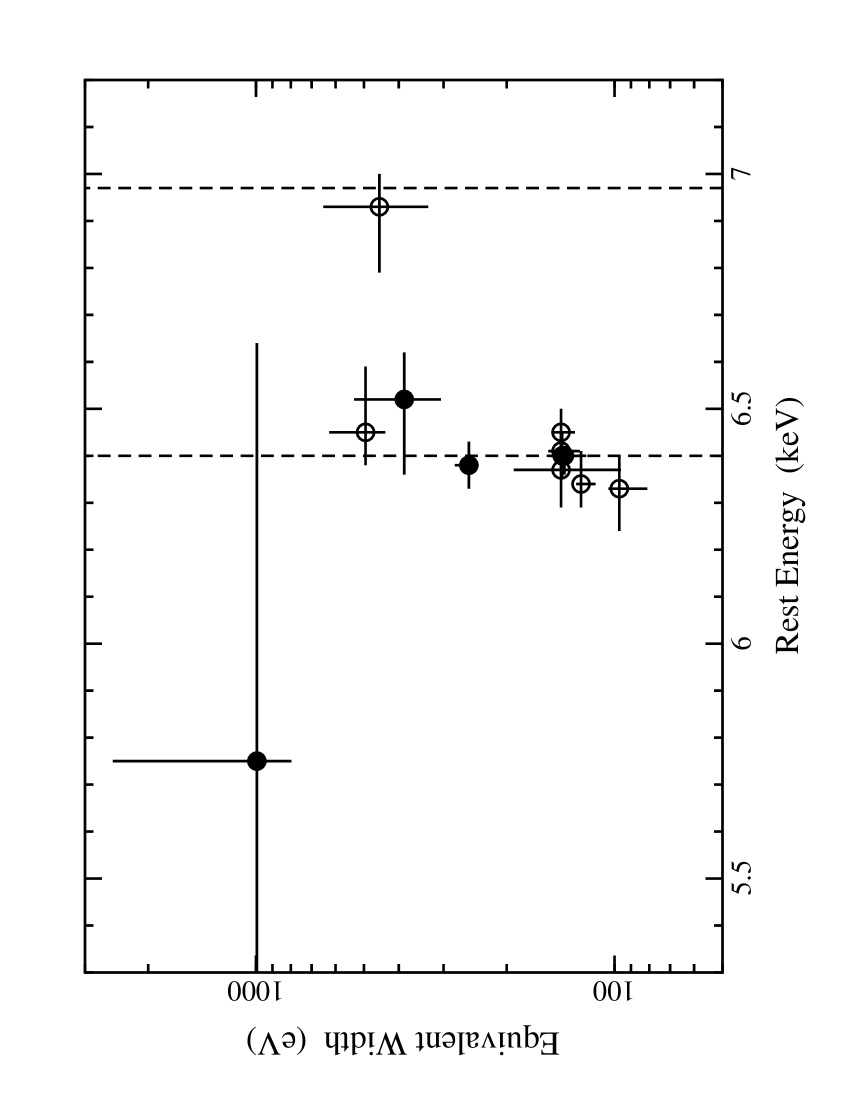
Emission features in the high-energy spectra are examined for by adding a Gaussian profile to the continuum model discussed above. Initially the line width was fixed intrinsically narrow (). Subsequently the width parameter was allowed to vary to determine if it improved the fit. In the interest of brevity we do not test the significance of possible detections in a robust manner (e.g. Protassov et al. 2002), instead we claim a detection “(marginally) significant” if it meets the criterion for one additional free parameter. Further detailed analysis of these spectra should then include a more rigorous investigation of the significance of these line detections, in particularly for the marginal cases. The objects which satisfy our criteria for a line detection are reported in Table LABEL:tab:adds. The distribution of line energies and equivalent widths in the sample is presented in Figure 2.
| (1) | (2) | (3) | (4) | (5) | (6) | (7) | (8) |
|---|---|---|---|---|---|---|---|
| Object | |||||||
| ( keV) | ( eV) | ( eV) | ( eV) | ||||
| HCG 4a | – | – | – | ||||
| ESO 244- G 017 | – | – | – | ||||
| Mrk 590 | – | – | – | ||||
| ESO 015- IG 011(2) | – | – | – | ||||
| MCG–02-14-009 | |||||||
| UGC 3973(1) | – | – | – | ||||
| UGC 3973(2) | |||||||
| Mrk 728 | – | – | – | ||||
| CGCG 039-167 | – | – | – | ||||
| II Zw 177 | – | – | – | ||||
| ESO 602- G 031 | |||||||
| UGC 12139 |
4.2.2 Warm absorber type features
Imprinted on the X-ray continuum of some AGN are features associated with absorption and/or emission from optically thin ionised gas along the line-of-sight, the so-called warm absorber. It was mentioned that the two LINERs in the sample (NGC 5005 and NGC 7331) were better fitted when emission associated with an optically thin ionised gas was considered. In type 1 AGN the most prominent features associated with this warm absorber are the O vii and O viii absorption edges at and , respectively.
To examine warm absorption, an absorption edge was added to the best-fit continuum model of each object. Following the criteria of “significance” established for the high-energy emission lines (see Sect. 4.2.1), significant detections of absorption edges are reported in four objects (Table LABEL:tab:adds).
5 Timing behaviour
An investigation of X-ray variability in the sample was not entirely practical primarily due to the short exposures and gaps (arising from background flaring) in the light curves of many sources Moreover, rapid variability is not normally expected from type 2 AGN, given the high level of absorption usually associated with them. However, as a matter of completeness we did conduct a simple test for any extreme, possibly atypical, behaviour. Light curves were created for each AGN in the range and binned . Each light curve was then compared to a constant using a -test. Only two light curves were found inconsistent with a constant at .
ESO 113– G 010, a Seyfert 1.8, demonstrated fluctuations of about during the short () observation. In combination with the extreme soft excess and emission feature (see Section 6.3.3), the variability in this Seyfert 1.8 certainly adds to its intrigue.
The second object was the Seyfert 1.5, ESO 244– G 017, which had the longest observation in our sample (). Given the duration of the observation the variability cannot be considered atypical. However a modest flare-like event in which the flux increases by in was detected, and was accompanied by mild spectral softening.
6 Discussion
6.1 Soft excess emission and neutral intrinsic absorption
It is beyond the scope of this study to make strong claims about the physical nature of the X-ray continuum, in particular the nature of the soft excess. We note that in all cases the multi-component continuum was an improvement to the absorbed power law model, though not always was it a statistical necessity. Furthermore, no single model (i.e. Comptonisation or thermal) stood out as a better fit to the low-energy spectra in the sample. Sometimes the thermal plus power law model was better than the broken power law, other times the opposite was true.
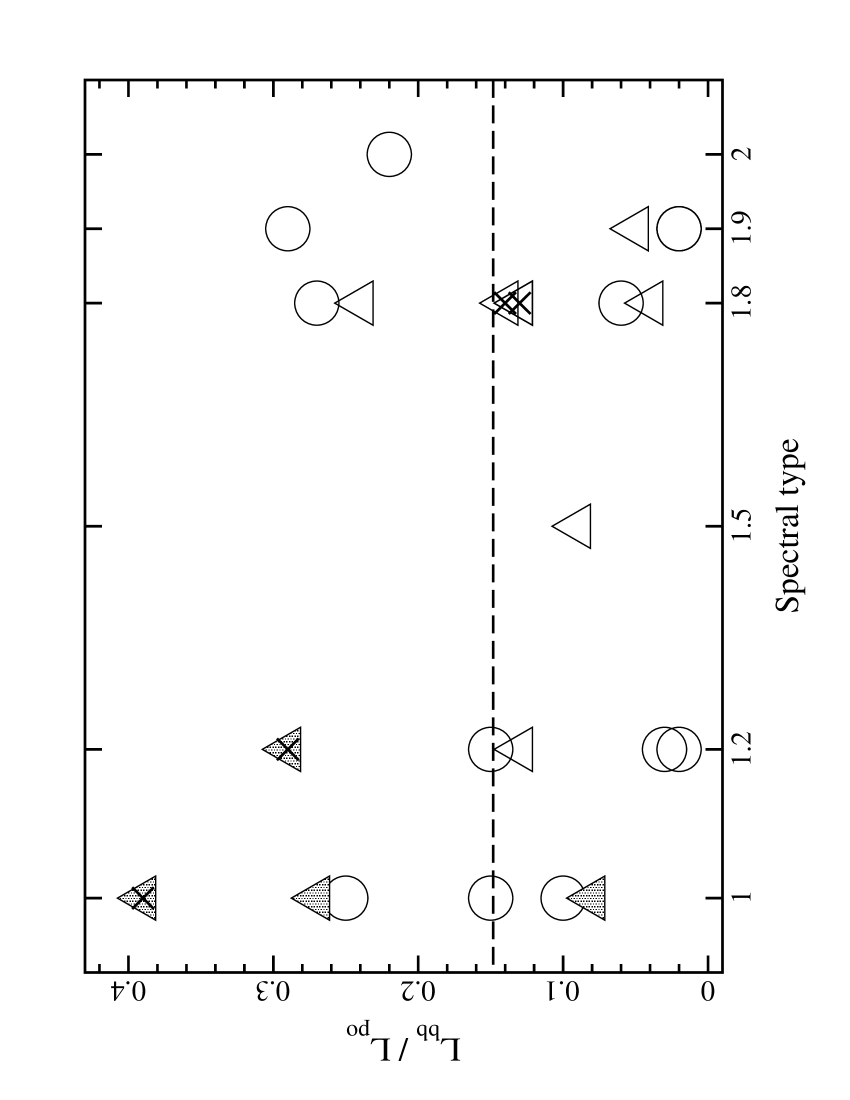
Notably, there does not appear to be a clear correlation between the strength of the soft excess and the spectral classification of AGN in this sample (Figure 3). Indeed, weak and strong soft excesses seem to be distributed amongst type 1 and type 2 (we will include type 1.8 and 1.9 in this group for discussion purposes) objects, with the low luminosity type 2 AGN (HCG 4a, NGC 5005, NGC 7331) possessing particularly strong soft excesses. Moreover, there does not appear to be a difference in the average blackbody temperature between Seyfert 1s and Seyfert 2s (excluding the two LINERs), although a significant discrepancy was recently reported by Mateos et al. (2005) for a sample of objects in the Lockman Hole. The average type 1 and type 2 blackbody temperature in our sample is and , respectively (the uncertainties in the average value is the standard deviation in each subclass of objects).
The main difference between the two multi-component models was in the treatment of the intrinsic cold absorption (ICA). Although in most cases the ICA was poorly constrained and only upper limits could be calculated, there was a tendency for the broken power law model to require a greater amount of ICA. This was obviously a means for the model to accommodate for curvature in the low-energy spectrum of most sources which was satisfied by the natural curvature of the blackbody function. However, the differences were never extreme, and the additional ICA required by the broken power law fits was typically that measured with the blackbody model. We note that there are known uncertainties in the pn calibration in SAS v6.1.0 which will result in underestimating the absorption by a few times (Kirsch 2005). While this implies that there is a degree of uncertainty in the values we have reported, the uncertainty is sufficiently low that we can rule out high levels of absorption. Indeed none of the objects in this sample required intrinsic absorption , regardless of the adopted continuum model or calibration uncertainties.
6.2 Ionised absorption
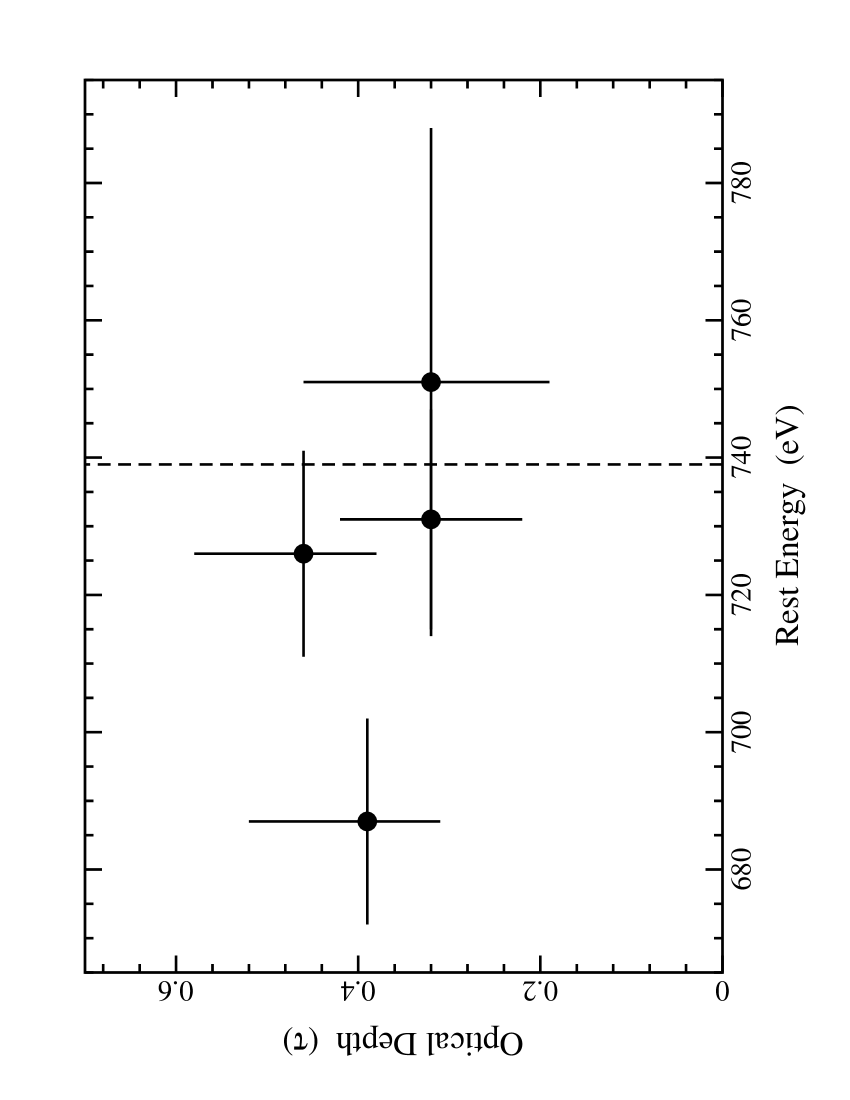
An absorption edge was a significant addition to the spectra of four AGN in our sample (Table LABEL:tab:adds). With the exception of ESO 602– G 031, the measured edge energies were all consistent with absorption from O vii (Figure 4). The only distinguishing characteristic in this sub-sample was that the average luminosity ratio between the blackbody and power law components is higher than it is for the entire sample (Figure 3). It is not reasonable to claim that this is a significant result given the small size of the sample, but it may be worth examining in studies with more objects.
In the case of ESO 602– G 031, the edge was slightly redshifted with respect to O vii. McKernan et al. (2005) demonstrated that in some objects, redshifted absorption edges could be associated with absorption by hot local gas since the velocities measured in the absorber correspond to the recessional velocities of the AGN. Assuming O vii absorption, the measured velocity of the ionised absorber in ESO 602– G 031 is , whereas the recessional velocity of the AGN is about . This implies that the detected feature in ESO 602– G 031 is not local. However, given the complexity of warm absorbers, the blending of features, and the moderate resolution of the EPIC cameras it is not normally possible to unequivocally identify features, or determine velocity shifts.
6.3 FeK emission
6.3.1 Narrow FeK emission
In one-half of the sample (11 objects from 12 observations) an emission line was detected in the high-energy spectrum. In seven objects (ESO 602– G 031, Mrk 728, UGC 12139, ESO 244– G 017, UGC 3973 (first epoch), ESO 15– IG 011 (second epoch), CGCG 039–167) the line was consistent with narrow, unresolved emission from neutral iron. HCG 4a also showed indications of a narrow, unresolved emission line, but at , which can be attributed to completely ionised iron. This in itself is potentially interesting given the rather low luminosity observed in HCG 4a (see Table LABEL:tab:cont). Six of the eight objects displaying narrow emission lines were type 2 AGN, consistent with the standard unification model that narrow fluorescence emission in type 2 AGN originates from reflection off the obscuring torus.
6.3.2 Broad FeK emission
Despite concentrated effort the realisation of relativistically broadened Fe K emission lines in the X-ray spectra of AGN still remains ambiguous with only a few clear-cut examples (e.g. Fabian et al. 2002; Turner et al. 2002). Matters are further complicated with the recognition that a possible broad emission feature can be manifested by partial covering of the central engine by a dense, patchy absorber (e.g. Tanaka et al. 2004).
Four objects in the sample (UGC 3973 (second epoch), Mrk 590, MCG–02-14-009 (see also Porquet 2005), II Zw 177) were fitted better if a broad Gaussian profile was considered rather than an intrinsically narrow profile (see Table LABEL:tab:adds). All four objects were type 1 AGN, which is in line with unification models that suggest we have an unobscured view of broad-line forming regions (e.g. BLR, outer and inner parts of the accretion disc) in Seyfert 1s.
We considered more elaborate models to describe the nature of these broad features, namely line emission from a disc around Schwarzschild black hole (Fabian et al. 1989) and a Laor profile produced in a disc around a Kerr black hole (Laor 1991). Not surprisingly, given the modest data quality, all profiles worked equally well at fitting the broad emission features.
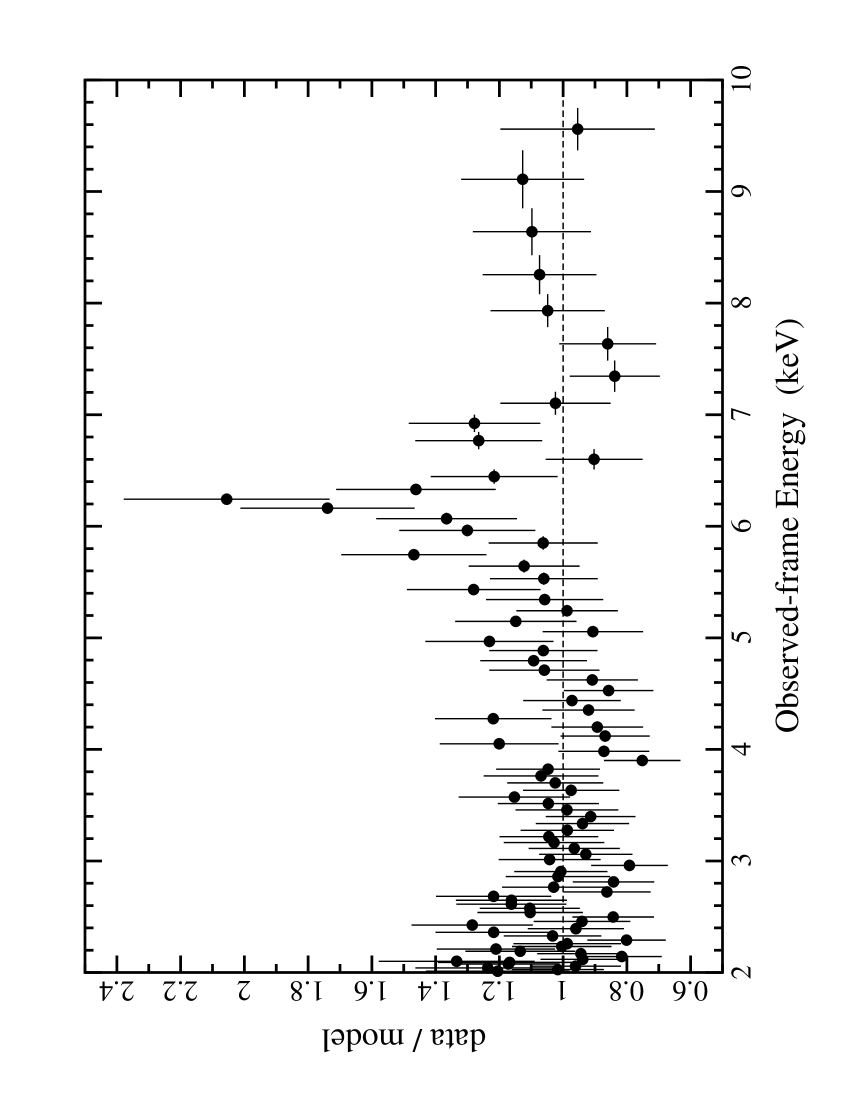
We note that in three objects: MCG–02-14-009, UGC 3973, and Mrk 590 (e.g. Figure 5), the full-width at half-maximum of the Gaussian profiles indicated velocities on the order of . For all three of these AGN, the widths of the iron lines are only about a factor of greater then the velocities measured in the H emission line from the broad line region. This suggests that, at least in these cases, the iron emission could be originating from the outer regions of the accretion disc, where Doppler effects dominate relativistic effects.
The profile in the NLS1, II Zw 177, appeared tantalising. The feature was very broad, with , and the best-fit line energy was redshifted from , though not formally inconsistent with neutral iron (see Figure 2).
We reiterate that given the available statistics, absorption models (such as partial covering), which would introduce curvature in the high-energy spectrum, cannot be formally excluded.
6.3.3 Unidentified narrow features
Recently, a number of emission and absorption features have been detected in some AGN, which appear at energies red- or blue-shifted with respect to Fe K (e.g. Matt et al. 2005; Turner et al. 2004, 2002; Guainazzi 2003; Yaqoob et al. 2003). Proposed explanations include rotating hot spots on the accretion disc (Iwasawa et al. 2004 and references within) and inflowing or outflowing material (Turner et al. 2004) as may be expected from an aborted jet (Ghisellini et al. 2004).
Based on our definition of a detection, the combined EPIC spectra did not show any such features. However, there were some potentially interesting features which appeared significant in the higher signal-to-noise pn spectrum. Two AGN which stand out are ESO 113– G 010, with a possible narrow line at ; and UGC 3973, with a potential line at . Both spectra are presented in detail in other works (Porquet et al. 2004, for ESO 113– G 010; Gallo et al. 2005 for UGC 3973) and we will not discuss them further here.
6.4 Unabsorbed type 2 AGN
Much work has been exerted on the study of optically defined type 2 AGN which exhibit X-ray behaviour more typical of type 1 AGN (e.g. unabsorbed spectra, extreme variability, soft-excess emission; e.g. Risaliti et al. 2005; Barcons et al. 2003; Risaliti 2002; PB02; Boller et al. 2002). Such objects remain a challenge to describe in terms of the standard orientation-based unification model. In this study, we have identified eleven objects, which are optically defined as Seyfert 1.8–2, but possess type 1 AGN X-ray characteristics.
6.4.1 Pure type 2 AGN
It has been suggested that there exists a type 2 AGN dichotomy, in which we have the usual obscured type 1 AGN, along with “pure” type 2 AGN (e.g. Tran 2001). Tran suggests that in pure Seyfert 2s, a Seyfert 1 nucleus is overwhelmed by a strong starbust component rendering the BLR weak or even absent. On the other hand, Lumsden et al. (2004) dismiss this proposed division, attributing it largely to data quality.
Nicastro et al. (2003) find that pure type 2 AGN candidates are very low accretion rate (and low-luminosity) systems, in which the BLR does not form (Nicastro 2000). The low-luminosity aspect was noticed by PB02, who found a large fraction of unabsorbed type 2 objects when low-luminosity AGN (LLAGN; , e.g. Terashima et al. 2002) were considered.
With the exception of HCG 4a and the two LINERs, the unabsorbed Seyfert 2s in our sample have luminosities on the order of . This is rather typical for Seyfert activity, so it is not conclusive that the objects presented here are “pure” type 2 AGN candidates.
6.4.2 High dust-to-gas ratio
The intrinsic column densities estimated for the type 2 AGN in our sample are on the order of . Following Gorenstein (1975), this translates into an extinction of , which is insufficient to redden the BLR in Seyfert 1.8 and 1.9s (, Goodrich et al. 1994). To satisfy this discrepancy the galaxies in our sample would require a gas-to-dust ratio up to 100 times that observed in our Galaxy, which could occur if the AGN is viewed through some dusty and patchy environment within the host galaxy (e.g. dust lanes, bars, and star-forming regions). A similarly large value was found for the sample analysed by PB02, who further suggested that the X-ray absorption was consistent with arising in the narrow line region, the consequence being that a torus was not required.
6.4.3 Variability
We note that none of the X-ray observations were contemporaneous with the optical classification of these objects. As optical and X-ray spectra are known to vary with time, there is always a level of uncertainty involved. An extreme example is the X-ray observations of NGC 1365 (Risaliti et al. 2005), in which the spectrum went from being Compton thick to Compton thin, and back to thick, in just 6 weeks.
Risaliti et al. proposed a model where the variations are attributed to line-of-sight effects, in which the AGN is viewed through a stratified absorber (see their fig. 2). In the case of NGC 1365, the AGN is viewed on the edge where the medium changes from Compton thick to thin. Subtle changes in the composition in this mixing region can produce the observed effects.
A similar model can be envisaged for unabsorbed Seyfert 2s, in general. Frequent X-ray exposures, and simultaneous optical observations of a few of the objects in this sample could be enlightening.
6.4.4 How many unabsorbed Seyfert 2s are there?
A bright and soft survey as presented here will naturally be biased toward unabsorbed objected. Therefore estimating the number of AGN expected to have similar properties is hardly accurate. Indeed, of the type 2 AGN in our sample showed low levels of intrinsic absorption.
From the deep XMM-Newton observations of the Lockman Hole, Mateos et al. (2005) reported that 5 out of 28 optically defined type 2 AGN exhibited low levels of absorption. The ratio () is comparable to the estimate of suggested by PB02.
6.5 X-ray emission from NGC 5005 and NGC 7331
The low-energy spectrum of the two LINERs, NGC 5005 and NGC 7331, demonstrated more complexity than seen in the other objects of the sample. When fitted with a simple power law the data showed excess emission concentrated in the range (Figure 1) similar to that observed in the Seyfert 2, NGC 5643 (Guainazzi et al. 2004).
A highly absorbed power law or blackbody continuum, in addition to emission and absorption lines could improve the fit, but the simplest and best fits were found when modelling the soft excess with emission from an optically thin thermal plasma. The best-fit parameters for NGC 5005 were comparable to those obtained with earlier ASCA data (Terashima et al. 2002).
The nature of the soft excess in NGC 5005 and NGC 7331 may be unusual in terms of “normal” AGN behaviour, but not uncommon in terms of LINER activity. The spectral properties of both objects are consistent with the known X-ray class properties of LINERs (Terashima et al. 2002).
The proximity of the LINERs makes it possible to recognise that both objects are extended in the XMM-Newton images. It has been previously determined that a significant fraction of the soft emission in NGC 5005 (Rush & Malkan 1996) and NGC 7331 (Tyler et al. 2004) originates from an extended component on host-galaxy scales. In principle, the hard power law could also be due to the contribution of galactic binaries in the host galaxy. In fact, Swartz et al. (2004) identified three ultraluminous X-ray (ULX) sources associated with NGC 7331, which could be contributing part of the high-energy emission. However, from a Chandra image of NGC 7331, Tyler et al. (2004) determined that the peak X-ray emission was coming from the galactic nucleus and not the vicinity of the molecular ring or host galaxy. Of course, this is not proof that the hard X-rays are coming from the Seyfert 2 nucleus, but at least for NGC 7331 we consider it the most likely scenario.
7 Conclusions
We have presented a snap-shot survey of twenty-one bright, ROSAT selected AGN observed in the band with XMM-Newton. The main results of the analysis are as follow:
-
•
All of the sources, including eleven type 1.8–2 objects, showed low levels of intrinsic absorption (). Not surprisingly, a bright soft-X-ray sample such as this may be biased toward low-absorption systems. This is beneficial in identifying unabsorbed Seyfert 2s, which do not clearly fit into the orientation-based unification models.
-
•
There does not appear to be a clear correlation between the strength and shape (i.e. temperature) of the soft excess, and the spectral classification of AGN in this sample.
-
•
The two LINER type objects in the sample displayed extended X-ray emission in their XMM-Newton image and a soft excess above a power law, which was best described with optically thin thermal emission.
-
•
Low-energy absorption edges are detected in four objects. In three cases the best fit edge energies are consistent with O vii absorption. In one case, the best-fit energy is redshifted with respect to O vii.
-
•
Four objects showed indications of broad Fe K emission, all of which were type 1 AGN. The lines in three of the objects could be explained by emission from the outer regions of an accretion disc as they display velocity widths greater than those seen in the optical BLR, but not at relativistic levels expected closer to the black hole. The feature in the NLS1, II Zw 177, was very broad and an origin close to the central black hole, or partial covering, should be considered.
Of primary interest is the detection of a large fraction of unabsorbed type 2 AGN. We have demonstrated that a bright RASS selected sample such as this one can be useful in selecting unabsorbed type 2 AGN candidates. Cross-correlation of the RASS or the ROSAT Bright Survey (Schwope et al. 2000) with large optically selected samples of Seyfert 2s, such as those available with the SDSS, can potentially reveal hundreds of candidates.
Acknowledgements
Based on observations obtained with XMM-Newton, an ESA science mission with instruments and contributions directly funded by ESA Member States and the USA (NASA). Many thanks to Karsten Bischoff for providing us with a copy of his PhD dissertation, and to Günther Hasinger for useful discussion. Much appreciation to the anonymous referee for providing constructive comments, which lead to improvement of the manuscript.
References
- [1] Antonucci R. R. J., Miller J. S., 1985, ApJ, 297, 621
- [2] Arnaud K., 1996, in: Astronomical Data Analysis Software and Systems, Jacoby G., Barnes J., eds, ASP Conf. Series Vol. 101, p17
- [3] Awaki H., Koyama K., Inoue H., Halpern J., 1991, PASJ, 43, 195
- [4] Barcons X., Carrera F., Ceballos M., 2003, MNRAS, 339, 757
- [5] Bischoff K., 2004, PhD thesis, Univ. Göttingen
- [6] Boller Th. et al. , 2003, A&A, 397, 557
- [7] Dickey J. M., Lockman F. J., 1990, ARA&A, 28, 215
- [8] Ehle M. et al. 2004, XMM-Newton Users’ Handbook, iss 2.2
- [9] Fabian A. C., Rees M. J., Stella L., White N. E., 1989, MNRAS, 238, 729
- [10] Fabian A. C. et al. , 2002, MNRAS, 335, 1
- [11] Freyberg M. J. et al., 2004, in Flanagan K., Siegmund O., eds, X-Ray and Gamma-Ray Instrumentation for Astronomy XIII, Proceedings of the SPIE, 5165, 112
- [12] Gallo L., Fabian A., Boller Th., Pietsch W., 2005, MNRAS, 363, 64
- [13] Ghisellini G., Haardt F., Matt G., 2004, A&A, 413, 535
- [14] Goodrich R., Veilleux S., Hill G., 1994, ApJ, 422, 521
- [15] Gorenstein P., 1975, ApJ, 198, 95
- [16] Guainazzi M., 2003, A&A, 401, 903
- [17] Guainazzi M., Rodriguez-Pascual P., Fabian A., Iwasawa K., Matt G., 2004, MNRAS, 355, 297
- [18] Grupe D., Thomas H.-C., Beuermann K., 2001, A&A, 367, 470
- [19] Grupe D., Wills B., Leighly K., Meusinger H., 2004, AJ, 127, 156
- [20] Ho L. C., Filippenko A. V., Sargent W. L. W., 1997, ApJS, 112, 315
- [21] Iwasawa K., Miniutti G., Fabian A., 2004, MNRAS, 355, 1073
- [22] Jansen F. et al. 2001, A&A, 365, L1
- [23] Kaastra J.S., 1992, An X-Ray Spectral Code for Optically Thin Plasmas (Internal SRON-Leiden Report, updated version 2.0)
- [24] Kewley L. J., Heisler C. A., Dopita M. A., Lumsden S., 2001, ApJS, 132, 37
- [25] Kirsch M., 2005, XMM-Newton Calibration Documents (CAL-TN-0018-2.4)
- [26] Kuraszkiewicz J., Green P., Crenshaw D., Dunn J., Forster K., Vestergaard M., Aldcroft T., 2004, ApJS, 150, 165
- [27] Laor A., 1991, ApJ, 376, 90
- [28] Lumsden S., Alexander D., Hough J., 2004, MNRAS, 348, 1451
- [29] Mewe R., Gronenschild E.H.B.M., van den Oord G.H.J., 1985, A&AS, 62, 197
- [30] Mewe R., Lemen J.R., van den Oord G.H.J., 1986, A&AS, 65, 511
- [31] Nicastro F. 2000, ApJ, 530, 65
- [32] Nicastro F., Martocchia A., Matt G., 2003, ApJ, 589, 13
- [33] Matt G., Porquet D., Bianchi S., Falocco S., Maiolino R., Reeves J., Zappacosta L., 2005, Accepted by A&A, (astro-ph/0502323)
- [34] Matt G., Guainazzi M., Maiolino R., 2003, MNRAS, 342, 422
- [35] Mattson B., Weaver K., 2004, ApJ, 601, 771
- [36] McKernan B., Yaqoob T., Reynolds C., 2004, ApJ, 617, 232
- [37] Moran E., Kay L., Davis M., Filippenko A., Barth A., 2001, ApJ, 556, 75
- [38] Osterbrock D. E., Martel A., 1993, ApJ, 414, 552
- [39] Osterbrock D. E., Shuder J. M., 1982, ApJS, 49, 149
- [40] Panessa F., Bassani L., 2002, A&A, 394, 435 (PB02)
- [41] Pappa A., Georgantopoulos I., Stewart G., Zezas A., 2001, MNRAS, 326, 995
- [42] Paturel G., Fouque P., Bottinelli L., Gouguenheim L., 1989, A&AS, 80, 299
- [43] Pietsch W., Bischoff K., Boller Th., Döbereiner S., Kollatschny W., Zimmermann H.-U., 1998, A&A, 333, 48
- [44] Porquet D., Reeves J, Uttley P., Turner T. J., 2004, A&A, 427, 101
- [45] Porquet D., 2005, submitted to A&A
- [46] Protassov R., van Dyk D., Connors A., Kashyap V., Siemiginowska A., 2002, ApJ, 571, 545
- [47] Raymond J. C., Smith B. W., 1977, ApJS, 35, 419
- [48] Risaliti G., 2002, A&A, 386, 379
- [49] Risaliti G., Elvis M., Fabbiano G., Baldi A., Zezas A., 2005, ApJ, 623, 93
- [50] Ross R. R., Fabian A. C., Brandt W. N., 1996, MNRAS, 278, 1082
- [51] Rush B., Malkan M., 1996, ApJ, 456, 466
- [52] Schwope A. et al. , 2000, AN, 321, 1
- [53] Strüder L. et al. 2001, A&A, 365, L18
- [54] Swartz D., Ghosh K., Tennant A., Wu K., 2004, ApJS, 154, 519
- [55] Tanaka Y.; Boller Th., Gallo L., Keil R., Ueda Y., 2004, PASJ, 56, 9
- [56] Terashima Y., Iyomoto N., Ho L., Ptak A., 2002, ApJS, 139, 1
- [57] Tran H., 2001, ApJ, 554, 19
- [58] Turner M. J. et al. , 2001, A&A, 365, 27
- [59] Turner T. J. et al. 2002, ApJ, 574, L123
- [60] Turner T. J., Kraemer S. B., Reeves J. N., 2004, ApJ, 603, 62
- [61] Tyler K., Quillen A., LaPage A., Rieke G., 2004, ApJ, 610, 213
- [62] Veron-Cetty M., Veron P., 2003, A&A, 412, 399
- [63] Voges W. et al. , 1999, A&A, 349, 389
- [64] Wandel A., Peterson B., Malkan M., 1999, ApJ, 526, 579
- [65] Yaqoob T., George I. M., Kallman T. R., Padmanabhan U., Weaver K. A., Turner T. J., 2003, ApJ, 596, 85
- [66] Zimmermann H.-U., Boller Th., Döbereiner S., Pietsch W., 2001, A&A, 378, 30