A very deep Chandra observation of the Perseus cluster: shocks, ripples and conduction
Abstract
We present the first results from a very deep Chandra X-ray observation of the core of the Perseus cluster of galaxies. A pressure map reveals a clear thick band of high pressure around the inner radio bubbles. The gas in the band must be expanding outward and the sharp front to it is identified as a shock front, yet we see no temperature jump across it; indeed there is more soft emission behind the shock than in front of it. We conclude that in this inner region either thermal conduction operates efficiently or the co-existing relativistic plasma seen as the radio mini-halo is mediating the shock. If common, isothermal shocks in cluster cores mean that we cannot diagnose the expansion speed of radio bubbles from temperature measurements alone. They can at times expand more rapidly than currently assumed without producing significant regions of hot gas. Bubbles may also be significantly more energetic. The pressure ripples found in earlier images are identified as isothermal sound waves. A simple estimate based on their amplitude confirms that they can be an effective distributed heat source able to balance radiative cooling. We see multiphase gas with about at a temperature of about 0.5 keV. Much, but not all, of this X-ray emitting cooler gas is spatially associated with the optical filamentary nebula around the central galaxy, NGC 1275. A residual cooling flow of about may be taking place. A channel is found in the pressure map along the path of the bubbles, with indications found of outer bubbles. The channel connects in the S with a curious cold front.
keywords:
X-rays: galaxies — galaxies: clusters: individual: Perseus — intergalactic medium1 Introduction
The Perseus cluster, A 426, is the X-ray brightest cluster in the Sky and has therefore been well studied by all X-ray telescopes. The X-ray emission is due to thermal bremsstrahlung and line radiation from the hot IntraCluster Medium (ICM) and is sharply peaked on the cluster core, centred on the cD galaxy NGC 1275. Jets from the nucleus of that galaxy have inflated bubbles to the immediate N and S, displacing the ICM (Böhringer et al 1993; Fabian et al 2000). Ghost bubbles devoid of radio-emitting electrons, presumably from past activity, are seen to the NW and S. The radiative cooling time of the gas in the inner few tens of kpc is 2–3 hundred Myr, leading to a cooling flow of a few if there is no balancing heat input. Energy from the bubbles or the bubble inflation process is a likely source of heat but the energy transport and dissipation mechanisms have been uncertain.
We have previously observed the Perseus cluster with the Chandra Observatory for 25 ks (Fabian et al 2000; Schmidt et al 2002; Fabian et al 2002), 200 ks (Fabian et al 2003a,b, Sanders et al 2004, 2005) and now present here the first results from a further 800 ks of observation. The total good exposure time is 900 ks.
In the earlier work we discovered both cool gas and shocks surrounding the inner bubbles as well as quasi-circular ripples in the surrounding gas which we interpreted as sound waves generated by the cyclical bubbling of the central radio source. Related features have been seen in the Virgo cluster (Forman et al 2003). The NW ghost bubble has a horseshoe-shaped optical H filament trailing it which we interpret as showing the streamlines in the ICM. On this basis we concluded that the ICM is not highly turbulent and thus that viscosity is high enough to dissipate the energy carried by the sound waves (Fabian et al 2003a,b). Such an energy transport and dissipation mechanism is roughly isotropic and can thereby provide the required gently distributed heat source required by observation of this and other similarly X-ray peaked clusters (Ruszkowski et al 2004a,b,2005; Reynolds et al 2005; Fabian et al 2005).
Our goal in the present work is to determine the temperature and pressure of the ICM accurately so that we can study the processes taking place there in more detail. We indeed confirm that the pressure jumps at the weak shock surrounding the inner bubbles and also that the ripples represent significant ripples in pressure. The temperature does not jump at the shock, however, which may be due to the action of efficient thermal conduction. The energy from the bubbles propagates through isothermal sound waves and conduction in the inner regions. If this is a common property of such regions then some of the otherwise puzzling behaviour can be understood.
The redshift of the Perseus cluster is 0.0183, which for a Hubble constant of corresponds to a luminosity distance of 78.4 Mpc and an angular scale of 367 pc per arcsec.
2 The Data
The Chandra observations used for the analysis presented in this paper are listed in Table 1. The total exposure time of just over 1 Ms is reduced after removing periods containing flares to 890 ks. To filter the datasets we examined the lightcurve between 2.5 and 7 keV on the ACIS-S1 CCD. The S1 CCD is back-illuminated like the S3 and so it is best CCD to search for flares, as the Perseus cluster emission is dominant over flares on the S3 CCD. The ciao 3.3.2 lc_clean tool was used to remove periods from the dataset which deviated away from the median count rate of all the observations. Observations 3209 and 4289 did not use the S1 CCD and did not show any flares on the S3 CCD, and so were left unfiltered.
| Obs. ID | Sequence | Observation date | Exposure (ks) | Nominal roll (deg) | Pointing RA | Pointing Dec |
|---|---|---|---|---|---|---|
| 3209 | 800209 | 2002-08-08 | 95.8 | 101.2 | 3:19:46.86 | +41:31:51.3 |
| 4289 | 800209 | 2002-08-10 | 95.4 | 101.2 | 3:19:46.86 | +41:31:51.3 |
| 6139 | 800397 | 2004-10-04 | 51.6 | 125.9 | 3:19:45.54 | +41:31:33.9 |
| 4946 | 800397 | 2004-10-06 | 22.7 | 127.2 | 3:19:45.44 | +41:31:33.2 |
| 4948 | 800398 | 2004-10-09 | 107.5 | 128.9 | 3:19:44.75 | +41:31:40.1 |
| 4947 | 800397 | 2004-10-11 | 28.7 | 130.6 | 3:19:45.17 | +41:31:31.3 |
| 4949 | 800398 | 2004-10-12 | 28.8 | 130.9 | 3:19:44.57 | +41:31:38.7 |
| 4950 | 800399 | 2004-10-12 | 73.4 | 131.1 | 3:19:43.97 | +41:31:46.1 |
| 4952 | 800400 | 2004-10-14 | 143.2 | 132.6 | 3:19:43.22 | +41:31:52.2 |
| 4951 | 800399 | 2004-10-17 | 91.4 | 135.2 | 3:19:43.57 | +41:31:42.6 |
| 4953 | 800400 | 2004-10-18 | 29.3 | 136.2 | 3:19:42.83 | +41:31:48.5 |
| 6145 | 800397 | 2004-10-19 | 83.1 | 137.7 | 3:19:44.66 | +41:31:26.7 |
| 6146 | 800398 | 2004-10-20 | 39.2 | 138.7 | 3:19:43.92 | +41:31:32.7 |
The level 1 event files were reprocessed using the PSU CTI corrector (Charge Transfer Inefficiency; Townsley et al 2002a, 2002b). Level 2 event files were produced by removing standard grades and bad time intervals. Each of the event files was then reprojected to match the coordinates of the 04952 observation. Images of the data in this paper were produced by summing all the images from the individual datasets. To correct for exposure variation we created exposure maps for each of the CCDs for each of the datasets and for each of the bands. The summed images were then divided by the summed exposure maps.
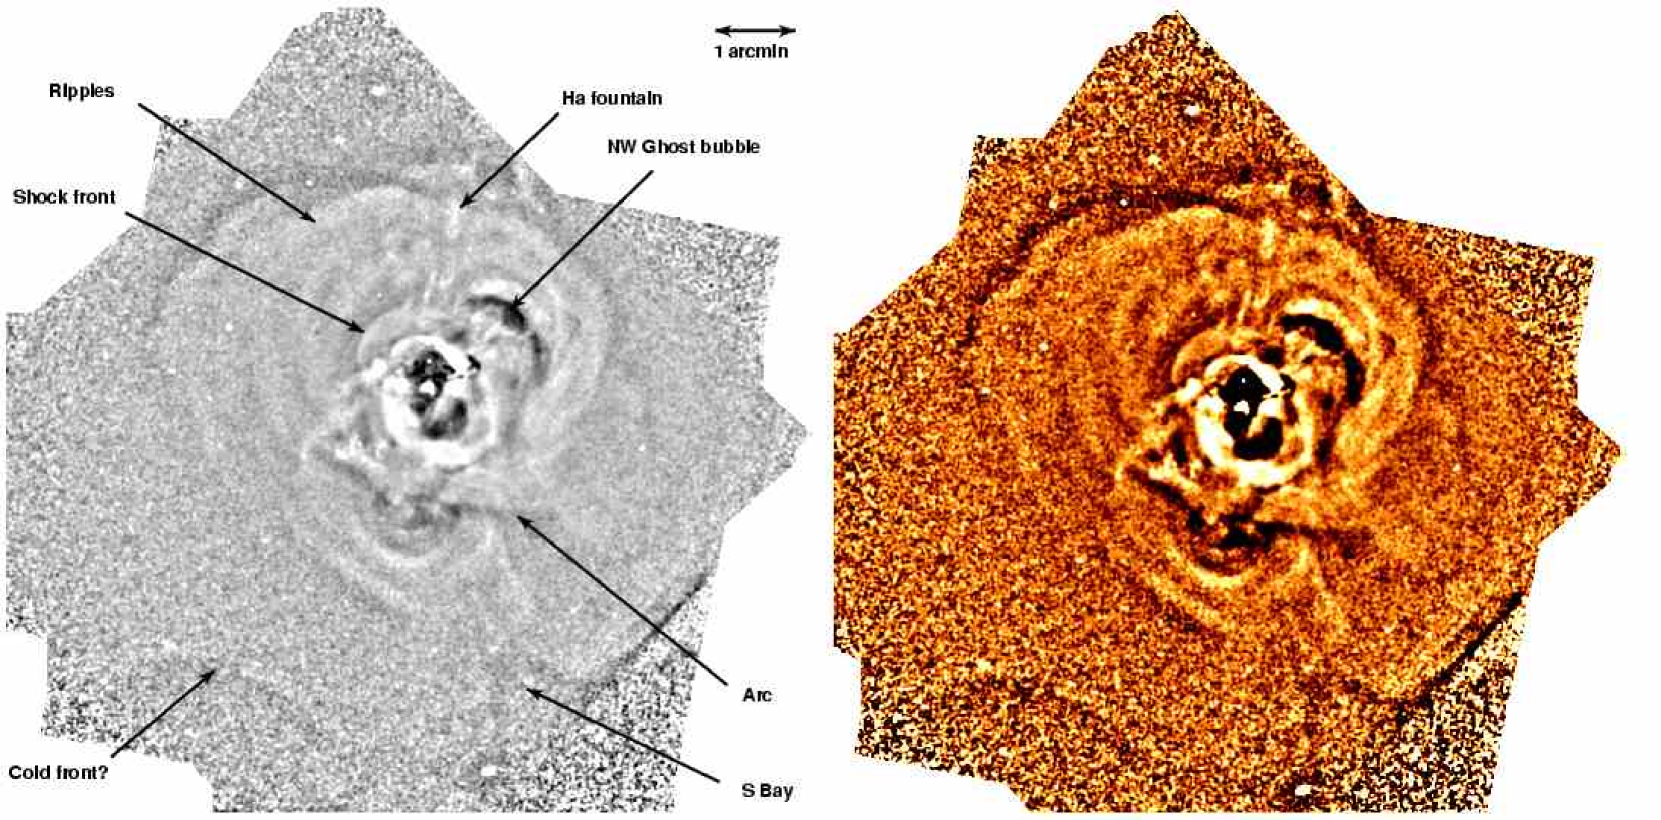
We have produced unsharp-mask images by subtracting images which have been smoothed on two lengthscales. Fig. 2 (top) shows the result after using Gaussian smoothing of 2 and 20 pixels. The ripples are very clear, out to radii of 3–4 arcmin (60–80 kpc) from the nucleus. An arclike step in surface brightness occurs arcmin S of the nucleus. A cold front is seen to the SE (we verify that the pressure is approximately continuous across the sharp surface brightness change in Section 4). Such features were first seen in Chandra images of clusters by Markevich et al (2000). There is a major difference with the feature seen here, however, since it is concave and cannot be due to the core moving through a wider hotter gas. It does however appear to connect the ‘bay’ to the S of the nucleus which connects in towards the nucleus along a narrow channel emerging to the SSW from the inner regions. This corresponds spatially to a weak outer H filament (Sanders et al 2005) although extends much further than any optical emission. X-ray emission is also associated with a much more dominant long radial H filament seen to the N of the nucleus (see e.g. Conselice et al 2001). The X-ray feature appears to break beyond the ripples and is labelled as the H fountain.
As will be discussed later, we suspect that the radial features are due to cold and cooler gas dragged out from the centre by rising buoyant bubbles. They represent the main axis along which most of the bubbles rise. The S cold front could then be the edge of a giant hotter bubble either produced by a past major outburst of the nucleus (cf. McNamara et al 2005 for Hydra A) or where the hot gas accumulates due to the interior entropy of the bubbles matching the external value there.
3 Temperature and Pressure maps
The total of million counts in the final all band image from the ACIS-S3 chip means that we can measure spectral properties on unprecedented small scales. In order to proceed we have divided the image into bins with approximately the same number of counts and used xspec 11.3.2 (Arnaud 1996) fitting with mekal models (Mewe, Gronenschild & van den Oord 1985; Liedahl, Osterheld & Goldstein 1995) to obtain spectral parameters, fitting between 0.5 and 7 keV. The temperature map shown in Fig. 4 was derived in this way using a contour binning approach (Sanders in preparation) with 625 or greater ct per spectrum. In each fit the metallicity (in Solar ratios; Anders & Grevesse 1989) and absorption column density were fixed at values measured when fitting spectra from bins containing ct per bin or greater, except in the region around the High Velocity System where the absorbing column density was allowed to be free. The results for these parameters is broadly similar to those found in our earlier work (Sanders et al 2004). Details will be given in a later paper. For the present work we concentrate on the temperature and emission measure distributions.
We used standard blank sky observations to act as backgrounds for the spectral fitting. The background observations were split into sections to match the ratio of exposure time between each foreground observation. These datasets were then reprojected to match the foreground observations, and then reprojected to the 4952 observation. The exposure time of the backgrounds were altered to ensure the same rate of counts between 9 and 12 keV as their respective foregrounds, in order to correct for the variation of background with time. To create a total spectrum, the spectra from each of the individual observations were added together, excluding observations which did not have any counts in the region examined. The background spectra were added together similarly. The standard PSU CTI corrector response was used. Ancillary responses for each dataset and region were produced using the ciao mkwarf tool, weighting CCD regions using the number of counts between 0.5 and 7 keV. These ancillary responses were averaged for each region, weighting according to the number of counts between 0.5 and 7 keV for a particular dataset.
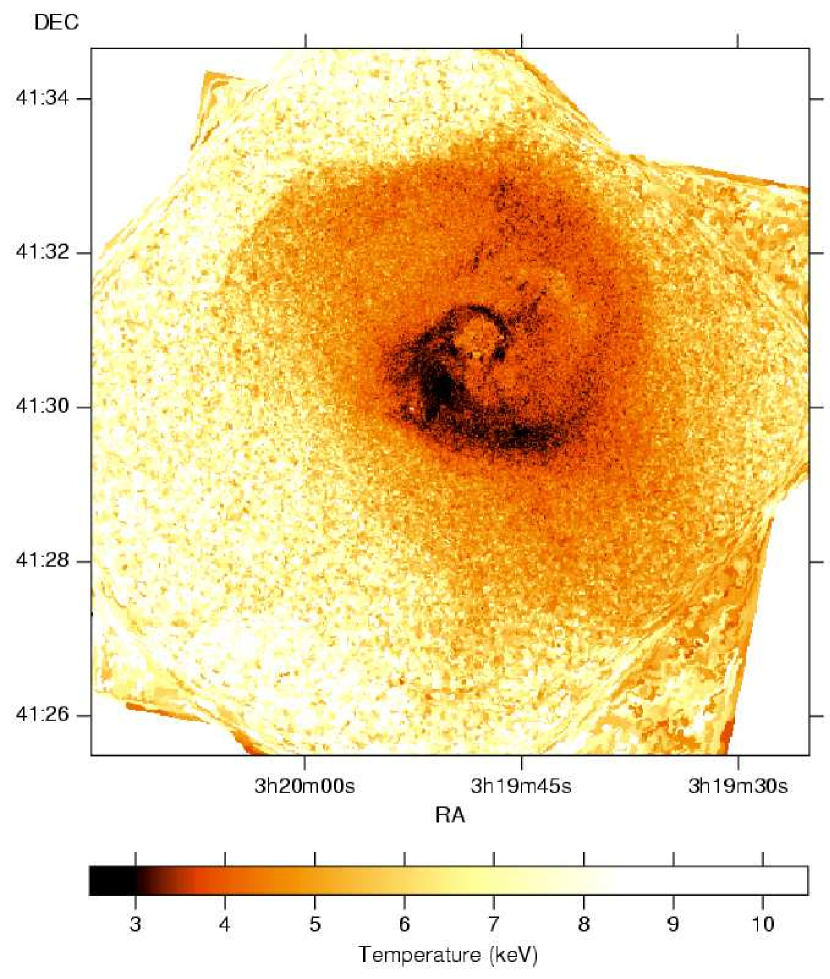
The temperature map (Fig. 4) shows in great detail the ‘swirl’ around NGC 1275 (Churazov et al 2000). Whether the swirl is really a single connected structure or an outer ring partially opened on the E and connected to the rim of the inner N bubble (Dunn et al 2005b) remains unclear. Some ‘fountaining’ can be seen to the N of this N bubble. This is associated with the N optical H filaments which are surrounded by gas at about (see Fig. 3). A disruption in the outer ring is seen to the SE of the nucleus coincident with the optical ‘blue loop’; this is discussed in Section 6.
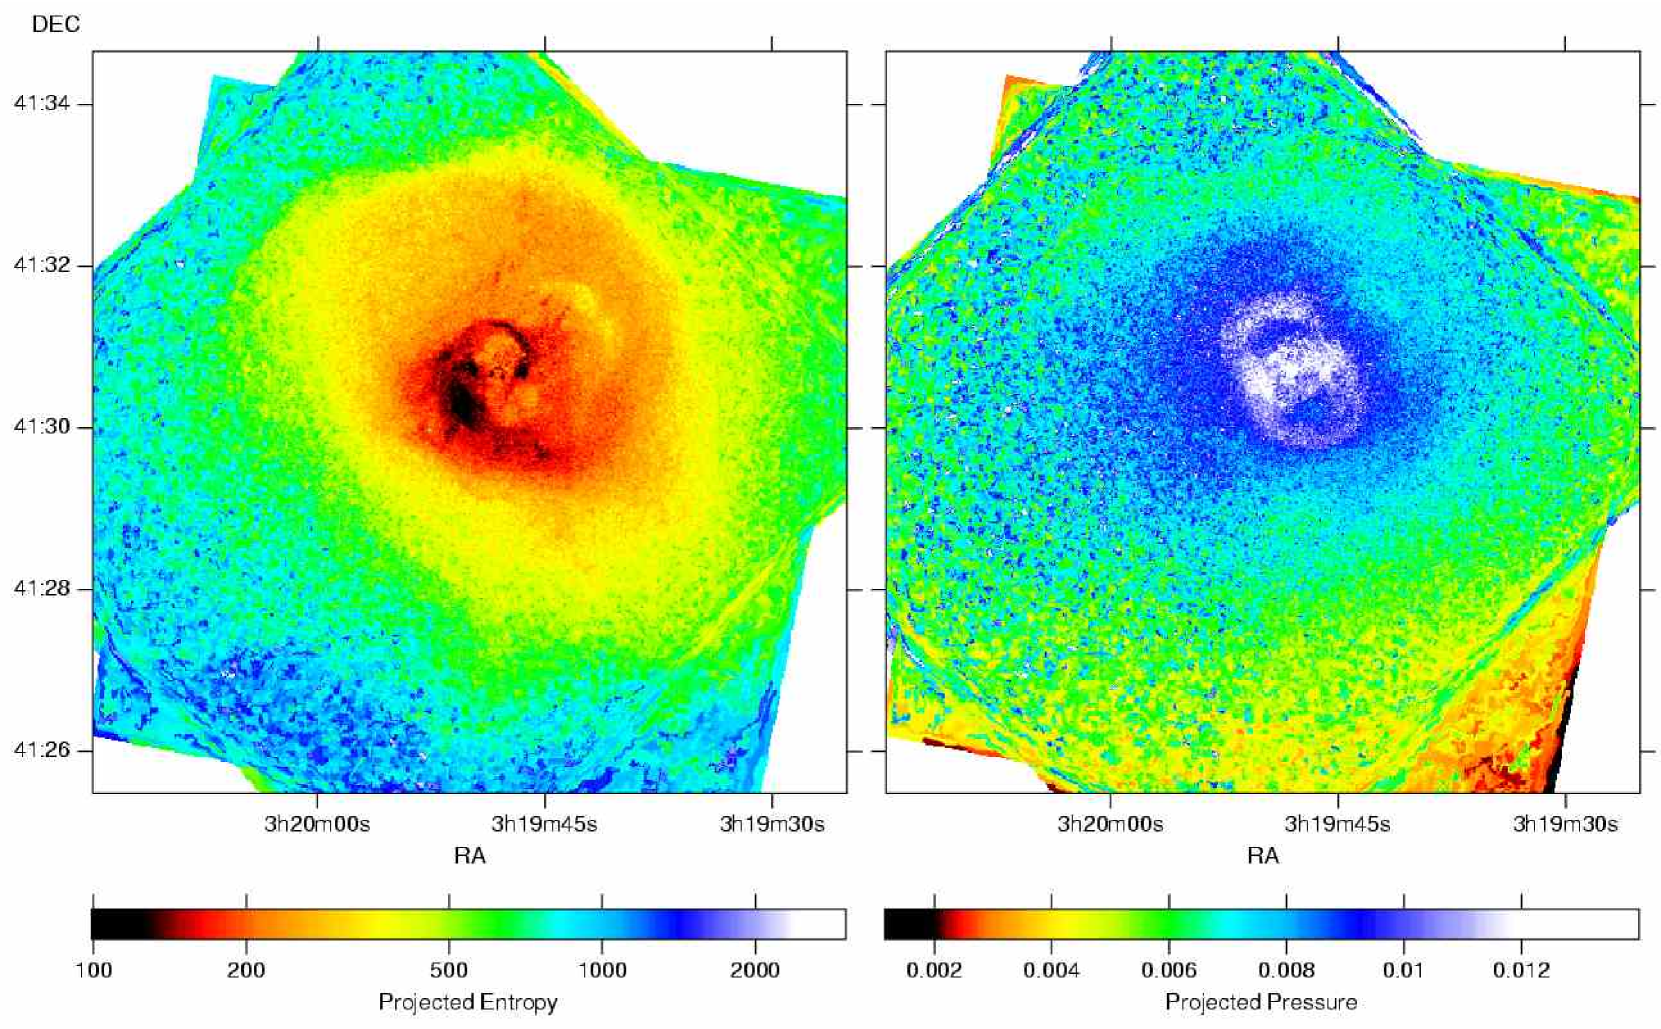
We now focus on measurements of entropy and particularly the pressure of the gas. A simple method for obtaining these quantities is to assume that the density is proportional to the square root of the X-ray surface brightness and then use and . Here we use a slightly better approach based on the emission measure, , obtained from spectral fits. This is proportional to where is the volume along the line of sight. Since the emission is strongly peaked we ignore at this stage and produced ‘projected’ entropy and pressure maps (Fig. 5).
The entropy map (Fig. 5 left) emphasises where gas may have cooled and resembles the temperature map. The pressure map (Fig. 5 right) on the other hand shows clearly a thick band around the inner radio bubbles and little sign of azimuthal asymmetry. As found by Sanders et al (2004) the pressure distribution is reasonably circularly symmetric, as expected for gas close to hydrostatic equilibrium. This is not just a consequence of our volume assumption, since we see that the ‘swirl’ in temperature has completely disappeared, as has the arc noted in Fig. 2.
A thick, higher pressure band surrounds the radio-filled cavities or bubbles (Fig. 6). This presumably is shocked gas produced by the inflation of the bubbles. It is remarkable that we see it as two mostly complete rings in the projected pressure map. This means that the two bubbles cannot lie in the plane of the Sky but must be arranged so that one is nearer us than the other. Since the nearer radio jet is the S one based on VLBI radio data, we suppose that the nearer bubble is the S one.
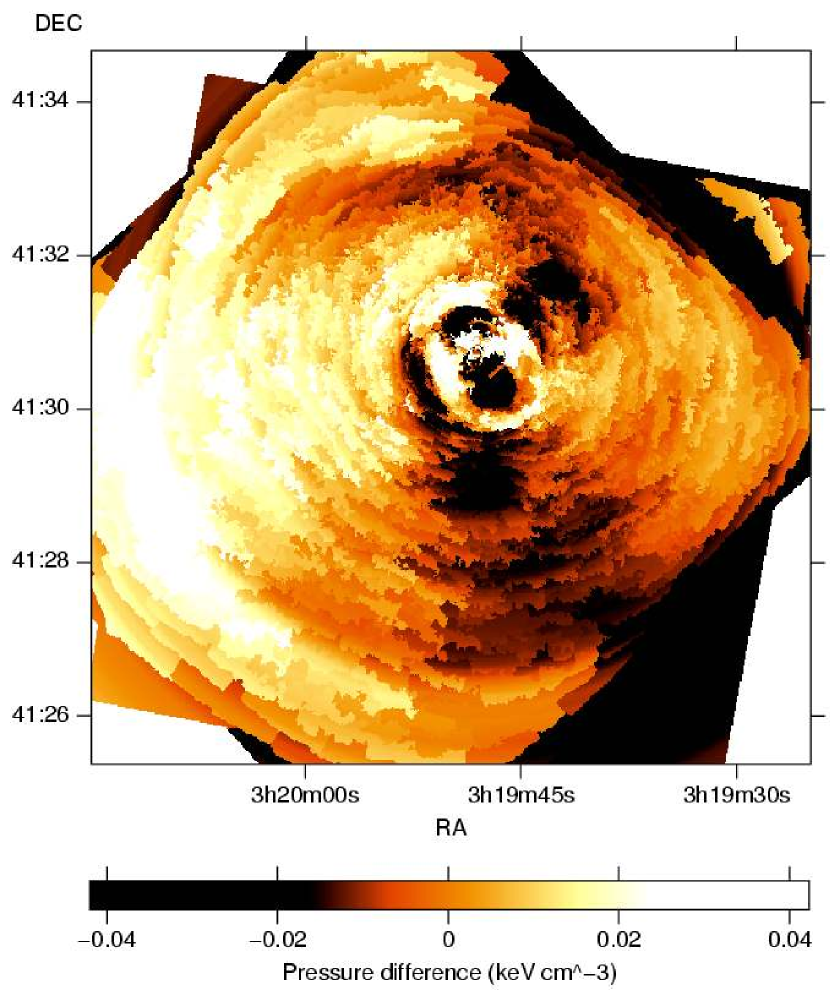
There is some azimuthal asymmetry in the pressure map, mostly associated with the bubbles. In order to see this we have subtracted the mean pressure at each radius to produce the pressure difference map (Figs 6 and 7). There are clearly some lower pressure regions to the N and S, probably associated with older, outer bubbles. The region to the SSW has a higher metallicity likely due to older bubbles dragging metal-rich gas there (Sanders et al 2005).
To the south we see two further tangential arclike pressure minima beyond the outer S bubble. These coincide with the high abundance shell reported by Sanders et al (2005). To the N we also see a large arclike pressure minimum.
We suspect that these arclike pressure minima are old bubbles. The large size of these bubbles could indicate that the activity was much stronger in the past, so blowing larger bubbles, or may just be due to bubbles merging. Surrounding gas may leak into the bubbles so making them less buoyant, or magnetic fields and structures may be important.
No pressure jump is associated with the concave structure to the S, confirming that it is part of a cold front.
4 The shock and ripples
We now discuss the detailed behaviour of the temperature, density and pressure around the shock surrounding the inner bubbles and the ripples. Sectors have been defined to the NE, E, S and NW of the nucleus and spectra extracted from bins spaced 5.4 arcsec in radius (Table 2).
| Name | Centre RA | Centre Dec | Start angle | Stop angle |
| North-east | 03:19:48.11 | +41:30:41.22 | 22.5 | 52.9 |
| East | 03:19:48.11 | +41:30:41.22 | 91 | 106 |
| South | 03:19:45.92 | +41:30:19.58 | 136.9 | 164.2 |
| North-west | 03:19:48.11 | +41:30:41.22 | 294.4 | 334.2 |
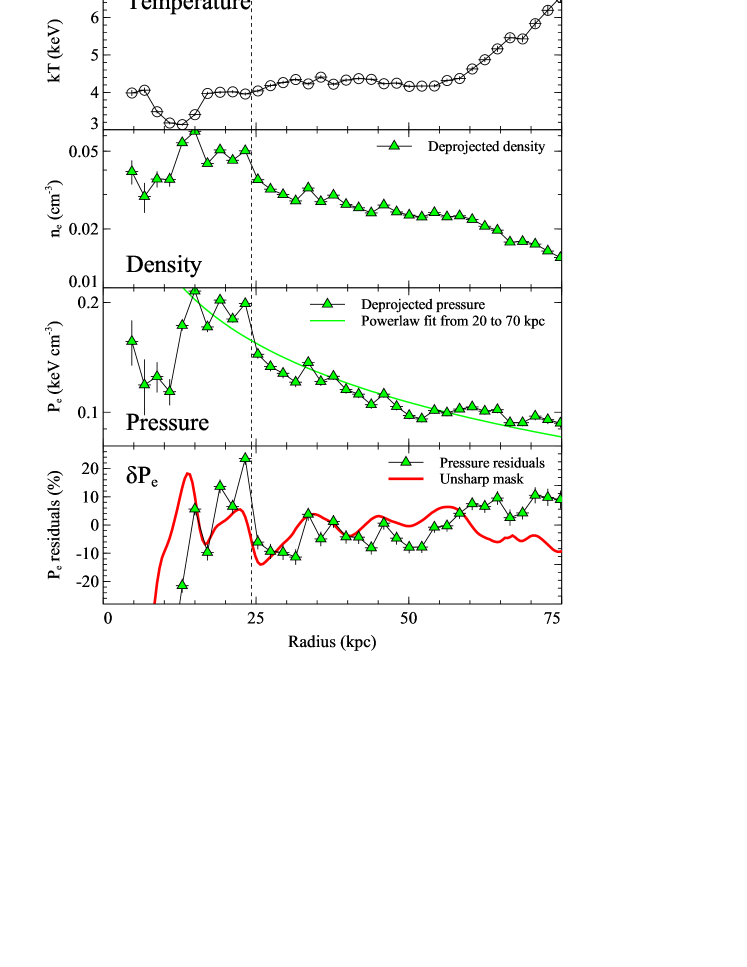
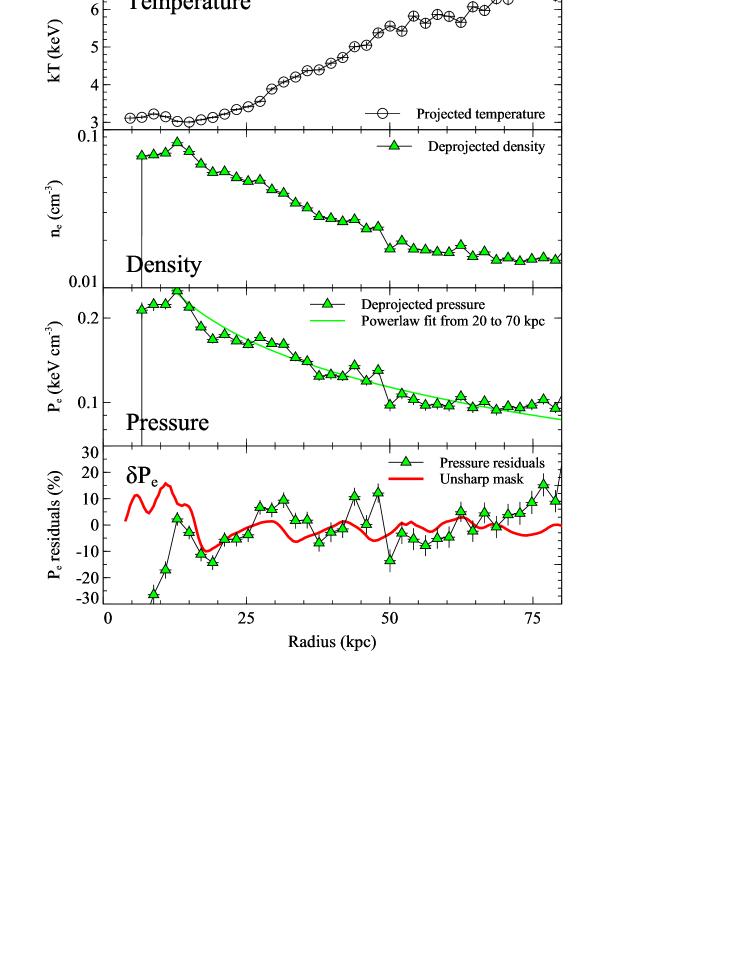
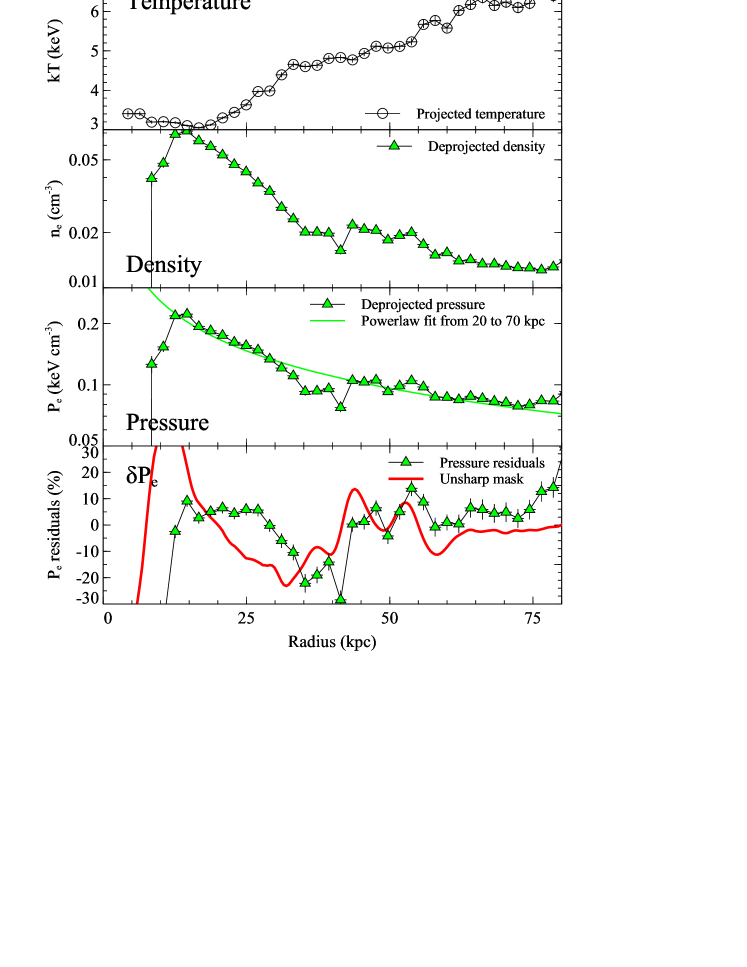
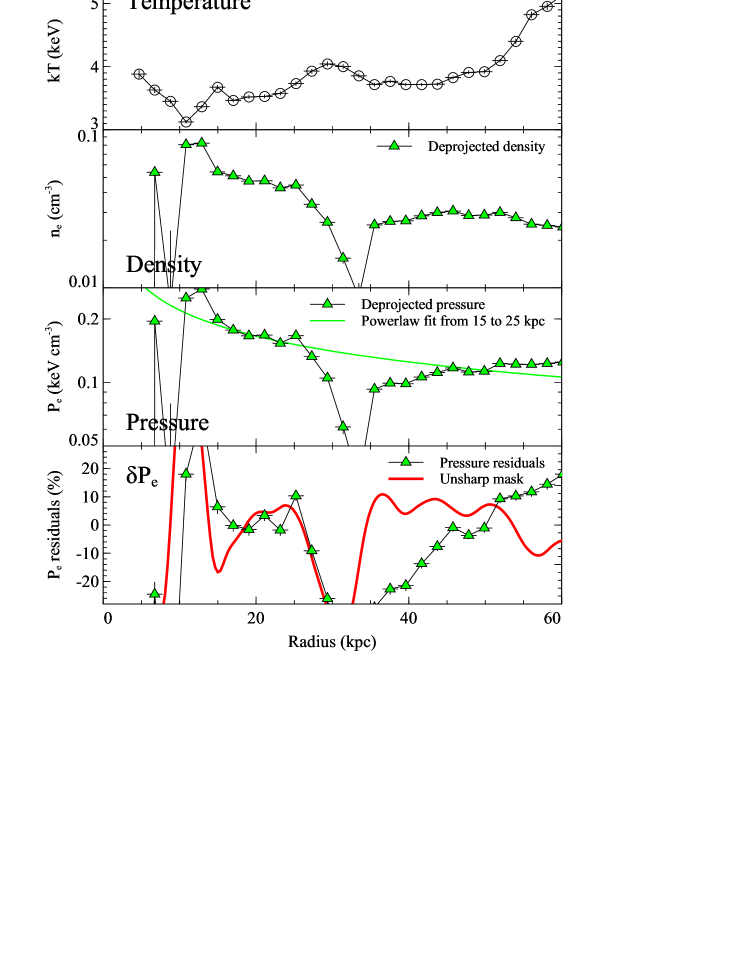
The projected temperature profiles are shown in the top panels in Fig. 8. We see generally that, apart from where the inner and ghost bubbles lie, the temperature profiles are smoothly increasing from the inside out. We have explored deprojected temperatures using the xspec projct routine but find them unstable with the temperatures depending on which bins are used. Dropping bins from either the outside or the inside can have large unpredictable effects on the results found for bins at intermediate radii. This may be due to the real geometry being obviously different from the spherical or ellipsoidal geometry assumed by the routine or to the gas being multiphase. We therefore proceed to combine the projected temperatures with approximately deprojected densities from the emission measures to obtain pressure profiles. The deprojected densities are calculated by subtracting the contribution to the fitted normalisation at each radius by that expected from outer shells, assuming projection in a spherical geometry.
The density and thus pressure profiles show variations (Fig. 8) corresponding to the ripples seen in the unsharp mask image (Fig. 2). The pressure residuals from a smooth power-law fitted from 20 to 70 kpc are shown in the lowest panel of the plots, together with the residuals predicted from the unsharp mask image. Ripples in pressure ranging from to per cent in pressure are seen out to 50 kpc or more. Such pressure variations cannot be static. They resemble sound waves so, following our earlier work (Fabian et al 2003a), we interpret them as sound waves111Or at least they operate as sound waves in a mixed thermal/relativistic plasma produced by the cyclic bubbling behaviour, or at least major expansion episodes, of the inner bubbles. In the inner region they are high pressure regions fronted by a weak shock, further out the shocks weaken and are not distinguished from the overall pressure disturbance or ripple.
A simple calculation serves to show the potential for the ripples to heat the gas provided that viscosity is high enough to dissipate their energy. Let us consider the region within 50 kpc where the ripples are most clearly seen. If the ripples move at then they cross this region in . They cause the pressure to oscillate with an amplitude of 5–10 per cent, which we conservatively take as 5 per cent of the thermal energy there. Consequently they can balance cooling provided that the cooling time (roughly for the gas to lose all its thermal energy) is 20 times the crossing time or a Gyr. This condition is well met since the cooling time of the gas at 50 kpc is 2–3 Gyr dropping to about near the centre (for the hotter gas). The waves therefore need to dissipate about half their energy by 50 kpc.
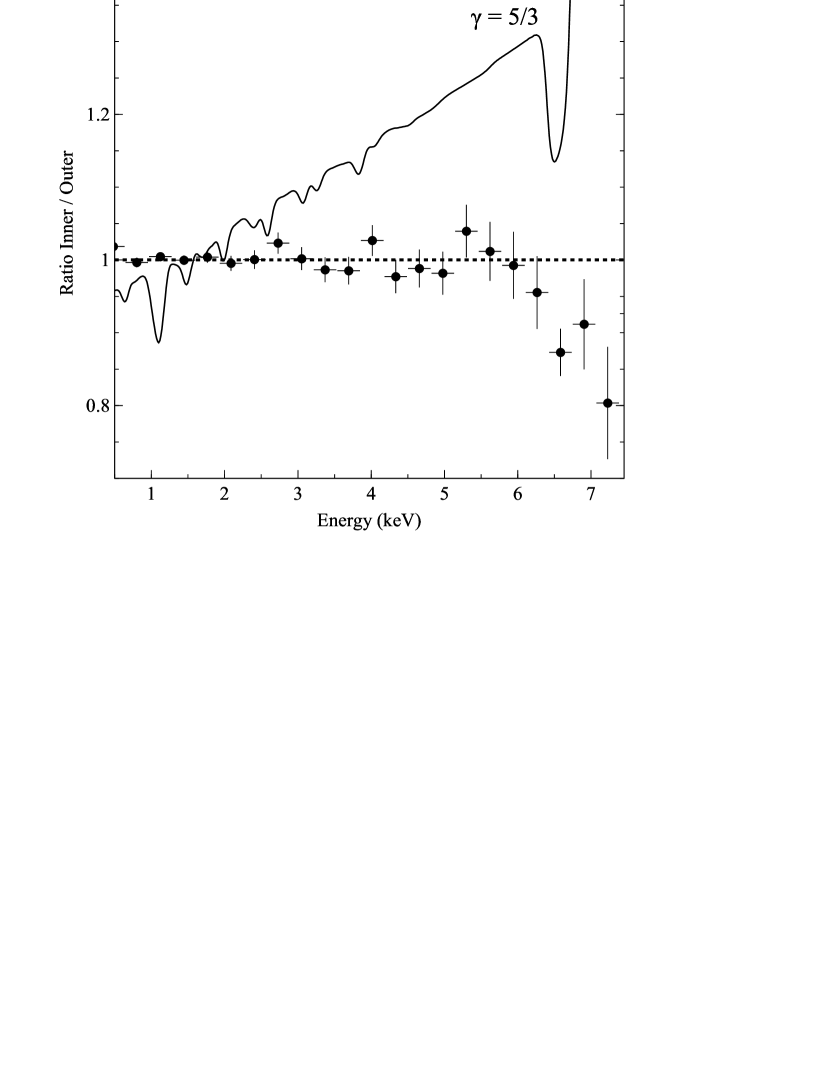
The vertical dashed line in the upper panel of Fig. 8 corresponds to the abrupt edge to the thick pressure band around the N bubble. It is most clearly seen in this direction because there is little lower energy emission superimposed upon it as appears to happen at other azimuths. Our results show it to be associated with a jump in density and this pressure and should be a shock front. However the projected temperature hardly changes, even dropping slightly postshock (Fig. 8), whereas it should rise on the basis of the factor 1.39 density jump, from 4.04 keV to about 5.1 keV if the gas is adiabatic (see also Fabian et al 2003a).
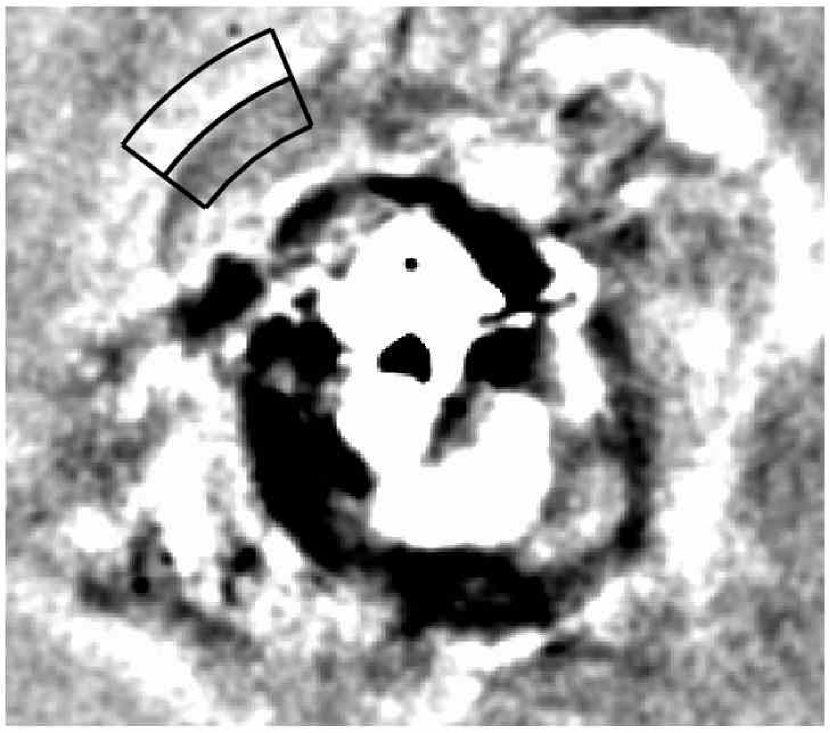
The very deep image enables us to now examine the exact temperature structure across this shock front. Because of the geometrical restrictions to any extended deprojection approach, mentioned above, we compare spectra either side of the shock. All methods, including single and two temperature, or using the outer emission as background for the inner, show no sign of any hotter temperature component within the shock in the range of 4–6 keV. The ratio of the spectra post and preshock, plotted in Fig. 9, clearly shows that the emission inside the shock is softer and inconsistent with the predicted rise, if All the spectral fits have been carried out assuming that the gas is in collisional and ionization equilibrium and homogeneous within each region.
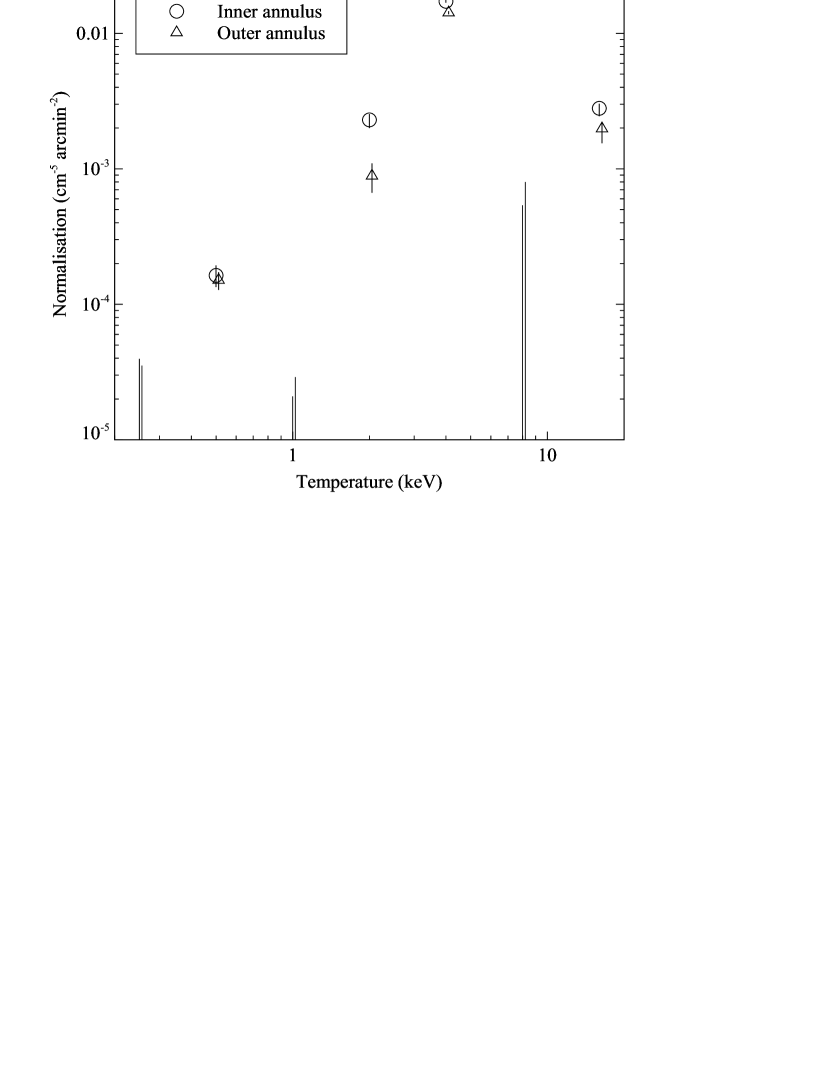
We have also carried out a multi-temperature analysis of the emission both inside and outside the shock (Fig. 10). 56 per cent of the counts per unit area across the jump going from out to inside is in an increased 4 keV component and 28 per cent in a 2 keV one. There is good evidence that the gas is multiphase. The 4 keV component, which is the volume-filling one, shows an increase of density across the shock but no increase in temperature.
The soft X-ray emission from the outer radial, N optical H filament stops abruptly at the shock front. It is possible that the 2 keV component arises from shock heating of this cooler (1 keV) gas. The pressure jump at the shock front indicates that this is a weak shock so most of the heating is just compression.
Why the 4 keV component does not change is puzzling if the gas is adiabatic; much of the heating in a weak shock is just compressional heating.
A fair approximation for the temperature behaviour expected in a shock where the density jumps by the observed factor of 1.39 (Fig. 8) from 4.04 keV is that the postshock temperature . The observed behaviour of the gas is therefore explained if the 4 keV component is isothermal with .
A simple explanation for this would be that thermal conduction is operating on this volume-filling gas phase. The electrons, moving faster than the ions, can go ahead of the shock (see e.g. Zel’dovich & Raizer 1966; Borkowski, Shull & McKee 1989). If the magnetic field in this region is mostly radial, then conduction can eliminate temperature differences on a timescale
| (1) |
which compares with the timescale for distance of matter to accumulate behind the shock (in the rest frame of that matter)
| (2) |
where is the length inside the shock in units of 3 kpc (the bins in Figs. 8 and 9 are 2 kpc apart). The full Spitzer (1956) rate for conduction is assumed here and the total postshock density is in units of the observed value of (Fig. 8), the postshock temperature (assuming an adiabatic gas) is in units of the expected one of . Magnetically-isolated blobs such as may comprise the lower temperature component are compressed adiabatically. The post-shock timescale for electron-ion equilibration is comparable to the above time (). This enhances the effect of conduction (halving it) since only the electron energy needs to be conducted ahead of the shock. We envisage that the ion temperature jumps at the shock front but that the electron temperature varies smoothly through this region, with a hotter precursor extending into the unshocked gas (see Fig. 7.19 on p519 of Zel’dovich & Raizer 1966); both the electron and ion densities jump at the shock front.
This result introduces the possibility that thermal conduction is effective in parts of the innermost regions of clusters. It has been proposed and tested as a means for heating the gas from the outside, but found to be inadequate for clusters and regions below 5 keV (Kim & Narayan 2003; Voigt & Fabian 2004). What is needed in the Perseus cluster is for thermal conduction to operate throughout much of the inner hotter volume-filling phase. The ripples would therefore be isothermal sound waves (see Fabian et al 2005 for a comment on this possibility). Both sound waves and conduction are then effective in distributing the work done by the bubbles into the surrounding gas. Repeated bubbling in the central region may have ordered the magnetic field into a roughly radial structure.
Cooler and/or cooling temperature components embedded in the hotter gas behind the shock can damp any temperature rise behind the shock if they mix with the hotter gas. The mass fraction of cooler gas required (approx 30 per cent) appears not to be high enough (see Fig. 10) for this process to be important. It remains possible that mixing takes place with larger masses of unseen cold gas which radiates much of the thermal energy in yet unseen bands.
An issue which could be very important for shock propagation in the inner intracluster medium is the presence of a relativistic plasma (cosmic rays and magnetic field) in the inner core of the Perseus cluster. This is evident here from the synchrotron emission seen as the radio ‘mini-halo’ (Pedlar et al 1990; Gitti et al 2003) and the inverse Compton emission seen as a hard X-ray flux component (Sanders et al 2005; it appears as the 16 keV component in Fig. 10). In the collisionless conditions relevant to the shock it may be possible that the relativistic plasma soaks up the energy, leaving the gas isothermal. Indeed it could be repeated shocks from the bubbles which reaccelerates the relativistic particles. They could redistribute the energy to larger radii, serving to transport some of the energy and creating a distributed heat source for the gas. We note that the electron temperature observed behind the strong shocks in young supernova remnants do not always fit expectations for simple hydrodynamical shocks, probably due to particle acceleration (Rakowski 2005 and references therein). Although promising as a mechanism, there are many uncertainties as to how it could operate and why there is no sharp rise in either the synchrotron emission seen in radio maps nor in the inverse Compton emission at the position of the shock. Moreover it does not explain how the electrons avoid compressional heating.
The isothermal nature of the inner gas raises the possibility that the bubbles expand much faster than previously suspected from observations. Initial models for the action of a central radio source on the ICM by Heinz et al (1998) predicted that the bubbles would be surrounded by shocks but Chandra showed no evidence for shock-heated gas. Efficient thermal conduction will however eliminate shock heating as a diagnostic. Consequently the bubbles may expand, at times, faster than inferred, even supersonically. The likely behaviour given the variability of radio sources is that they expand in fits and starts, with each rapid expansion phase giving rise to a sound wave. The observation from the Perseus cluster of only one set of ghost bubbles within 50 kpc radius yet 3 or more ripples allows for each bubbles to generate several ripples before becoming buoyant enough to separate and rise. This means that any estimate of bubbling power based simply on buoyancy times (e.g. Birzan et al 2004; Dunn et al 2004, 2005a) is a lower limit.
A further issue with regard to the energy injected by the bubbles is the thickness of the postshock gas. This is very similar to the radius of the bubbles, so has a volume about 7 times that of the bubbles themselves. The pressure in the shocked gas is 30 per cent above the outer unshocked gas, , (Fig. 8) so the energy content of the postshock gas is more than twice that obtained by assuming it is just where is the volume of a bubble. The work done () will be yet higher if some has been transported away by conduction or relativistic particles.
5 The multiphase nature of the gas
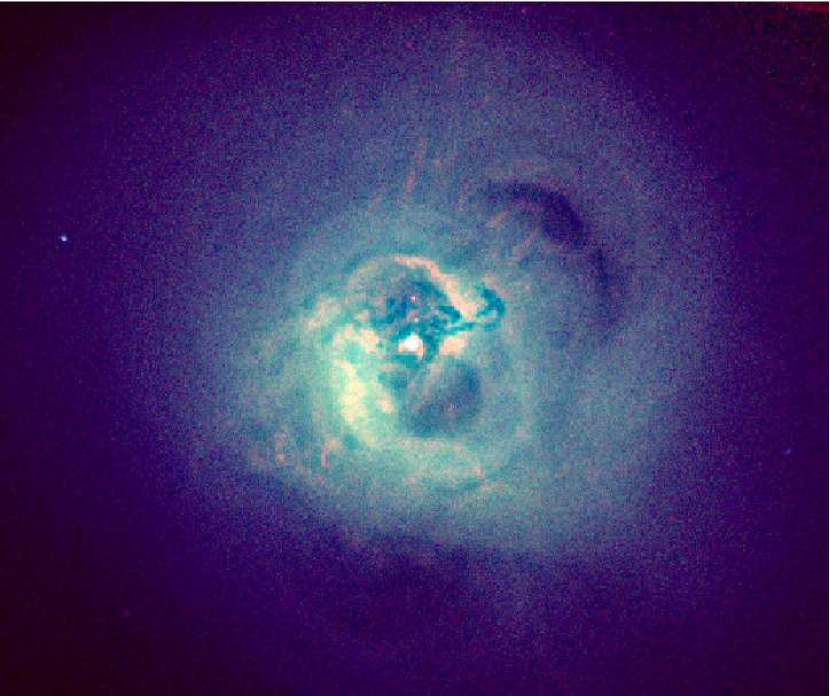
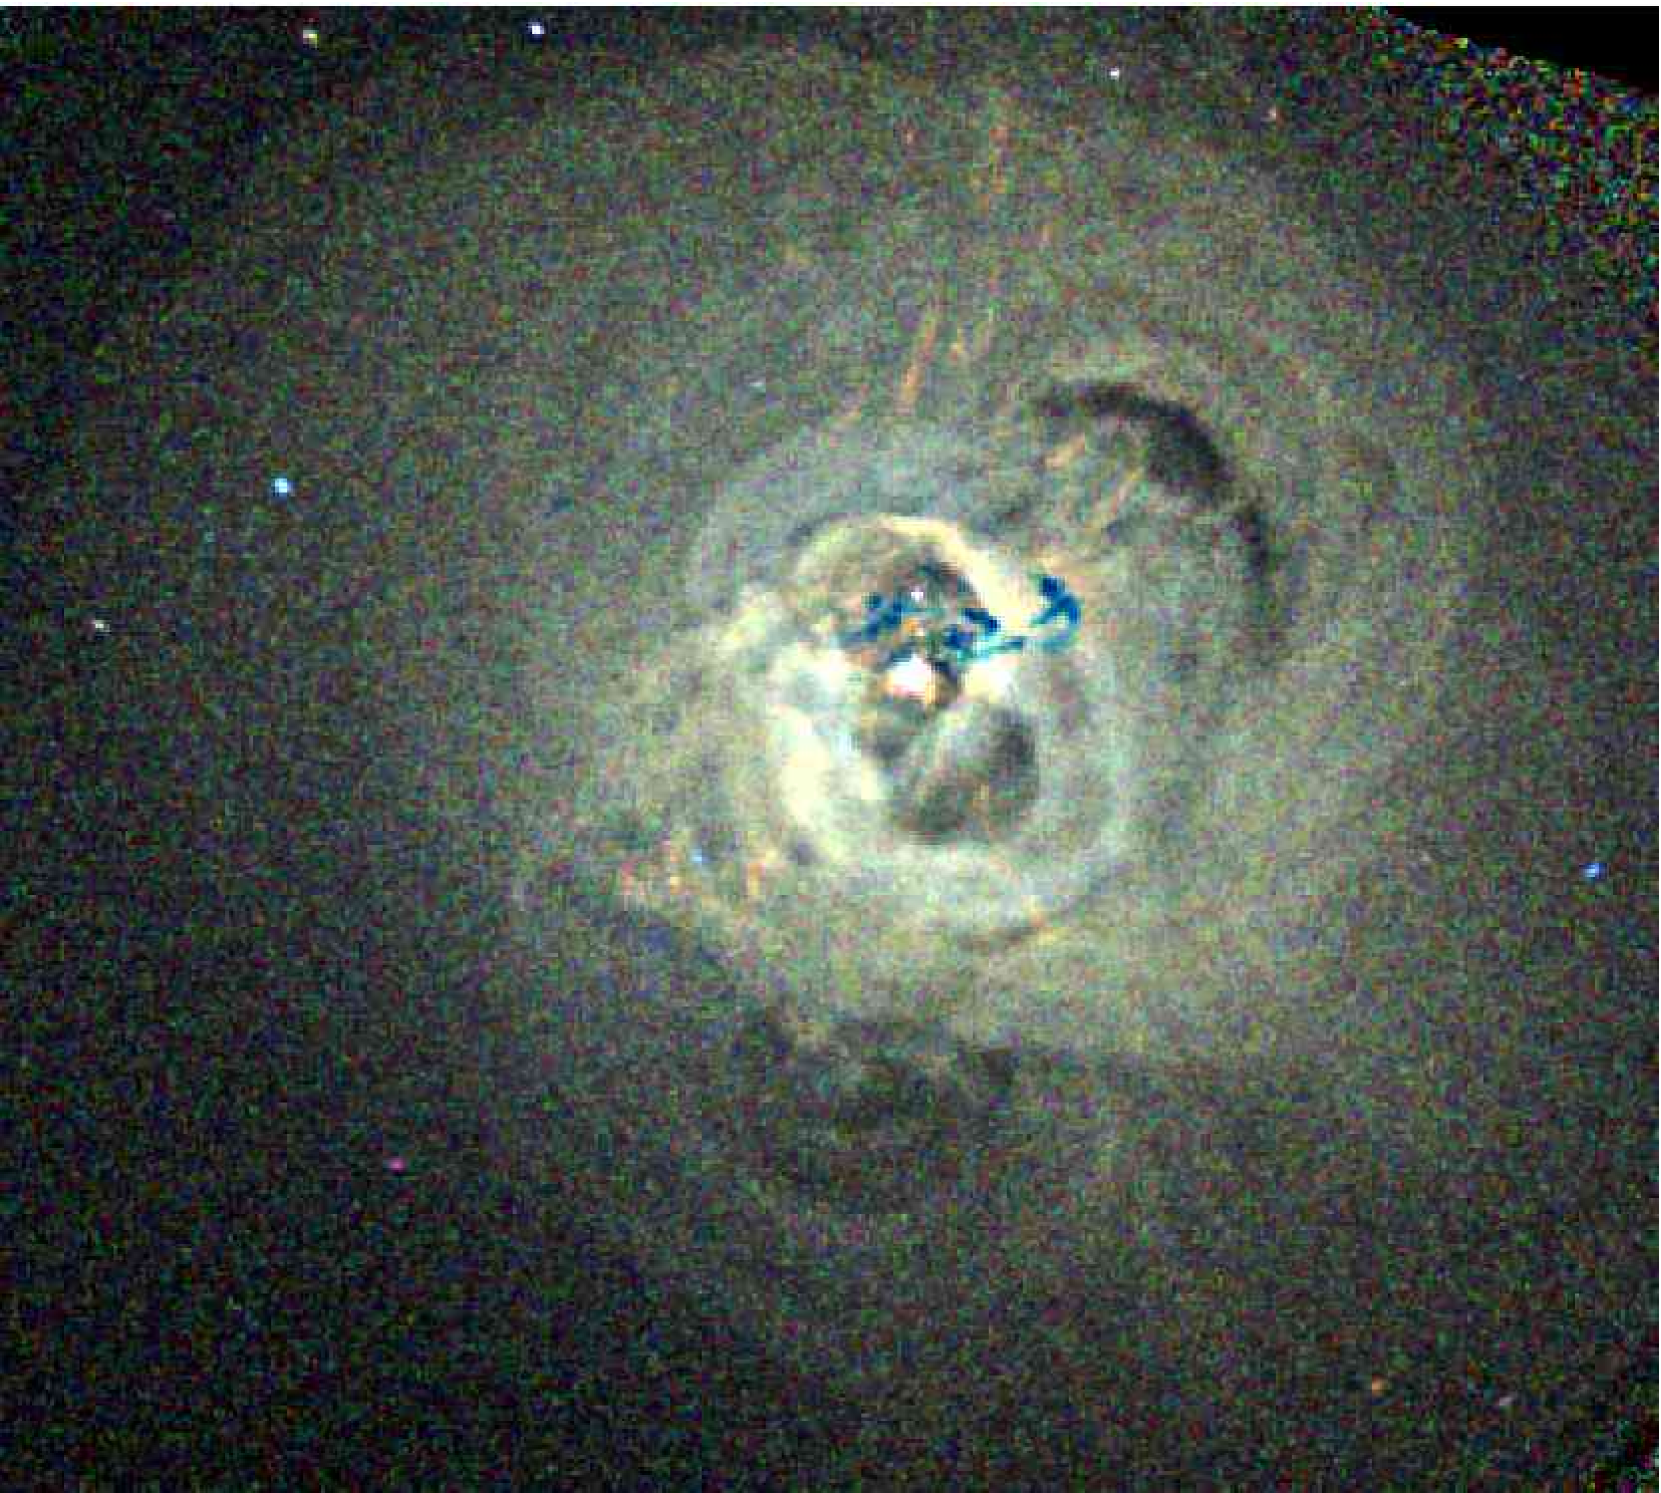
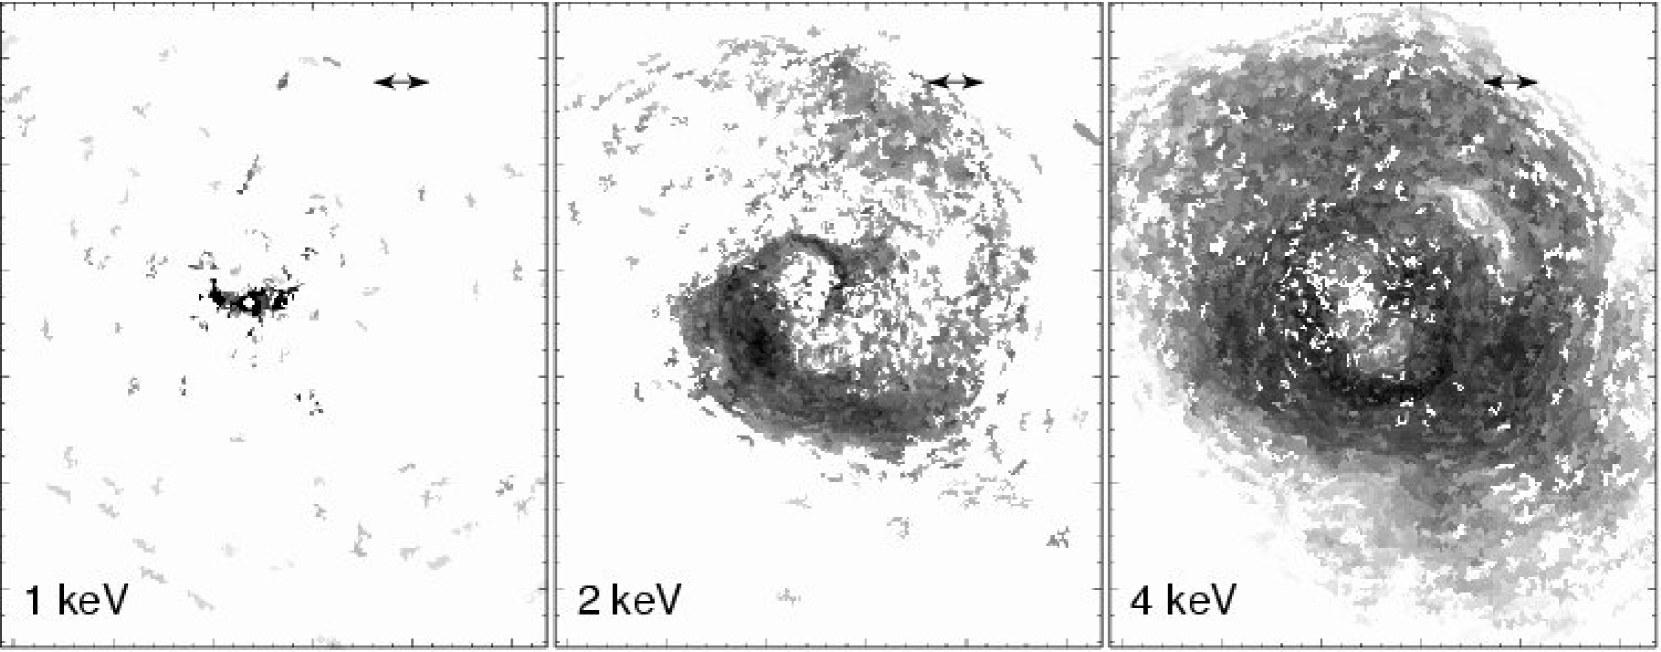
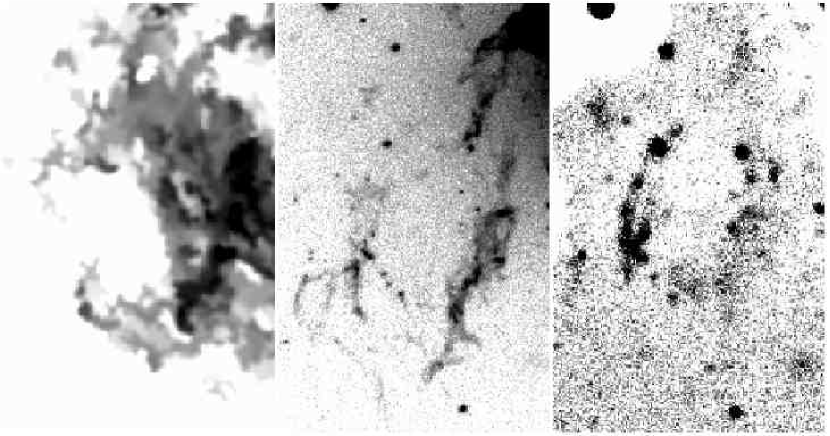
Figs. 1 and 3 clearly show filamentary soft X-ray emission which is closely associated with the optical H filaments (Fabian et al 2003b). This soft emission has a temperature of between 0.5 and 1 keV and would appear much brighter if the Galactic column density to the Perseus cluster were not as high as the observed value of . The Doppler velocities determined for the filaments are and coherent over many kpc (Hatch et al 2005b) so, given their large radial extent and likely origin as being pulled out from the centre by rising bubbles (Fabian et al 2003b), the lifetimes of the filaments are several tens million yr, or even longer. In order to survive in the surrounding hot gas they must be insulated from it or thermal evaporation would have caused them to disappear within a million yr (equation 1). Conduction must therefore be highly suppressed, by at least a factor of 100, probably due to magnetic fields along their length (conduction is suppressed perpendicular to the field direction).
As already mentioned, the filaments stop at the shock which is probably disrupting them there. The filaments coincident with the shock to the SE are probably just projected in front of the shock and are not within it. Such magnetically isolated regions need not completely vanish once they are disrupted and may survive as higher temperature blobs maintaining their isolation. The gas can therefore be multiphase, not due to a thermal cooling instability, but to the forced mixing of different components. Whether there is then slow conductive evaporation or radiative condensation (see e.g. Böhringer & Fabian 1989) or turbulent mixing (e.g. Begelman & Fabian 1990; Loewenstein & Fabian 1990) remains to be seen.
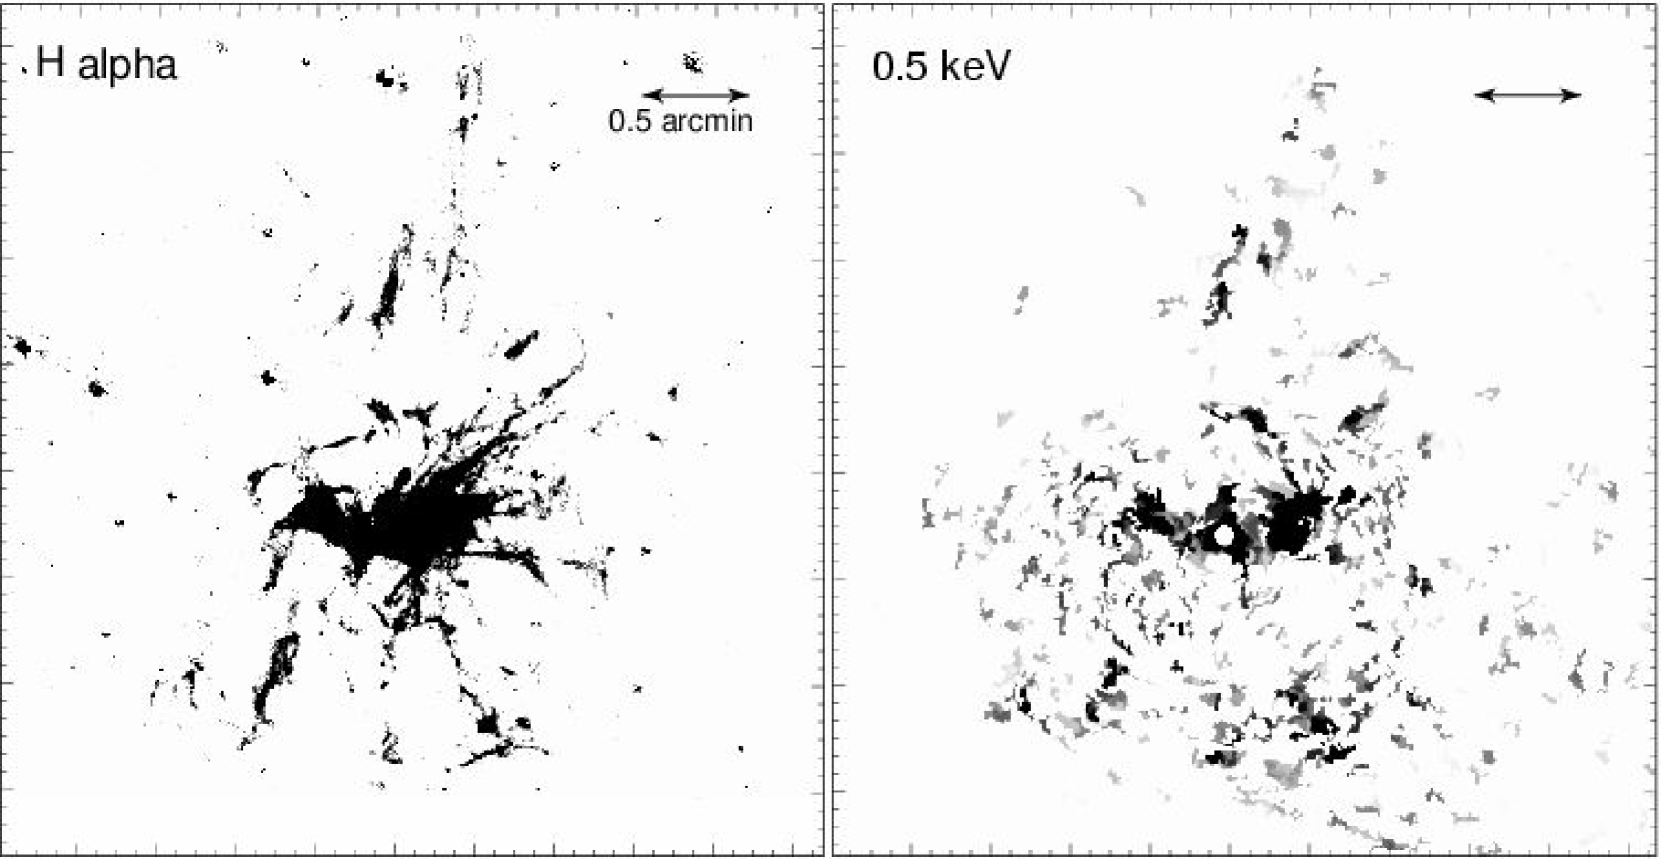
We have therefore conducted a multi-temperature determination of the gas distribution in the Perseus core. The individual spectra generated from regions chosen to contain counts or greater have been fitted with a multi-temperature model consisting of gas at 0.5, 1, 2, 4, 8 and 16 keV (see also Sanders et al 2004 for similar fits to the 200 ks data). The results have been mapped in terms of mass, determined from the emission measure divided by the density relevant for the pressure at that radius and measure temperature of the component. Of course the volume filling factor of the gas significantly different from the mean temperature found from the single temperature fits (Fig. 4) is small. The widely differing mass distributions on the Sky show that the gas is genuinely multiphase (i.e. having different temperatures at the same radius) and we are not mapping a mere projection effect.
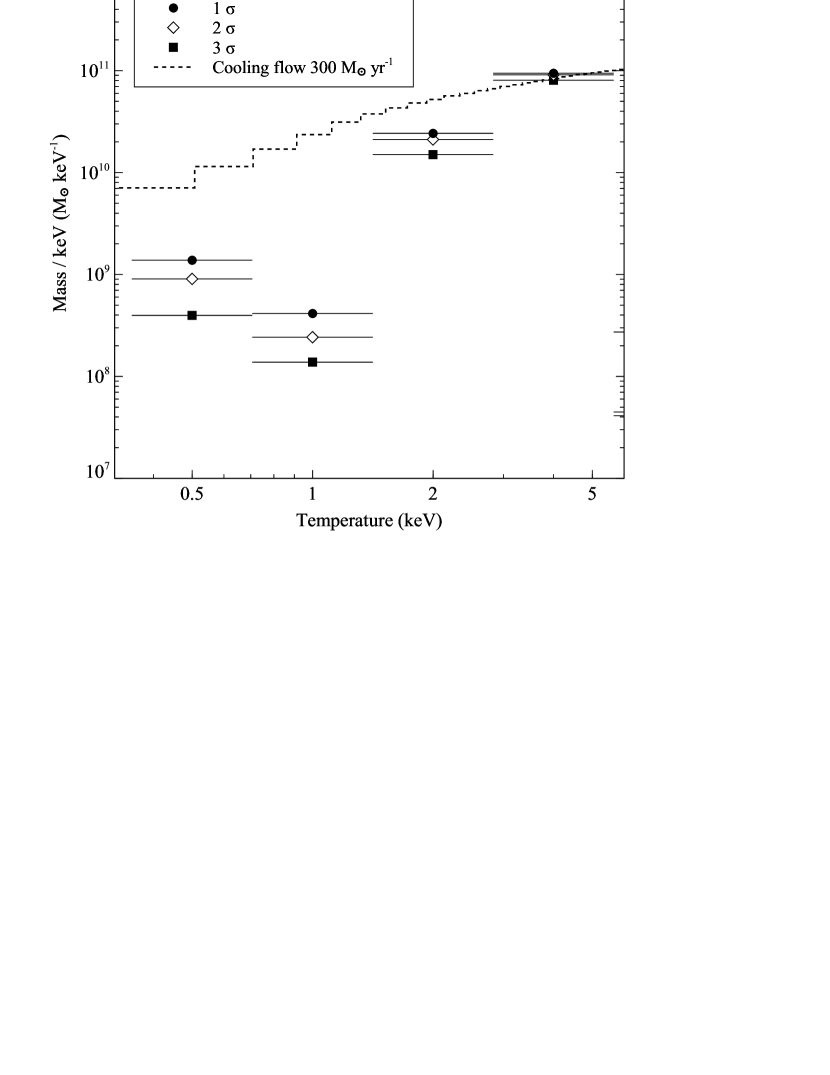
We see a striking similarity in the 0.5 keV map to the optical filaments with a total mass in the hot gas much larger than typically found from an estimate of based on the total luminosity of (Heckman et al 1989), a temperature of 5000 K for the gas and the surrounding pressure found here for the outer filaments. The continuing pressure rise to the centre will reduce this estimate and addition of molecular hydrogen, seen in the infrared (e.g. Hatch et al 2005b and references therein) will tend to increase it, so it should be a reasonable estimate. The mass maps at the various temperatures are plotted in Fig. 12 and the total mass distribution, determined from the masses within 1.5 arcmin of the nucleus, is shown in Fig. 11. The different points at each temperature show the total mass including only those which are significant to 1, 2 and 3-. Noise will be a strong contaminant to the lowest significance point. For comparison, the mass distribution expected for a steady cooling flow of is superimposed.
Interestingly, we find that there is a large drop-off in mass at 1 keV but a recovery at around 0.5 keV. This rise is of course due to the filament region. Until we know the fate of such material, in terms of whether it is being heated or cooled by radiation or mixing, we cannot say whether the bulk of the cooler gas, which lies in an E-W extended clump around the nucleus, is the residual of a cooling flow or not. We note that Bregman et al (2005) find OVI emission (characteristic of gas at ) in a 30 arcsec FUSE aperture centred on the nucleus consistent with a mass cooling rate of about . This is comparable to the rate inferred from our mass determination from gas at 0.5 keV (i.e. ), since the radiative cooling time of gas between 0.5 and 2 keV in the inner parts of the cluster is about , where is in keV. Peterson (2005; private communication) finds a limit of only from a search for FeXVII emission in XMM-Newton RGS spectra of the inner 30 arcsec radius.
The fact that we see less gas at 1 keV could be the consequence of cooling due to mixing, rather than radiation, dominating in that temperature range. Such a possibility has been discussed by Fabian et al (2002) and Soker, Blanton & Sarazin (2002). The energy of the hotter gas could in part go to heating the cooler gas at where there has long been a heating and excitation problem (Johnstone, Fabian & Nulsen 1987; Heckman et al 1989; Sabra et al 2002). Indeed a mixing solution similar to a turbulent, radiative mixing layer seems inevitable given the much lower mass in cold gas below then at 0.5 keV.
A final inter-relationship between the hotter X-ray emitting gas and the optical filaments is shown in Fig. 13. There is a partial ring structure to the SE in the temperature swirl, resembling a letter ‘C’ written backwards. It coincides with some bright optical filaments and in particularly with the ‘blue loop’, first remarked on by Sandage (1972) and seen well in many recent images (e.g. the blue band Jacobus Kapteyn Telescope, JKT, image of Fig. 12). We presume that gas in the swirl at this location collapsed and formed the stars in the astronomically recent past.
Heinz & Churazov (2005) have proposed that the relativistic component discussed in Section 4 could exist in small blobs which could help to dissipate wound waves. We see no obvious signs of small holes in the X-ray emission larger than a few 100 pc in size. How well the relativistic and thermal components are mixed is of importance for transport processes in the region.
6 Discussion
We have found that the shock seen in our 200 ks image is isothermal. The ripples seen beyond the shock are therefore likely to be isothermal waves. Their energy is then dissipated by viscosity. Conduction and sound waves can act together to dissipate and distribute the energy from the radio source, and ultimately the central massive accreting black hole. An isothermal shock allows energetic bubbling to occur at the centre without overheating the innermost region, a problem noted by Fujita & Suzaki (2005) and Mathews et al (2005).
In the work of Fujita & Suzaki (2005) it is assumed that all wave dissipation occurs at the shock front and does not include any later dissipation via viscosity as the (observed) waves propagate further. In one model they include conduction at 20 per cent of the Spitzer rate and find agreement with the shape of the temperature and density profile. However most of the energy in their model is supplied by thermal conduction from the hotter outer gas; the AGN only dominates over the region from 20–30 kpc where the shock occur. As they remark, a double heating model with the AGN heating the inner regions and conduction the outer was proposed earlier by Ruszkowski & Begelman (2002).
It is clear from the temperature profile shown in the top left panel of Fig. 8 that conduction of heat from the outer hotter gas is not important within the inner 60 kpc in the Perseus cluster, since the temperature profile is so flat. Indeed from 40–55 kpc the gradient acts in exactly the wrong direction. As discussed in Section 4, the observed ripples (which are strong sound waves or weak shocks) have more than sufficient energy to heat the inner 50 kpc and so it is not clear that any thermal conduction of heat from the outer gas is required. What our analysis has shown is that thermal conduction acting in the inner regions can account for the observed isothermal nature of the shock and so prevent the problem of an accumulation of hot shocked gas. The conduction merely acts to mediate the shock and redistribute the energy from the central AGN.
The magnetic configuration of the field in the core is crucial to the conductive behaviour. We require an approximately radial field across the shock, which is not understood. One possibility is that it arises as a consequence of cooling and compression of the inner gas in the past which leads to the frozen-in magnetic field being predominately radial (Soker & Sarazin 1990). Nearby we have low temperature H emitting filaments which must be many 10s million yr old and so magnetically isolated. We also find evidence for multi-temperature, presumably multiphase, gas. The magnetic connectedness is crucial to how the gas behaves. It raises the possibility that the swirl seen in the temperature and entropy maps is magnetically separate from the rest of the gas. Perhaps it is a fossil from the merger of a galaxy with NGC 1275 where the incoming (less massive) galaxy ‘combed’ the field into the apparent swirl. The 2 keV gas immediately around the rim of the N inner bubble is presumably protected from evaporation by a tangential field there. Such speculation may eventually be testable when it is possible with the Expanded Very Large Array to carry out Faraday Rotation studies in this region at higher frequencies and greater sensitivity than currently feasible. Preliminary indications from high resolution studies of the nucleus with the Very Long Baseline Array indicate fairly extreme Rotation Measures of up to 7000 radian m2 (Taylor et al. 2005, in preparation).
We have also found a roughly N-S channel in the pressure difference map which demonstrates the passage of a sequence of radio bubbles. The outer ones are large and could be where they accumulate or just represent a past, more energetic, period of activity. We also see part of an unusual cold front to the S. This region is seen clearly in the unsharp mask images (Fig. 2) and in one generated from data from all chips (Fig. 13). This structure appears to be connected to a region to the SW of the nucleus where the channel appears. It could represent gas associated with subcluster merging in the cluster. Most likely given the relationship with the bubble channel, the gas could be evidence of past energetic bubbles. The bubble channel is good evidence that the bubbles are not easily disrupted, presumably due to the magnetic structure (De Young et al 2003) and/or viscosity in the surrounding gas (Reynolds et al 2005). We assume that the pressure dips in the channel because there is unseen buoyant relativistic plasma there from the radio outbursts.
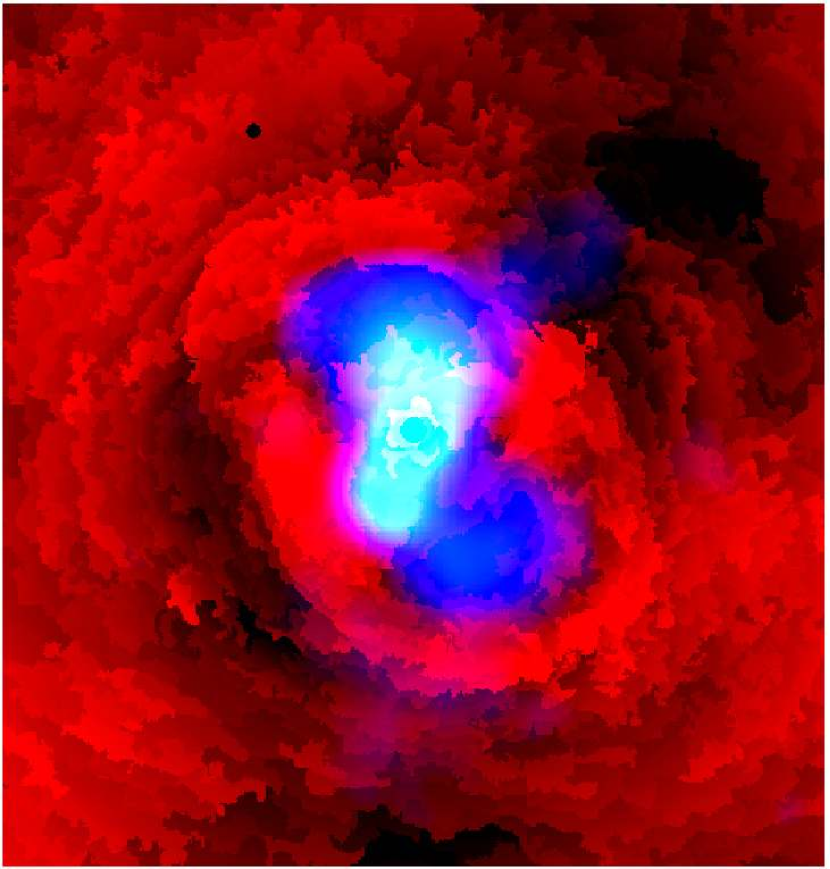
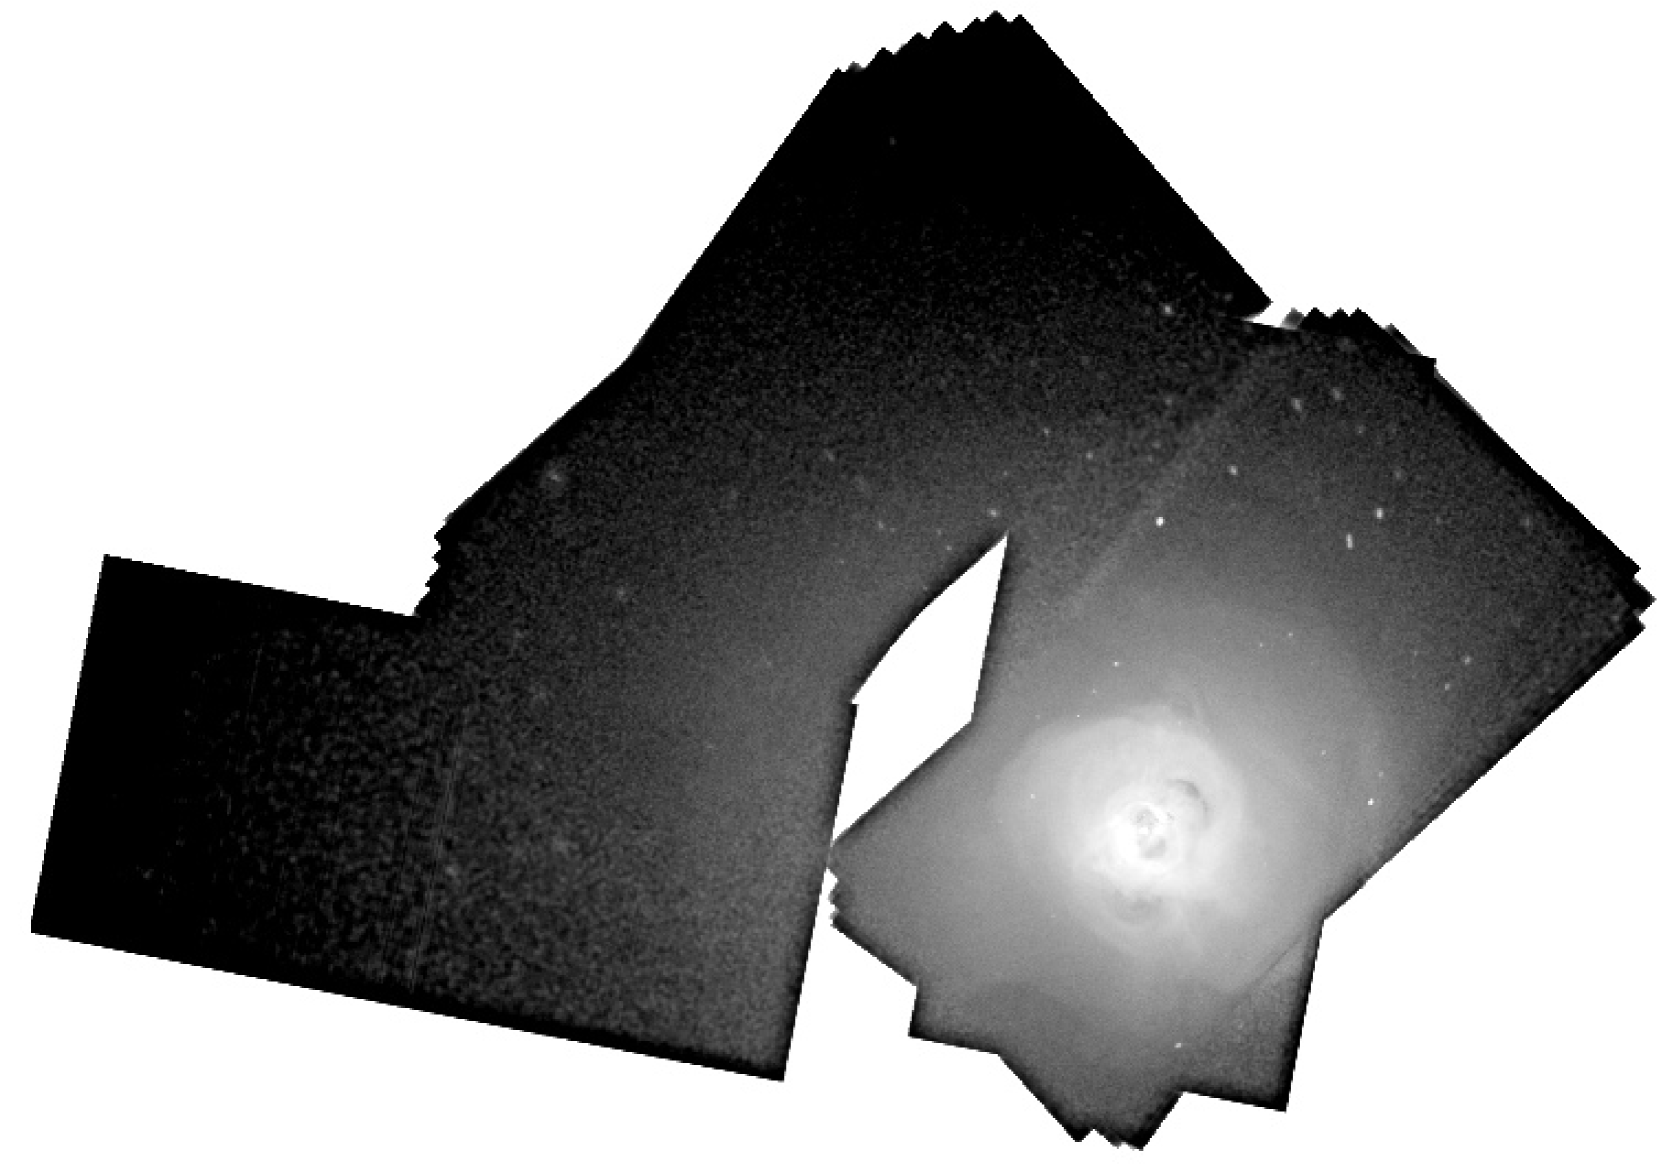
An overall picture of the region is shown in the image of Fig. 14, where data from all chips has been used. The structure of the inner regions can be seen together with the outer S bay, embedded within the more extended peak of cluster X-ray emission. The upper part of the H fountain (Fig. 2) can also be more clearly seen.
7 Summary
Using a very deep, 900 ks Chandra image of the core of the Perseus cluster, we have found new outer features 50–80 kpc from the nucleus and measured the detailed properties of gas near the centre. The features are in the form of a concave cold front and baylike region of hot gas which is in approximate pressure equilibrium. This could be the result of an energetic past outburst from the nucleus, or where bubbles accumulate.
The inner radio bubbles are surrounded by complete higher pressure bands of gas behind a sharp front. The gas temperature does not change across the shock front, probably indicating that thermal conduction operates efficiently there, or that co-existing relativistic plasma mediates the shock. Pressure variations coincident with ripples previously found in unsharp mask images reveal the presence of isothermal sound waves. The isothermal nature of the innermost gas means that a simple temperature estimate there does not reveal the expansion velocity of the bubbles. We suspect that they expand in rapid steps associated with outbursts of activity from the central radio source. Provided that the energy in the ripples is dissipated by viscosity, then the present heating rate in the ripples is sufficient to balance radiative cooling. Larger pressure variations are seen along a N-S channel, suggesting a sequence of bubbles, revealing the activity of the central radio source for the past .
The gas in the centre is significantly multiphase with a large mass of gas () associated with the optical H filamentary nebula, with ten times more mass in 0.5 keV gas than that radiating the optical emission lines. Mixing is likely occurring between the hot ICM and the cold filamentary gas, with much radiative cooling probably taking place below .
Cluster cores are complicated with the behaviour dependent on the bubbling of a central radio source and on microphysical transport processes. These in turn depend on the magnetic field structure, which itself may be a consequence of past cooling and bubbling.
8 Acknowledgements
We thank the referee (Y. Fujita) for comments. CSC and ACF thank the Royal Society for support. GBT acknowledges support for this work from the National Aeronautics and Space Administration through Chandra Award Number GO4-5134X issued by the Chandra X-ray Observatory Center, which is operated by the Smithsonian Astrophysical Observatory on behalf of the National Aeronautics and Space Administration under contract NAS8-03060. The work of SWA is supported in part by the U.S. Department of Energy under contract number DE-AC02-76SF00515.
References
- [] Arnaud K.A., 1996, Astronomical Data Analysis Software and Systems V, eds. Jacoby G. and Barnes J., p17, ASP Conf. Series volume 101
- [] Anders E., Grevesse N., 1989, Geochimica et Cosmochimica Acta 53, 197
- [] Begelman M.C., Fabian A.C., 1990, MNRAS, 244 26P
- [] Birzan, L., Rafferty, D. A., McNamara, B. R., Wise, M. W., Nulsen P. E. J. 2004, ApJ 607, 800
- [] Böhringer H, Fabian AC, 1989, MNRAS, 237, 1147
- [] Böhringer H., Voges, W., Fabian, A. C., Edge, A. C. and Neumann, D. M., 1993, MNRAS, 264, 25
- [] Borkowski KJ, Shull, M, McKee CF., 1989, ApJ, 336, 979
- [] Bregman, J.D., Fabian A.C., Miller D.D., Irwin J.A., 2005, ApJ submitted
- [] Churazov E., Forman, W., Jones, C., and Böhringer, H., 2000, A&A, 356, 788
- [] Conselice C.J., Gallagher J.S., Wyse R.F.G., 2001, ApJ, 559, 791
- [] Dunn RJH, Fabian, A. C., 2004, MNRAS, 355, 862
- [] Dunn RJH, Fabian, A. C., Taylor GB., 2005a, MNRAS in press (astro-ph/0510191)
- [] Dunn RJH, Fabian, A. C., Sanders JS., 2005b, MNRAS submitted
- [] Fabian A.C., Celotti A., Blundell K.M., Kassim N.E., Perley R.A., 2002, MNRAS, 331, 369
- [] Fabian AC., Sanders, J.S., Allen, S.W., Crawford, C.S., Iwasawa, K., Johnstone, R.M., Schmidt, R.W., and Taylor, G.B., 2003(a), MNRAS, 344L, 43F
- [] Fabian AC., Sanders, J.S., Crawford, C.S., Conselice, C.J., Gallagher, J.S., and Wyse, R.F.G., 2003(b), MNRAS, 344L, 48
- [] Fabian, A. C., Sanders, J. S., Ettori, S., Taylor, G. B., Allen, S. W., Crawford, C. S., Iwasawa, K., Johnstone, R. M. and Ogle, P. M., 2000, MNRAS 318, L65
- [] Fabian AC., Reynolds CS., Taylor GB., Dunn RJH., 2005, MNRAS, 363, 891
- [] Fabian AC, Allen SW, Crawford CS, Johnstone RM, MOrris GM, Sanders JS, Schmidt RG., 2002, MNRAS, 332, L50
- [] Forman W. et al 2003, astro-ph/0312576
- [] Fujita Y., Suzuki TK., 2005, ApJ, 630, L1
- [] Gillmon K., Sanders J.S., Fabian A.C., 2004, MNRAS, 348, 159
- [] Gitti M, Brunetti G, Setti G., 2002, A&A, 386, 456
- [] Hatch NA, Crawford CS, Fabian AC, Johnstone RM., 2005a, MNRAS, 358, 765
- [] Hatch NA., Crawford CS, Johnstone RM., Fabian AC., 2005b, MNRAS, submitted
- [] Heckman TM., Baum SA., van Breugel WJH., McCarthy P., 1989, ApJ, 338, 48
- [] Heinz S., Reynolds CS., Begelman MC., ApJ, 1998, 501, 126
- [] Heinz S, Churazov E, 2005 astro-ph/0507038
- [] Johnstone R.M., Fabian A.C., Nulsen P.E.J., 1987, MNRAS, 224, 75
- [] Kim W-T., Narayan R., 2003, ApJ, 596, L139
- [1] Liedahl D.A., Osterheld A.L., Goldstein W.H., 1995, ApJ, 438, L115
- [] Loewenstein M., Fabian AC., 1990, MNRAS, 242, 120
- [] Mathews, W.G., Faltenbacher, A., Brighenti, F., 2005, ApJ, in press (astro-ph/0511151)
- [] Markevitch M., et al 2000, ApJ, 541, 542
- [] McNamara B R., Nulsen, P. E. J., Wise, M. W., Rafferty, D. A., Carilli, C., Sarazin, C. L. and Blanton, E. L., 2005, Nature, 433, 45
- [2] Mewe R., Gronenschild E.H.B.M., van den Oord G.H.J., 1985, A&AS, 62, 197
- [] Pedlar A., Ghataure HS., Davies RD., Harrison BA., Perley R., Crane PC., Unger SW., 1990, MNRAS, 246, 477
- [] Rakowski C., 2005, Adv Space Res., 35, 1017
- [] Reynolds., McKernan, B., Fabian, A.C., Stone J.M., and Vernaleo,J.C., 2004, MNRAS,
- [] Ruszkowski M., Begelman M.C., 2002, ApJ, 581, 223
- [] Ruszkowski M., Brüggen M., Begelman M.C., 2004a, ApJ, 611,158
- [] Ruszkowski M., Brüggen M., Begelman M.C., 2004b, ApJ, 615,675
- [] Ruszkowski M., Brüggen M., Hallman E.,, 2005, astro-ph/0501175
- [] Sabra BM., Shields JC., Filippenko AV., 2000, ApJ, 545, 157
- [] Sandage A.R., 1972, in Nuclei of Galaxies, ed O’Connell
- [] Sanders J.S., Fabian A.C., Allen S.W., Schmidt R.W., 2004, MNRAS, 349, 952
- [] Sanders J.S., Fabian A.C., Dunn R.J.H., 2005, MNRAS, 360, 133
- [] Schmidt R W., Fabian AC., Sanders JS., 2002, MNRAS, 337, 71
- [] Soker N., Blanton, E.L., Sarazin C. L., 2004, A&A, 422, 445
- [] Soker N., Sarazin C. L., 1990, ApJ, 348, 73
- [] Spitzer L., 1956, Physics of Fully Ionized Gases, 1st Ed., New York: Wiley-Interscience
- [] Townsley L.K., Broos P.S., Chartas G., Moskalenko E., Nousek J.A., Pavolv G.G., 2002, Nuc. Instr. and Meth. in Phys. Res. A, 486, 716
- [] Townsley L.K., Broos P.S., Nousek J.A., Garmire G.P., 2002, Nuc. Instr. and Meth. in Phys. Res. A, 486, 751
- [] Voigt LM Fabian AC., 2004, MNRAS, 347, 1130
- [] Zel’dovich Y.B., Raizer Y.P., 1966, Physics of Shock Waves and High-Temperature Hydrodynamic Phenomena, Academic Press, New York