Discovery of an Optically-Faint Quasar at and
Implications for the Faint End of the Quasar Luminosity Function
Abstract
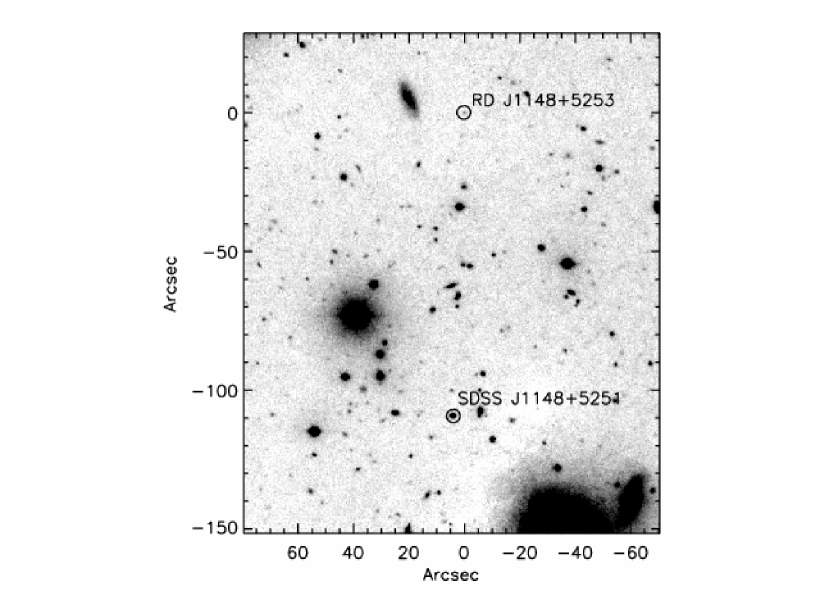
We present observations of an optically-faint quasar, RD J114816.2+525339 (hereafter RD J1148+5253), discovered from deep multi-color observations of the field around the quasar SDSS J1148+5251. The two quasars have a projected separation of 109″ and both are outliers in versus color-color space. Keck spectroscopy reveals RD J1148+5253 to be a broad-absorption line quasar at . With , RD J1148+5253 is 3.3 mag fainter than SDSS J1148+5251, making it the faintest quasar known at . This object was identified in a survey of square degrees. The implied surface density of quasars at these redshifts and luminosities is broadly consistent with previous extrapolations of the faint end of the quasar luminosity function and supports the idea that active galaxies provide only a minor component of the reionizing ultraviolet flux at these redshifts.
1 Introduction
The increasing optical depth of the Ly forest in high-redshift quasars provided the first evidence that the cosmic reionization epoch concluded at , approximately 1 Gyr after the Big Bang (Djorgovski et al. 2001; Becker et al. 2001). While active galaxies no longer appear to be significant contributors to the reionization of the intergalactic medium (e.g., Yan & Windhorst 2004), quasars still provide essential probes of the ionization state of the universe, as well as probes of the earliest stages of galaxy formation. For example, the sizes of H II regions around the highest redshift quasars provide strong constraints on the cosmic neutral fraction at early epoch (Wyithe & Loeb 2004; Mesinger & Haiman 2004). Probing the faint end of the quasar luminosity function is also important for understanding the interplay between the formation of galaxies and the formation of supermassive black holes.
The Sloan Digital Sky Survey (SDSS) has found many luminous () quasars at high () redshifts (Fan et al. 2001, 2003) and determined the evolution of the bright end of the quasar luminosity function (Fan et al. 2004). Others, such as Wolf et al. (2003) and Hunt et al. (2004), have studied the faint end of the quasar luminosity function at lower redshifts (). In terms of faint quasars at high redshifts (), few sources have been reported. Djorgovski et al. (2003) reported a quasar slightly fainter than the SDSS limits (; ) and within a few Mpc of the quasar SDSS 0338+0021. Stern et al. (2000) identified a single faint (; ) quasar in a small-area survey designed to find high-redshift Lyman-break galaxies. Interestingly, this source is well detected at 1.2 mm by MAMBO, implying a far-infrared luminosity , comparable to the average luminosity of high-redshift SDSS quasars which are an 3 magnitudes more luminous at optical wavelengths (Bertoldi & Cox 2002; Staguhn et al. 2005). Barger et al. (2002) identified an X-ray selected faint () quasar in the Chandra Deep Field - North. Searches for additional AGN at these high redshifts in the combined Chandra Deep Fields by Barger et al. (2003) and Cristiani et al. (2004) have yielded negative results. Recently, there have been a few concerted observational programs to map large areas of sky to faint magnitudes, with the goal of identifying high-redshift, low-luminosity quasars: Sharp et al. (2004) reports on mapping of 1.8 of sky, going approximately 2 mag fainter than the SDSS, while Willott et al. (2005) reports on mapping of 3.8 of sky, going approximately 3 mag fainter than the SDSS. To date, neither survey has identified any new, high-redshift quasars.
In this Letter we report on early results of a wide-area, multiband program to identify faint, high-redshift quasars. Using the Palomar and Keck observatories, we have obtained images of approximately 2.5 , going approximately 3 mag fainter than the SDSS. For portions of our survey, we have also obtained near-infrared imaging. With the goal of identifying large-scale structure in the early universe (cf., Djorgovski et al. 2003; Stiavelli et al. 2005), while still being sensitive to unassociated, high-redshift sources, we have primarily imaged high-redshift SDSS quasar fields. Detailed results from this study will be presented elsewhere (Bogosavljević et al., in preparation); here we present observations of a faint quasar at found in the field of the highest redshift quasar currently known, SDSS J1148+5251 at (Fan et al. 2003). Throughout we adopt a -cosmology with and . At , such a universe is 1.05 Gyr old, the lookback time is 92.7% of the total age of the universe, and an angular size of 10 corresponds to 6.3 kpc.
2 Observations
We obtained images of the SDSS J1148+5251 field in the - and -bands using the Low Resolution Imaging Spectrometer (LRIS; Oke et al. 1995) at the 10-meter Keck-I telescope on UT 2003 April 6, and in the -band using the Wide-Field Infrared Camera (WIRC; Wilson et al. 2003) at the Palomar 200-inch Hale telescope on UT 2003 May 22. The total exposure times were 300, 1000, and 3600 seconds in the -, -, and -bands, respectively. LRIS has a 5′ 7′ field-of-view, while WIRC has a 8.7′ 8.7′ field-of-view.
The images were reduced using standard procedures. The seeing FWHM is 12 in the processed optical images and 09 in the processed -band image. As conditions were not photometric for either imaging nights, we estimated the calibrations by comparison with the SDSS (for the optical data; AB magnitudes) and the Two Micron All Sky Survey (for the near-infrared data; Vega magnitudes). Due to a relatively large scatter in the SDSS cross-matching, likely due to differences between the SDSS and Keck/LRIS filter transmission functions, we estimate 0.3 magnitude uncertainties in the optical photometry. This level of photometric accuracy is more than sufficient for our purposes.
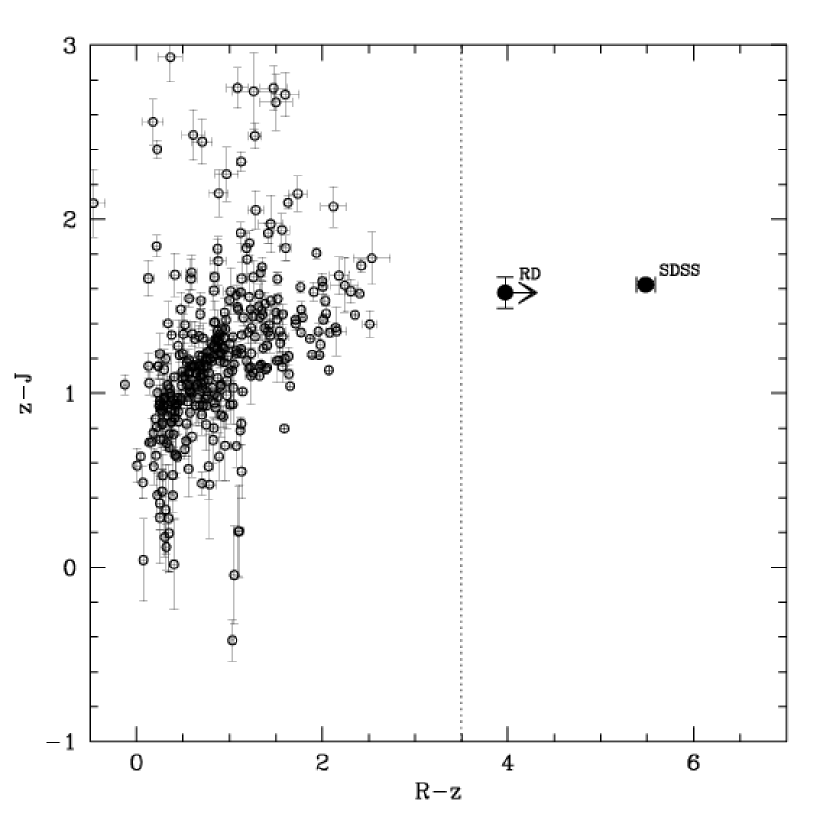
We generated and catalogs using Source Extractor (Bertin & Arnouts 1996) in double-image mode, using the -band image for source detection. The -band photometry was performed separately, using astrometrically-matched catalogs. Optical magnitudes were measured using 25 diameter apertures and the near-IR magnitudes were measured in 35 diameter apertures. Based on source counts, we estimate the images reach the following depths: , , and . In the versus color-color diagram (Fig. 1), two objects satisfy the criteria for high-redshift objects, . One is the quasar SDSS J1148+5251 itself, and the other is RD J114816.2+525339 (hereafter RD J1148+5253) – the object described herein. Table 1 presents the imaging properties of these sources and Fig. 2 shows their relative positions.
We obtained a spectrum of RD J1148+5253 on UT 2003 May 23 with LRIS on the the Keck I telescope under partly cirrusy conditions. Observations totaled 4800 sec and used the 400 line mm-1 grating ( Å) at a position angle of . Spectral reductions followed standard procedures. The final spectrum is presented in Fig. 3.
3 Results and Discussion
The spectrum of RD J1148+5253 reveals a slightly atypical quasar at . The main spectroscopic feature is the unambiguous detection of highly redshifted Ly emission, showing the characteristic asymmetric profile due to absorption of the blue wing of the emission line (cf., Stern et al. 2005). The quoted redshift is based on the peak of the Ly emission line. This standard approach, the only option for discovery optical spectra of extremely distant quasars, typically overestimates the true redshift by as determined from near-infrared spectroscopic follow-up (e.g., Goodrich et al. 2001, Barth et al. 2003, Stern et al. 2004). The spectrum also shows broad N V 1240 emission (FWHM ) and evidence of spectral breaks associated with the Ly and Ly forests. The continuum falls dramatically blueward of N V 1240, suggesting that RD J1148+5253 is a broad absorption line quasar. Such quasars constitute approximately 10% of the quasar population, and this self-absorption is perhaps somewhat responsible for the unusually narrow Ly emission (FWHM ) of RD J1148+5253. Alternatively, the narrow Ly could be coming from a low-density, intermediate-line region while the N V 1240 could be coming from a higher-density, very broad line region (c.f., Brotherton et al. 1994).
Carilli et al. (2004) have imaged the SDSS J1148+5251 field down to several at 1.4 GHz. Slightly offset from the optical position, about to the E, they find a faint, detection of a source with a peak flux of (Carilli, private communication). From available data, determining the emission mechanism isn’t feasible for such a faint, low significance detection.
How surprising is the discovery of the faint, high-redshift quasar RD J1148+5253? Similar programs reported by Sharp et al. (2004) and Willott et al. (2005) failed to identify any new, high-redshift, faint quasars, leading Willott et al. (2005) to infer that the co-moving space density of quasars brighter than declines by a factor from to . The -band dropout criterion applied here selects sources at (cf., Stern et al. 2000). Based on a large sample of faint () quasar candidates selected from the COMBO-17 survey, Wolf et al. (2003) derive the most recent, comprehensive evaluation of the faint end of the quasar luminosity function out to . Extending the pure density evolution version of their luminosity function to redshifts slightly beyond where it has been tested, we expect a surface density of 0.72 (2.08) quasars per square degree to a -band limiting magnitude (). The former magnitude limit corresponds to the brightness of RD J1148+5253, while the fainter limit corresponds to the approximate depth of our -band imaging for the SDSS J1148+5251 field. Considering only the SDSS J1148+5251 field which covers of a square degree, the discovery of RD J1148+5253 would be quite fortuitous and would suggest a significant evolution in the faint end of the quasar evolution at high redshift. However, considering the full 2.5 square degree survey we have conducted, the discovery of a single , quasar implies a surface density roughly consistent with the Wolf et al. (2003) luminosity function. We conclude that previous estimates of the faint, high-redshift quasar luminosity function based on surveys with null results (e.g., Sharp et al. 2004; Willott et al. 2005) and surveys at slightly lower redshift (e.g., Wolf et al. 2003; Hunt et al. 2004) are broadly correct: active galactic nuclei make a negligible contribution to the ultraviolet radiation budget and are unlikely to be play a significant role in reionizing the universe at .
References
- Barger et al. (2002) Barger, A. et al. 2002, AJ, 124, 1839
- Barger et al. (2003) —. 2003, ApJ, 584, L61
- Barth, Martini, Nelson, & Ho (2003) Barth, A.J., Martini, P., Nelson, C.H., & Ho, L.C. 2003, ApJ, 594, L95
- Becker et al. (2001) Becker, R. H. et al. 2001, AJ, 122, 2850
- Bertin & Arnouts (1996) Bertin, E. & Arnouts, S. 1996, A&AS, 117, 393
- Bertoldi & Cox (2002) Bertoldi, F. & Cox, P. 2002, A&A, 384, L11
- Brotherton, Wills, Francis, & Steidel (1994) Brotherton, M.S., Wills, B.J., Francis, P.J, & Steidel, C.S. 1994, ApJ, 430, 495
- Carilli et al. (2004) Carilli et al. 2004, AJ, 128, 997
- Cristiani et al. (2004) Cristiani, S. et al. 2004, ApJ, 600, L119
- Djorgovski, Castro, Stern, & Mahabal (2001) Djorgovski, S. G., Castro, S. M., Stern, D., & Mahabal, A. A. 2001, ApJ, 122, 598
- Djorgovski, Stern, Mahabal, & Brunner (2003) Djorgovski, S. G., Stern, D., Mahabal, A. A., & Brunner, R. 2003, ApJ, 596, 67
- Fan et al. (2001) Fan, X. et al. 2001, AJ, 122, 2833
- Fan et al. (2003) —. 2003, AJ, 125, 1649
- Fan et al. (2004) —. 2004, AJ, 128, 515
- Goodrich et al. (2001) Goodrich, R.W. et al. 2001, ApJ, 561, L23
- Hunt, Steidel, Adelberger, & Shapley (2004) Hunt, M. P., Steidel, C. C., Adelberger, K. L., & Shapley, A. E. 2004, ApJ, 605, 625
- Mesinger & Haiman (2004) Mesinger, A. & Haiman, Z. 2004, ApJ, 611, 69
- Oke, Cohen, Carr, Cromer, Dingizian, Harris, Labrecque, Lucinio, Schaal, Epps, & Miller (1995) Oke, J. B., Cohen, J. G., Carr, M., Cromer, J., Dingizian, A., Harris, F. H., Labrecque, S., Lucinio, R., et al., 1995, PASP, 107, 375
- Sharp, Crampton, Hook, & McMahon (2004) Sharp, R. G., Crampton, D., Hook, I. M., & McMahon, R. G. 2004, MNRAS, 350, 449
- Staguhn, Stern, Benford, Bertoldi, Djorgovski, & Thompson (2005) Staguhn, J. G., Stern, D., Benford, D. J., Bertoldi, F., Djorgovski, S. G., & Thompson, D. J. 2005, ApJ, 629, 633
- Stern, Spinrad, Eisenhardt, Bunker, Dawson, Stanford, & Elston (2000) Stern, D., Spinrad, H., Eisenhardt, P., Bunker, A. J., Dawson, S., Stanford, S. A., & Elston, R. 2000, ApJ, 533, L75
- Stern, Hall, Barrientos, Bunker, Elston, Ledlow, Raines, & Willis (2004) Stern, D., Hall, P.B., Barrientos, L.F., Bunker, A.J., Elston, R., Ledlow, M.J., Raines, S.N., & Willis, J. 2004, ApJ, 600, L111
- Stern, Yost, Eckart, Harrison, Helfand, Djorgovski, Malhotra, & Rhoads (2005) Stern, D., Yost, S., Eckart, M., Harrison, F., Helfand, D., Djorgovski, S. G., Malhotra, S., & Rhoads, J. E. 2005, ApJ, 619, 12
- Stiavelli et al. (2005) Stiavelli, M. et al. 2005, ApJ, 622, L1
- Vanden Berk et al. (2001) Vanden Berk, D. E. et al. 2001, AJ, 122, 549
- Willott, Delfosse, Forveille, Delorme, & Gwyn (2005) Willott, C. J., Delfosse, X., Forveille, T., Delorme, P., & Gwyn, S. D. J. 2005, ApJ, in press (astro-ph/0507183)
- Wilson et al. (2003) Wilson, J. C. et al. 2003, SPIE, 4841, 451
- Wolf, Wisotzki, Borch, Dye, Kleinheinrich, & Meisenheimer (2003) Wolf, C., Wisotzki, L., Borch, A., Dye, S., Kleinheinrich, M., & Meisenheimer, K. 2003, A&AS, 408, 499
- Wyithe & Loeb (2004) Wyithe, S. & Loeb, A. 2004, Nature, 427, 815
- Yan & Windhorst (2004) Yan, H. & Windhorst, R. A. 2004, ApJ, 600, L1
| Object | R.A. | Dec. | ||||
|---|---|---|---|---|---|---|
| SDSS J1148+5251 | 11:48:16.67 | +52:51:50.4 | ||||
| RD J1148+5253 | 11:48:16.21 | +52:53:39.3 |
Note. — Astrometry is in J2000 coordinates. Optical magnitudes are in the AB system; near-IR magnitudes are in the Vega system. is obtained by transforming the magnitude to using the Vanden Berk et al. (2001) quasar template spectrum.