The Magnetic Field in the Star-forming Region Cepheus A
We present linear and circular polarization observations of the H2O masers in 4 distinct regions spread over arcseconds around the HW2 high-mass young stellar object in the Cepheus A star-forming region. We find magnetic fields between 100–500 mG in the central maser region, which has been argued to trace a circumstellar disk. The masers further from HW2 have field strengths between 30–100 mG. In all cases the magnetic field pressure is found to be similar to the dynamic pressure, indicating that the magnetic field is capable of controlling the outflow dynamics around HW2. In addition to several H2O maser complexes observed before, we also detect a new maser filament, 1 ( 690 AU) East of HW2, which we interpret as a shocked region between the HW2 outflow and the surrounding medium. We detect a linear polarization gradient along the filament as well as a reversal of the magnetic field direction. This is thought to mark the transition between the magnetic field associated with the outflow and that found in the surrounding molecular cloud. In addition to the magnetic field we determine several other physical properties of the maser region, including density and temperatures as well as the maser beaming angles.
Key Words.:
star-formation – masers – polarization – magnetic fields1 Introduction
While the process of low-mass star-formation has been well studied, high-mass star-formation is still poorly understood. Although several theories propose the formation of high-mass stars from the merger of several low-mass young stellar objects (e.g. Bonnell et al., 1998) recent studies and observations suggest that high-mass stars form, similar to low-mass stars, through accretion from a circumstellar disk (e.g. McKee & Tan, 2003; Patel et al., 2005; Jiang et al., 2005). In the prevailing picture of low-mass star-formation out of dense molecular clouds, strong magnetic fields support the clouds against a gravitational collapse. When self-gravity overcomes the magnetic pressure in the cloud core, the formation of protostars ensues (e.g. Shu et al., 1987; Mouschovias & Ciolek, 1999). Additionally, magnetic fields likely play an important role in many other stages of star-formation, such as the formation of bi-polar outflows and a circumstellar disk (e.g. Akeson & Carlstrom, 1997). Thus, accurate measurements of the magnetic field strength and structure in the densest areas of star-forming regions (SFRs) are needed to investigate the exact role of the magnetic field in both high- and low-mass starformation (see, e.g Sarma et al., 2001, 2002).
Through polarization observations, masers are excellent probes of magnetic field strength and structure in masing regions. For example, polarimetric SiO, H2O and OH maser observations in the envelopes of evolved stars have revealed the strength and structure of the magnetic fields during the end-stages of stellar evolution (e.g Kemball & Diamond, 1997; Etoka & Diamond, 2004; Vlemmings et al., 2005) and H2O maser polarization observations have provided stringent upper limits of the magnetic field in the megamaser galaxy NGC 4258 (Modjaz et al., 2005). SFRs also show a rich variety of maser species, including OH and H2O . The OH masers are often found at several hundred to thousands AU from the SFR cores where the density is less than a few times 108 cm-3. Observations of the Zeeman effect on OH masers have been used to determine the SFR magnetic field in those regions (e.g Cohen et al., 1990; Bartkiewicz et al., 2005). The H2O maser emission in SFRs is often associated with shocks created by the outflows of young stellar objects (YSOs) or with a circumstellar disk (Torrelles et al., 1996, hereafter T96; Gallimore et al., 2003, hereafter G03). The H2O masers are excited in the dense parts of SFRs, with number densities between approximately 108 and 1010 cm-3 (Elitzur et al., 1989). Because they are typically small (1 AU), have a narrow velocity width (1 km s-1) and have a high brightness temperature K (e.g. Reid & Moran, 1981), H2O masers can be used to examine the small scale magnetic field strength and structure in dense parts of SFRs with polarimetric very long baseline interferometry (VLBI) observations. Previous VLBI observations have studied the linear polarization of H2O masers as tracer of the magnetic field morphology in the SFRs W51 M (Leppänen et al., 1998), Orion KL and W3 IRS 5 (Imai et al., 2003). The circular polarization due to Zeeman splitting of the 22 GHz H2O masers was first observed by Fiebig & Güsten (1989) with the Effelsberg 100m telescope. These observations were confirmed with VLBI by Sarma et al. (2001), who observed the H2O maser circular polarization in W3 IRS 5 with the Very Long Baseline Array (VLBA). At lower spatial resolution, Sarma et al. (2002), also used the Very Large Array (VLA) to determine magnetic field strengths in a number of SFRs from H2O maser observations. Here we present VLBA linear and circular polarization observations of the H2O maser structures in the SFR Cepheus A HW2.

Cepheus A is a high-mass SFR located at a distance of 725 pc (Johnson, 1957), which contains a large number of radio continuum sources (HW sources; Hughes & Wouterloot, 1984). Additionally it exhibits multi-polar outflows, NH3 clouds, Herbig-Haro (HH) objects and infrared sources and a complex structure of OH, H2O and methanol masers. The HW sources are compact HII regions that are thought to be excited by a YSO either externally or embedded in the HII cloud itself (Cohen et al., 1984; Garay et al., 1996). The brightest of these sources is HW2 (Rodríguez et al., 1994), which is thought to contain the main exciting source in the SFR. Surrounding it is a rich structure of H2O masers which has been studied in great detail (e.g T96; G03; Torrelles et al., 1998, 2001a, 2001b, hereafter T98, T01a and T01b). More H2O maser structures are found in clusters around other HW sources (HW3b and HW3d), 4-5 south from HW2 (T98; Lada et al., 1981; Cohen et al., 1984; Rowland & Cohen, 1986). The main, large scale, H2O maser structure in the direction of HW2 was interpreted as tracing a 300 AU radius circumstellar disk perpendicular to the HW2 radio jet (T96). Recently, a flattened disk-like structure of dust and molecular gas with radius 330 AU oriented perpendicular to and spatially coincident with the HW2 radio jet has been reported (Patel et al., 2005; Curiel et al., 2005).
Here we examine the polarization properties of the H2O masers around Cepheus A HW2 and determine the magnetic field strength and structure. Additionally we describe the physical properties of the H2O maser regions and discuss the detection of a new H2O maser filament approximately 1″ East of the HW2 region.
The observations are described in § 2 and the results on the maser morphology and polarization are presented in § 3. The results are discussed in § 4, where intrinsic properties of the masing regions are derived. This is followed by a summary and conclusions in § 5 and § 6. The analysis method and the H2O maser models used are presented in Appendix A.
2 Observations
The observations were performed with the NRAO111The National Radio Astronomy Observatory (NRAO) is a facility of the National Science Foundation operated under cooperative agreement by Associated Universities, Inc. VLBA on October 3 2004. The average beam width is mas at the frequency of the rotational transition of H2O, 22.235080 GHz. We used 4 baseband filters of 1 MHz width, which were overlapped to get a total velocity coverage of km s-1, covering most of the velocity range of the H2O masers around the mean velocity of the H2O masers of HW2 km s-1 (T96). Similar to the observations in Vlemmings et al. (2002) (hereafter V02) of circumstellar H2O maser polarization, the data were correlated multiple times with a correlator averaging time of 8 sec. The initial correlation was performed with modest spectral resolution (128 channels; kHz km s-1), which enabled us to generate all 4 polarization combinations (RR, LL, RL and LR). Two additional correlator runs were performed with high spectral resolution (512 channels; kHz km s-1), which therefore only contained the two polarization combinations RR and LL, to be able to detect the signature of the H2O Zeeman splitting across the entire velocity range. The observations on Cepheus A HW2 were interspersed with 15 minute observations of the polarization calibrator J2202+4216 (BL Lac). Including scans on the phase calibrators (3C345 and 3C454.3) the total observation time was 8 hours.
2.1 Calibration
The data analysis path is described in detail in V02. It follows the method of Kemball et al. (1995) and was performed in the Astronomical Image Processing Software package (AIPS). The calibration steps were performed on the data-set with modest spectral resolution. Delay, phase and bandpass calibration were performed on 3C345, 3C454.3 and J2202+4216. Polarization calibration was performed on the polarization calibrator J2202+4216 (Fig.1). Fringe fitting and self-calibration were performed on a strong (80 Jy beam-1) maser feature (at km s-1). The calibration solutions were then copied and applied to the high spectral resolution data-set. Finally, corrections were made for instrumental feed polarization using a range of frequency channels on the maser source, in which the expected frequency averaged linear polarization is close to zero. In order to make a comparison with previous results we have used the AIPS task FRMAP in an attempt to determine the position of the reference feature before any self-calibration or fringe fitting. Though an exact position determination was impossible, we found it to be within 25 mas of our pointing position ( and ), which was the brightest maser feature of the maser region R4 from G03.
An initial image cube with low resolution ( pixels of 1 mas) was created from the modest spectral resolution data set using the AIPS task IMAGR. In this cube a search was performed for maser features and 4 distinct regions with maser emission were detected (further labeled I through IV; shown in Fig. 2). For these fields, typically 100100 mas in size, IMAGR was used to create high spatial resolution ( pixels of 0.09 mas) Stokes I, Q and U image cubes from the modest spectral resolution data set. Stokes I and V cubes for the same regions were created from the high spectral resolution data set. In the high spectral resolution total intensity channel maps, the noise ranges from 15 mJy in the channels with weak maser features, to 35 mJy when dominated by dynamic range effects in the channels with the strongest maser features. In the circular polarization polarization maps the rms noise is 15 mJy. In the lower resolution Stokes Q and U maps the rms noise is mJy.
Unfortunately, we found that in a small range of frequency channels where a higher frequency band overlaps the neighboring lower band, cross-talk between the sub-bands resulted in unreliable calibration. Although we were able to image the masers in those channels ( between km s-1 and km s-1 as well as between km s-1 and km s-1) they were not included in our polarization analysis as the calibration accuracy was insufficient.
To calibrate the polarization angle of the resulting maps, the polarization calibrator J2202+4216 was mapped using the full 4 MHz bandwidth. The resulting map with polarization vectors is shown in Fig. 1. The polarization vectors were rotated to match the polarization angle of J2202+4216 determined in the VLBA polarization calibration observations 222http://www.aoc.nrao.edu/smyers/calibration/. As our observations were made exactly between two of the calibration observations on September 19 and October 17 2004 where the polarization angle of J2202+4216 changed from 41∘ to 57∘, we use the average of 49∘. Thus, we estimate our polarization angles to contain a possible systematic error of 8∘.
2.2 Cepheus A HW2
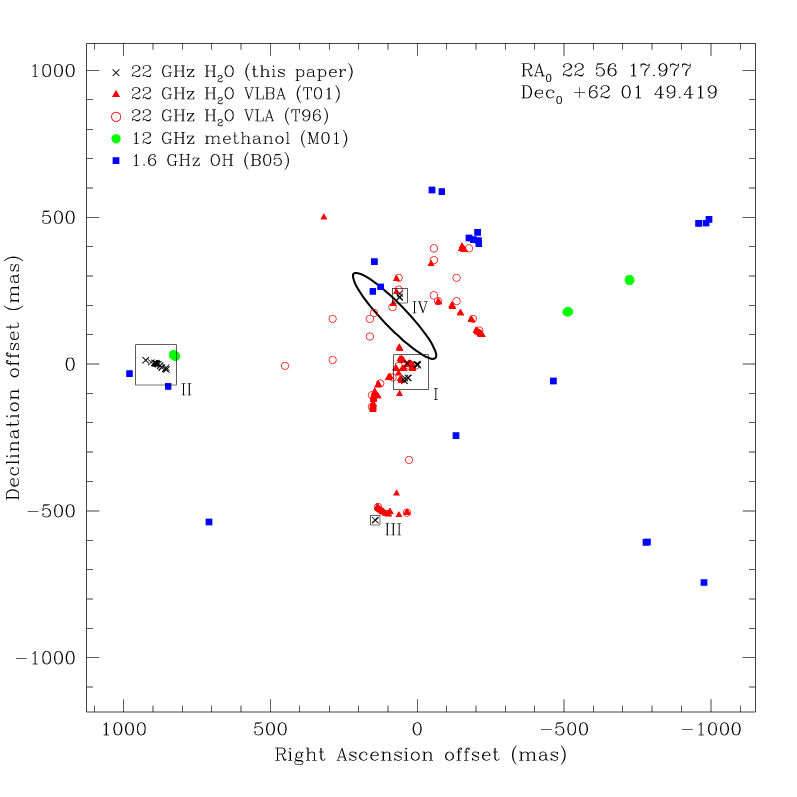
We detected 4 distinct regions of H2O maser emission between and km s-1. We did not detect any of the maser features with positive velocity from T98 and T01a to a limit of 45 mJy. In Fig. 2 we show a area around HW2 in which the fields where H2O maser emission was detected are marked. We also indicate the continuum source HW2 (T96) and the location of previously detected H2O maser not visible in our observations. Additionally, the location of OH masers (Bartkiewicz et al., 2005) and 12 GHz methanol masers (Minier et al., 2001) are plotted. All offset positions in this paper are given with respect to reference maser feature position at km s-1 which was earlier found to be within 25 mas of our pointing center. The accuracy of each individual maser feature position can be estimated by , which is typically better than 0.005 mas. In our polarization analysis we only considered maser features with intensities Jy.

3 Results
| Feature | RA | Dec | Peak Flux | Pl | PV | B | |||||
| offset | offset | Density (I) | |||||||||
| (mas) | (mas) | (Jy beam-1) | km s-1 | km s-1 | (%) | (∘) | km s-1 | ||||
| I.a∗ | 44.213 | -57.325 | 10.32 | -1.86 | 0.53 | - | - | - | - | - | - |
| I.b | 43.289 | -56.585 | 16.79 | -3.83 | 0.59 | 2.6 | 1.8 | 10.5 | |||
| I.c | 42.750 | -56.510 | 9.83 | -4.12 | 0.70 | 9.5 | 2.0 | 10.7 | |||
| I.d∗∗ | 42.290 | -47.644 | 19.09 | -4.28 | 0.58 | 12.7 | - | - | |||
| I.e | 42.229 | -48.655 | 75.18 | -3.96 | 0.78 | 10.3 | 1.0 | 10.0 | |||
| I.f∗ | 34.428 | 1.488 | 33.35 | -13.04 | 0.48 | - | - | - | - | - | - |
| I.g∗ | 33.811 | 1.977 | 27.49 | -12.97 | 0.53 | - | - | - | - | - | - |
| I.h∗ | 32.322 | -46.771 | 87.44 | -1.94 | 0.62 | - | - | - | - | - | - |
| I.i∗ | 31.031 | -47.121 | 12.81 | -1.68 | 1.01 | - | - | - | - | - | - |
| I.j∗ | 29.643 | -47.557 | 8.49 | -1.20 | 0.94 | - | - | - | - | - | - |
| I.k | 1.963 | -1.027 | 3.48 | -18.83 | 0.57 | - | - | - | - | ||
| I.l | 1.040 | -2.099 | 3.04 | -19.04 | 0.51 | - | 23.1 | 2.0 | 9.9 | ||
| I.m | 0.082 | -3.303 | 11.47 | -19.44 | 0.50 | - | 6.8 | 1.7 | 10.3 | ||
| I.n | 0.000 | 0.000 | 78.94 | -15.72 | 0.52 | - | 7.2 | 1.7 | 10.4 | ||
| I.o | -0.820 | -4.152 | 4.02 | -19.28 | 0.59 | - | - | - | |||
| I.p | -0.871 | -0.183 | 61.63 | -15.89 | 0.51 | 6.9 | 2.0 | 9.8 | |||
| I.q∗∗ | -1.486 | -1.359 | 46.82 | -16.78 | 0.68 | 6.8 | - | - | |||
| II.a | 925.674 | 13.463 | 18.07 | -14.91 | 0.51 | - | - | - | |||
| II.b | 924.445 | 13.075 | 44.81 | -14.93 | 0.49 | - | 3.5 | 1.5 | 9.8 | ||
| II.c | 906.332 | 6.070 | 2.76 | -14.25 | 0.48 | - | - | - | |||
| II.d | 896.763 | 3.990 | 15.24 | -14.06 | 0.51 | - | - | - | |||
| II.e | 894.765 | 3.352 | 21.08 | -13.99 | 0.59 | - | - | - | |||
| II.f | 892.838 | 2.587 | 24.33 | -14.09 | 0.46 | - | - | - | |||
| II.g | 890.204 | 1.947 | 3.79 | -13.99 | 0.33 | - | - | - | - | ||
| II.h | 888.068 | 3.166 | 3.20 | -13.55 | 0.40 | - | - | - | |||
| II.i | 887.387 | 1.437 | 33.64 | -13.70 | 0.50 | - | - | - | |||
| II.j | 885.188 | 0.222 | 8.03 | -13.60 | 0.47 | - | - | - | |||
| II.k∗ | 882.617 | -0.579 | 11.25 | -13.47 | 0.53 | - | - | - | - | - | - |
| II.l∗ | 881.495 | -0.880 | 6.95 | -13.31 | 0.47 | - | - | - | - | - | - |
| II.m∗ | 880.610 | 0.001 | 5.86 | -13.26 | 0.46 | - | - | - | - | - | - |
| II.n∗ | 876.069 | -4.921 | 5.25 | -12.81 | 0.40 | - | - | - | - | - | - |
| II.o∗ | 875.052 | -5.871 | 5.03 | -12.81 | 0.44 | - | - | - | - | - | - |
| II.p | 870.917 | -11.180 | 2.48 | -12.57 | 0.47 | - | - | - | - | ||
| II.q | 869.659 | -11.433 | 5.84 | -12.65 | 0.50 | - | 3.5 | 1.8 | 10.2 | ||
| II.r∗ | 858.940 | -15.758 | 7.85 | -12.91 | 0.41 | - | - | - | - | - | - |
| II.s∗ | 857.685 | -16.246 | 8.92 | -12.91 | 0.40 | - | - | - | - | - | - |
| II.t | 855.098 | -11.502 | 5.21 | -14.51 | 0.55 | - | - | - | |||
| II.u∗ | 854.380 | -17.668 | 56.09 | -12.83 | 0.42 | - | - | - | - | - | - |
| II.v | 853.907 | -18.350 | 23.43 | -12.78 | 0.41 | 5.7 | 1.1 | 9.7 | |||
| III.a | 143.668 | -530.929 | 21.04 | -8.25 | 0.58 | 1.8 | 1.2 | 10.7 | |||
| III.b | 142.096 | -532.309 | 6.02 | -8.52 | 0.57 | 6.9 | 1.3 | 10.5 | |||
| IV.a | 60.131 | 229.423 | 1.49 | -21.28 | 0.62 | - | - | - | - | ||
| IV.b | 60.025 | 226.307 | 2.28 | -21.07 | 0.65 | - | - | - | |||
| IV.c | 58.833 | 240.075 | 1.38 | -20.75 | 0.86 | - | - | - | - | ||
| a Best fit results for the magnetic field strength along the line of sight (mG), intrinsic maser thermal width (km s-1) | |||||||||||
| and emerging brightness temperature (K sr) derived as described in Appendix A | |||||||||||
| ∗ suffer from interference (see text) | |||||||||||
| ∗∗ no direct fit possible (see Appendix A) | |||||||||||
3.1 Distribution of the Maser Features
In Fig. 3 we show the 4 fields in which maser features stronger than 1 Jy beam-1 were identified. The hexagonal symbols denoting the maser features are scaled logarithmically by their flux density level. We identified 54 maser features although 14 of those had a velocity located in the ranges that suffered from interference as discussed above. The maser features are listed in Table 1 with their positional off-set from the reference maser position, peak flux density, radial velocity and full width half maximum (FWHM) . The positions were determined in the frequency channel containing the peak Stokes I emission using the AIPS task JMFIT. The masers in Field I, III and IV were seen previously (T01b) while Field II contains a newly detected linear maser structure approximate 1″ East of HW2 (assuming a distance of 725 pc the masers are located 690 AU from HW2). The masers in Field I are identified as the masers seen in the region labelled R4 of T01b observed with similar lsr velocity. This are also the masers that were hypothesized to belong to a rotating disk in G03 and are found over a large velocity range ( between and 0 km s-1). As seen in Fig. 2, the maser structure in Field II is located close to the brightest of the 12 GHz methanol maser features detected by Minier et al. (2001). However, the methanol masers at km s-1 are significantly red-shifted with respect to the H2O maser structure, which has an average km s-1. The 2 maser features in Field III at km s-1, correspond to a small part of the extended maser arc in R5 of T01b. This arc was identified to belong to a spherical shell around an embedded YSO (Curiel et al., 2002). The fairly weak masers of Field IV at km s-1 are located closest to HW2 and likely correspond to a few isolated features detected in T96. We did not detect any of the masers from the arc-like structures in R1, R2 and R3 of T01b. The total extent of the region in which we detected maser emission is mas, corresponding to AU.
3.2 Circular Polarization

Circular polarization between 0.018–2.31% was detected in 14 of the 40 maser features that did not suffer from the frequency band overlap interference. Features that were not analyzed due to the interference are marked in Table 1. This table also shows the circular polarization fraction as well as the magnetic field strengths along the line of sight with errors or upper limits determined by comparing the line width and circular polarization with models of non-LTE radiative transfer in the magnetized H2O molecules (Appendix A). As the errors include both the formal fitting uncertainties as well as the contribution of the error in the model (thermal line width) and (emerging maser brightness temperature in K sr), the magnetic field strength can occasionally be , even though the circular polarization signal has a SNR higher than 3. The table also includes the best fit model values for and , where the emerging brightness temperature has been scaled with maser decay and cross-relaxation rate as described in Appendix A. The errors on these are estimated there to be km s-1 in and on . As the lack of circular polarization introduces an additional free parameter in the model fitting, significantly increasing the and errors, we do not fit for maser features that do not show circular polarization. The magnetic field strength ranges from several tens of mG in Fields II and III to several hundred mG in Field I and is seen to switch direction on small scales in both Field I and II. Note that a positive magnetic field values indicates a field pointing away from the the observer. Total intensity (I) and circular polarization (V) spectra of several of the maser features are shown in Figs. 4 and 5. The spectra include the best fit model for the circular polarization.

3.3 Linear Polarization
In addition to the circular polarization, we detected linear polarization in approximately 50% of our maser features. The fractional linear polarization is given in Table 1. Figs. 4 and 5 also show several linear polarization spectra. Table 1 lists the weighted mean polarization vector position angle determined over the maser FWHM for the linearly polarized maser features with corresponding rms error. The weights are determined using the formal errors on due to thermal noise, which are given by (Wardle & Kronberg, 1974). Here and are the polarization intensity and corresponding rms error respectively. Fig. 3 shows the linear polarization vectors scaled logarithmically according to fractional polarization.
The strongest linear polarization (11%) was detected on the brightest maser feature in Field III, but on average 0.5%. In Fig. 6 we show a channel map of the 2 maser features detected in Field III including their polarization vectors. We do not find any relation between maser brightness and fractional linear polarization.
4 Discussion

Before discussing the polarization results we first determine several intrinsic properties of the masers that are needed for the further analysis of the linear and circular polarization. We also discuss the maser morphology in the 4 fields.
4.1 Intrinsic Thermal Width, Brightness Temperatures and Maser Beaming
As the model results give the intrinsic thermal width in the maser region, we can use it to estimate the temperature. Although the error on is relatively large due to velocity gradients along the maser (Vlemmings & van Langevelde, 2005), we find that on average, , and correspondingly the temperature, is greater in Field I than in the outlying fields II and III. While in Field I 1150 K, in Field II and III the corresponding temperature is closer to 750 K. These temperatures are an indication that the masers originate in a C-type (non-dissociative) shock instead of a J-type (dissociative) shock. In the latter, the H2O masers have been found to originate in a relatively narrow range of temperatures near 400 K (with 500 K as a conservative upper bound) at which hydrogen molecules recombine. In contrast, in C-type shocks, the H2O masers can occur in gas with temperatures up to 3000 K provided the shock velocity km s-1 (Kaufman & Neufeld, 1996). The C-shock origin of the masers in Field I is in agreement with the model in G03 where the masers originate in a C-shock expanding though a circumstellar disk.
In addition to the models also provide an estimate of the emerging brightness temperature . This can be compared with the values determined from the measurements of the maser flux density and feature sizes. We find that in Field I the majority of the maser features are unresolved. Taking 0.4 mas as the typical size of a H2O maser feature, we derive a the brightness temperature of 1.4 K for a feature of 10 Jy beam-1. Thus, our strongest maser feature in Field I has 1.1 K. In the other fields, several of the masers are marginally resolved, with typical feature sizes of 0.6 mas, corresponding to 7.5 cm. This implies, for the strongest 54 Jy beam-1 maser feature in those regions, 3.4 K. Comparing these values with the emerging brightness temperatures from our models yields an estimate for the beaming solid angle . In Field I, with an average 1.8 we find, for the maser features with circular polarization, 7–3 sr. However, as the features are unresolved the beaming angle may be overestimated. The masers in Field II show a similar range of beaming angle, with 2–4 sr while the beaming of the maser in Field III is much less pronounced, as 0.5. In a tubular geometry the maser beaming , where and are the transverse size and length of the tube respectively, this implies that, assuming is approximately the size of the maser features, the maser lengths are 1–6 cm. In Field III, the beaming angle is similar to what is expected for a spherical maser that is approaching saturation (Elitzur, 1994).
We now compare our measured and derived maser brightness temperatures with the maser brightness temperature at the onset of saturation when the ratio between maser rate of stimulated emission () and the maser decay rate (), 1. Using the expression from Reid & Moran (1988):
| (1) |
where is the Planck constant and the Boltzmann constant, is the maser frequency and s-1 is the 22 GHz H2O maser spontaneous emission rate (Goldreich & Keeley, 1972). For s-1 we thus find K sr. Nearly full saturation is reached when 100, for K sr. This indicates that in Field II the masers are likely mostly unsaturated, while those in Field I are in the onset of the saturation regime. In Field III the masers are almost fully saturated, which is consistent with their strong linear polarization (see Appendix A below). When saturated, the maser radiative transfer equation can be approximated by where is the maser gain at line center for the unsaturated regime. For the masers in Field III we then find 8, indicating that for 1.5 cm estimated from the beaming angle, 5 cm-1.
4.2 H2O Maser Morphology

As can be seen in Figs. 2 and 3 the H2O masers around Cepheus A HW2 show a large variety of structures. In our observations several of the maser structures found in T01b and G03 were not detected, even though our sensitivity is within a factor of 2 of those of T01b (6 mJy) and G03 (25 mJy). We did detected a strong linear maser structure in Field II that was not observed in the previous observations. The changes in observed morphology are likely due to the rapid variability of the H2O masers of Cepheus A, which show variations on timescales as short as a few days (Rowland & Cohen, 1986). Here we discuss the masers of the 4 distinct regions detected in our observations.
Field I: The H2O masers in this field show the most complex structure. The masers are located 150 AU on the sky south of the continuum source HW2 and have been previously detected in T96, T01b and G03. In T01b this region was named R4 and it was proposed that the masers of the NW corner (named R4-A) originate in a bow-shock structure produced by the wind of an undetected protostar near R4-A. The features in the SE could be connected to R4-A and produced by a shock moving 4–7 km s-1 to the NE. In G03, where these masers were observed with MERLIN, the masers are, instead of in a bowshock, hypothesized to occur in an expanding shockwave in a rotating proto-stellar disk enclosing a central mass of 3 . Here we only detect several bright features making up an incomplete disk with , and km s-1. We fitted our maser feature positions to the disk proposed by G03 using a flux density weighted least square method. Keeping the inclination and position angle fixed with the G03 model values ( and respectively) a fit was made for the Right Ascension and Declination offset of the disk center and for the disk Radius (). The result is shown in Fig. 7a. Our disk center offset position is only 7 mas SW of the position determined by G03 while the error on the reference position determination in this paper combined with that of G03 is estimated to be 27 mas. Our fitted disk radius mas. Considering we only detect a small part of the disk and since the masers in the SE corner are spread over a large area we estimate the systematic error in our radius determination to be mas, larger than the formal fitting uncertainty of 1 mas. Comparing with the radius determined at Epoch 2000.27 by G03 ( mas) we find that the disk has not expanded in the 4 years after their observations. It possibly even decreased in radius. In G03 it was found that the expansion velocity decreased from 30–40 km s-1 in 1996 to 13 km s-1 in 2000. This strong deceleration apparently has continued and may be due to mass loading of the disk as matter is swept up during the expanding shockwave. As a result a stationary shock may have formed where the circumstellar outflow collides with the much denser surrounding medium. This could also explain the disappearance of the brightest disk masers observed in G03, since for higher shock number densities ( cm-3) the masers will be quenched.

Field II: The H2O masers in Field II make up a newly discovered filamentary structure 690 AU East of HW2 at a position angle (PA) of and with a length of 60 AU. This structure also nearly coincides with 12 GHz methanol masers (at different ) located 40 mas to the NW, which show a linear structure with similar PA. As seen in Fig. 8 there is a velocity gradient along the filament from km s-1 in the NE to km s-1 in the SW. The maser structure bears resemblance to the masers in R1, R2 and R3 of T01 found towards the West of HW2 with a similar PA, although the masers in Field II are all blue-shifted with respect to the systematic velocity of HW2 while those in R1, R2 and R3 were red-shifted. The masers are too far East to be considered part of the rotating maser disk around HW2 which is thought to have a radius of 300 AU (T96). The elongated appearance of the Field II maser structure suggests a shocked nature as expected from maser theory (Elitzur et al., 1989). Although it is located at a significant distance from HW2 we suggest that the maser structure is due to the interaction of the HW2 outflow with the circumstellar molecular cloud medium. Then, similarly as for the Western R1 features in T01b, the velocity shift of 2.5 km s-1 along the maser filament could be due to acceleration of maser gas by the YSO outflow. If the masers are indeed created by shocks induced by the HW2 outflow this would indicate that at 690 AU the outflow has an opening angle of 115∘, similar to the opening angle of 110∘ estimated for the R1 masers at 150 AU in T01.
Field III: The 2 maser features detected in Field III, approximately 550 AU South of HW2 at -8.5km s-1, likely belong to the arc structure R5 described in T01a and T01b. These masers are thought to be part of a spherical shell surrounding a protostar that has possibly been identified in Curiel et al. (2002). We do not detect the long maser arc seen in T01a and T01b. While the brightest maser feature in our observations of Field III is 20 Jy beam-1, the brightest maser features of R5 in T01a and T01b (separated by 8.5 yr with respect to our observations) had flux densities of 200 Jy beam-1. However, the PA (41∘) of the extended maser structure of our observations (seen in Fig. 6) agrees with the direction of the maser curve. Fig. 7b shows the maser shell from T01a extrapolated in time using the updated shell parameters determined in G03. The curves indicate a shell expansion of mas yr-1 and a motion of the expansion center of mas yr-1 toward PA 126∘. The near-perfect alignment of the expanding shell with the maser features is remarkable, as we earlier estimated our reference position to be accurate to 25 mas. This likely indicates that we underestimated our positional accuracy and that the actual accuracy is better than 10 mas. In addition, our results indicate that the maser shell has been freely expanding during the past 8.5 years without any indication of deceleration.
Field IV: The masers in Field IV are weak and are aligned at a PA . They are located within 75 AU of HW2 at -21.0km s-1 and are probably part of the rotating maser disk around HW2 proposed in T96.
4.3 Linear Polarization
Linear polarization is often affected by Faraday Rotation due to free electrons along the line of sight through the interstellar medium. However, the Faraday rotation induced in a typical molecular cloud with fairly strong magnetic field (size 0.1 pc, electron density 1 cm-3 and 1 mG) is only at 22.235 GHz. The rotation induced in the extreme condition of a highly magnetized maser cloud (up to 1 G) is similar or less. As no compact HII regions, in which Faraday rotation could be significant, are located in front of the maser features, we can safely assume the measured is not affected by Faraday rotation.
As discussed in Appendix A, the polarization vectors determined from polarization observations of masers in a magnetic field are either parallel or perpendicular to the magnetic field lines. Thus, the polarization vectors contain information on the morphology of the magnetic field but suffer from a degeneracy. The fractional linear polarization depends on the maser saturation level as well as the magnetic field angle . Thus, we can use the measurements of together with our model results for the saturation level (through the emerging brightness temperatures) to lift the degeneracy between the polarization vectors and the direction of the magnetic field for several of our maser features.
The polarization vectors observed in the maser fields around Cepheus A HW2 are shown in Fig. 3 while is listed in Table 1. The strongest linear polarization % was found in Field III. This is consistent with the fact that the brightness temperature analysis concluded that the masers in this field are saturated. Using the brightness temperature determined from the models, adjusted for the difference in maser decay and cross-relaxation rate as described in Appendix A, we find using Fig. 11, that for the masers in Field III, . As was shown in Vlemmings (2005, hereafter V05) this is the magnetic field angle in the unsaturated (or least saturated) maser core. Thus, as , the magnetic field direction is perpendicular to the polarization vectors. As can be seen in Fig. 7b this means the magnetic field, at PA155∘, is perpendicular to the expanding shell found in T01a and thus radial from the central embedded proto-star.
In Field IV fairly strong linear polarization was detected in one of the weak maser features. As the brightness temperature of these masers is relatively low and they are unlikely to be saturated, indicates that the magnetic field angle . Thus also in Field IV the magnetic field direction is perpendicular to the polarization vector with a PA154∘, more or less along the large scale maser disk proposed in T96 with a PA135∘ and radial toward HW2.
The H2O masers in the circumstellar disk of Field I are found to have , consistent with their being only slightly saturated. With determined earlier, we find, again using Fig. 11, that is either close to or . As seen in Fig. 7a, the polarization vectors mostly lie along the disk curvature for most features except I.c and I.d, where we could be seeing a flip. If we assume that for all features, except I.c and I.d, , the magnetic field in Field I lies along the disk. However, if most features have except for I.c and I.d, the magnetic field is radial in the H2O maser region of the rotating disk. Additionally, as in either case, is close to the magnetic field angle with respect to the line-of-sight is similar to the disk inclination axis, which would imply the magnetic field lies in the plane of the disk. However, as seen in Table 1, the magnetic field direction changes between the neighboring maser features making a large scale alignment unlikely.
Now we show that the polarization characteristics of the masers in Field II are consistent with the interaction between a radial magnetic field in the outflow of HW2 and a magnetic field perpendicular to the Galactic plane in the surrounding molecular cloud. The fractional polarization of the maser in the filamentary structure of Field II is on average slightly less than that in Field I. This is expected since the masers in Field II were found to be unsaturated. The high polarization of feature II.h likely indicates that there is close to . As seen in Fig. 3, there is evidence of a gradient in polarization angles along the maser filament. In addition to the gradient along the maser filament, we see in the left panel of Fig. 9 that the polarization angle rotates across individual maser features, similar to that seen in the cocoon masers of Leppänen et al. (1998). Such rotation of is not observed for any of the maser features of the other fields shown in the right panels of Fig. 9. The variation of with velocity can be described with a linear gradient, using an flux density weighted least square method allowing for the flip in that occurs when . We find that increases linearly from on the maser feature in the NE to 90∘ on the feature in the SW. This implies that II.h and II.i undergo the flip which was already expected for II.h due to its high polarization.
Similar to the model for the variation in polarization angle , we have constructed a model for the variation of the angle between the magnetic field direction and maser propagation axis along the maser filament. The model, shown in Fig. 10, is fully consistent with the maser brightness temperatures and the fractional linear polarizations as well as the inferred flip of polarization angle. We have determined and its error bars from the relation between and for unsaturated masers shown in Fig. 11. (Note that to the accomodate the direction change of the magnetic field, the model ranges from to , with the direction change occurring at ). We find that the polarization measurements are consistent with an initial slow change in until halfway along the filament the magnetic field changes sign over 10 mas.
Combining the and variation models we thus find that at the NE corner of the filament the magnetic field is pointing toward us with 10∘ and PA, while in the SW corner it is pointing away from us with 20∘ and PA90∘. We interpret this change of the magnetic field as being due to the interaction of the magnetic field related to the HW2 YSO outflow and that related to the surrounding medium. Although the magnetic field structure in the Cepheus A region is complex, Jones et al. (2004) find using Near Infrared imaging polarimetry, that the large scale field threading Cepheus A is almost perpendicular to the galactic plane with PA. This corresponds to PA=, consistent with found in the NE corner of the maser filament. Jones et al. (2004) also argue that the magnetic field in the HW2 outflow is radial with respect to HW2. This implies an angle of at the location of Field II, very consistent with the PA in the SW corner of the H2O maser filament, especially as we are probably not probing the full polarization vector rotation along the filament.

4.4 The Magnetic Field
4.4.1 The Magnetic Field Strength
The magnetic field strength was determined from circular polarization measurements for 14 maser features in Field I, II and III. In Field I the magnetic field strength varies from to mG, while in the other fields we find between and mG. While these latter magnetic field strengths are comparable to the typical field strength determined from other H2O maser observations (– mG), the field strengths determined in Field I are several times higher. However, previous observations were typically performed using single-dish (e.g. Fiebig & Güsten, 1989) or lower resolution interferometers (e.g Sarma et al., 2002), and due to blending of a large number of maser features, the magnetic field strength determined with single-dish and VLA observations could be more than a factor of 2 smaller than the actual field strengths (Sarma et al., 2001). The only other H2O maser magnetic field strength for Cepheus A was determined by Sarma et al. (2002) with the VLA, who found -3.2 mG for a feature located more than 2 arcsec East of our observed maser region.
An additional complication to the accurate determination of magnetic field strengths is the occurrence of velocity gradients along the maser amplification path. This was investigated in V05, where it was found that for velocity gradients of 1.5 km s-1 along the maser, the magnetic field could be underestimated by 40%. From a total intensity line profile analysis as described in Vlemmings & van Langevelde (2005) we estimate the typical velocity gradient for our masers to be 1 km s-1. For partly or fully saturated masers with km s-1, V05 finds that the magnetic field is overestimated by not more than a few percent. However, for the unsaturated masers in Field II the field strengths have most likely been underestimated by 30%.
The magnetic field dependence on introduces further uncertainties. While for low brightness temperature masers is straightforwardly dependent on , this relation breaks down for higher brightness temperatures. This was first investigated in Nedoluha & Watson (1992) and later shown in more detail in Watson & Wyld (2001) for masing involving low angular momentum transitions. The specific case for the 22 GHz H2O masers was again shown in V02 and their figure 7 is reproduced here as Fig. 12. In the figure we see that for increasing saturation there is a large range of where the magnetic field is actually overestimated. As we have been able to estimate for several of the observed masers we can also estimate the influence on the magnetic field strength. For the masers in Field I is thought to be close to , while the masers are saturating. This means the actual magnetic field is approximately 10% higher than the measured field strength. Thus we estimate the average field in Field I to be 250 mG with a maximum of 650 mG. The masers in Field II are however mostly unsaturated and as a result . As we only detected a magnetic field strength at the edges of the filament, where we estimated to be between 10∘ and 20∘, the field in the NE of the filament is 55 mG pointing toward us while it is 70 mG and pointing away from us in the SW. Finally, the masers in Field III were found to have . As they are saturated the magnetic field strength is likely 20% less than determined from our fits, indicating that –100 mG.
Aside from the large magnetic field strength, the maser structure in Field I is also characterized by field reversals on small scales. The magnetic field is found to reverse over less than 0.1 mas, which corresponds to cm. This argues against a large scale alignment of the magnetic field with the maser disk. The magnetic field is likely frozen into high density maser clumps in a turbulent medium. If the masers exist in a shocked region where the magnetic pressure supports the cloud and dominates the gas pressure higher magnetic fields can be obtained. Using formula 4.5 from Kaufman & Neufeld (1996),
| (2) |
where is the pre-shock H2 density and is the shock velocity, we find that for a shock velocity km s-1 as estimated for Field I, a magnetic field mG can be reached if the pre-shock number density cm-1. Estimating the pre-shock magnetic field using the empirical relation of Crutcher (1999) from the density and magnetic field found at the edge of NH3 molecular clouds ( mG, cm-3; Garay et al., 1996) yields 100 mG, which is almost 2 orders of magnitude larger than the typical pre-shock magnetic field strength (1 mG). Also, when determining the number density of hydrogen in the shocked H2O maser region using the relation from Crutcher (1999), the magnetic fields imply densities – cm-3. While the low-end values for are reasonable for H2O masers, the high end ( cm-3) is unlikely, as such high densities quench the maser population inversion. Thus, the magnetic field strength in the pre-shock medium of the proto-stellar disk is likely enhanced by the pressence of a nearby magnetic dynamo.
Using Eq. 2 to estimate the pre-shock number density near the maser filament in Field II yields, assuming km s-1 similar to the shock velocity in R1 to R3 of T01b, – cm-3. Scaling with this implies, for the pre-shock magnetic field 10–15 mG, similar to the magnetic field determined for comparable densities in the OH masers of Cepheus A (Bartkiewicz et al., 2005). For the number density in the shocked region this implies – cm-3, typical for H2O masers.
4.4.2 The influence of the Magnetic Field
We now examine the influence of the magnetic field on the molecular outflow around HW2. When the magnetic field pressure becomes equal to the dynamic pressure in the outflow the magnetic field will be able to influence or even control the molecular outflow. Defining the critical magnetic field where the dynamic and magnetic pressure are equal, we find
| (3) |
where and are the density and velocity of the maser medium respectively. Assuming an outflow velocity of 13 km s-1 we find 30, 100 and 350 mG for number densities of and cm-3 respectively. This means that in all the H2O maser regions where we measured the magnetic field strength the magnetic pressure is approximately equal to the dynamic pressure, as was previously found in Sarma et al. (2002). As OH maser polarization observations indicate that this also holds in the lower density pre-shock regions, we conclude that the magnetic field strength is capable of controlling the outflow dynamics.
5 Summary
Using polarimetric VLBA observations of the H2O masers around Cepheus A HW2 we have been able to measure the magnetic field strength and direction in great detail at sub-AU scales. We detected H2O masers over an area of 1 in 4 distinct fields. For each of the fields we derived physical properties and several intrinsic properties of the masers.
Field I: The H2O masers in this field occur in what was proposed in G03 to be a spherical shockwave expanding through a circumstellar disk. We find that between the G03 MERLIN observations in 2000 and our observations the maser ring has not expanded and conclude that the expanding shockwave has been severely decelerated, possibly due to mass-loading. From our maser models and the measured brightness temperatures we find that the typical maser beaming angle in this field is 5 sr implying maser amplification lengths of several AU. The masers are approaching saturation. The magnetic field strength is strong (on average mG and as high as mG) and shows direction reversal on scales of 1012 cm. This can be due to the fact that the magnetic field is frozen into a dense and turbulent medium although the linear polarization vectors indicating the magnetic field direction follow the disk and the magnetic field angle with respect to the line-of-sight is approximately equal to the disk inclination. The high magnetic field strengths indicate that the field is enhanced by a nearby magnetic dynamo.
Field II: This field consists of a newly discovered maser filament at 690 AU East of Cepheus A HW2 with a PA. It is likely the result of the shock interaction between the HW2 outflow and the surrouding molecular cloud and implies a large opening angle () of the outflow. The maser beaming angle in Field II is 10-2 sr with maser path lengths of 2 AU while the masers are unsaturated. We find a clear velocity and magnetic field orientation gradient along the filament consistent with the interaction between a radial magnetic field in the HW2 outflow and the magnetic field in the surrounding Cepheus A complex which is almost perpendicular to the Galactic plane. The magnetic field strength of – mG is typical for H2O masers found in SFRs.
Field III: The masers of Field III make up a small part of the shell structure found in T01 and, even though our maser reference position has an estimated error of up to mas, are fully consistent with the shell expansion model parameters estimated in G03. We find a magnetic field strength between 30–100 mG, consistent with other SFR H2O maser polarization measurements and find that the magnetic field direction is along the shell expansion direction, radial from the central embedded proto-star. As these maser have the highest measured linear polarization, , we can conclude that they are saturated. The beaming angle is consistent with a spherical maser geometry.
Field IV: Located close to HW2, the maser in this field are weak and no magnetic field strength was determined. The upper limits of 500 mG. The linear polarization indicates that the magnetic field is either aligned with the H2O maser disk around HW2 or radial toward HW2.
6 Conclusions
Strong magnetic fields of up to 600 mG have been measured in the H2O masers around Cepheus A HW2. The strongest magnetic fields were measured in the maser structure that was identified as a circumstellar disk (G03), suggesting the nearby presence of a dynamo source. The field strengths determined in the maser regions further from the central source HW2 are 30–100 mG, consistent with earlier VLA, VLBA and single dish measurements of SFRs. The high magnetic field strengths indicate that the magnetic pressure is similar to the dynamic pressure in the outflows around HW2. Thus, the magnetic fields likely play a large role in supporting the molecular cloud and shaping the outflows in this very active high-mass star-forming region.
Acknowledgements.
WV thanks R.J. Cohen for usefull discussions and comments. WV was supported by an EC Marie Curie Fellowship under contract number MEIF-CT-2005-010393. JMT acknowledges partial financial support from MCYT (Spain) grant AYA2005-08523-C03-02.Appendix A Polarization Modeling and Analysis
Here we describe the modeling and analysis of the 22 GHz H2O maser linear and circular polarization used in this paper to determine the magnetic field strength, saturation level and intrinsic thermal line width of the maser features.


A.1 Circular Polarization
For the analysis of the circular polarization spectra we used the full radiative transfer non-LTE interpretation, which was thoroughly described in V02. There the coupled equations of state for the 99 magnetic substates of the three dominant hyperfine components from Nedoluha & Watson (1992) (hereafter NW92) were solved for a linear maser in the presence of a magnetic field. The emerging maser flux densities of the resulting spectra are expressed in , where is the brightness temperature and is the beaming solid angle. It was found in NW92 that the emerging brightness temperature scaled linearly with , which are the maser decay rate and cross-relaxation rate . For the 22 GHz H2O masers, is typically assumed to be s-1. In star-forming regions it has been found that 2 s-1 for 400 K and 5 s-1 for 1000 K (Anderson & Watson, 1993) and thus the models from V02 (where 1 s-1) have been adjusted to these values.
The model results further depend on the intrinsic thermal line-width in the maser region, where with the temperature of the masing gas. Model spectra for a grid of between 0.8 and 2.5 km s-1, corresponding to temperatures between 250 and 2500 K, were directly fitted to the observed I and V spectra using a least square fitting routine. As described in V02 the spectral fitting for the non-LTE analysis requires the removal of the scaled down total power spectrum from the V-spectrum to correct for small residual gain errors between the right- and left-polarized antenna feeds. This was typically found to be of the total power. The best fit model thus produced the line of sight magnetic field and the thermal line-width as well as the maser emerging brightness temperature . However, the uncertainties in and are large, as they are strongly affected by maser velocity gradients (Vlemmings & van Langevelde, 2005; V05). Additionally, depends on the actual value of . We estimate the uncertainties in the fit for to be 0.3 km s-1 and the uncertainty in to be 0.4. As the magnetic field depends on the intrinsic thermal line-width and emerging brightness temperature (V02), this leads to an added uncertainty in the magnetic field determination of 15% which has been included in the formal fitting errors.
When a direct model fit was not possible, we used the relation between the magnetic field strength and percentage of circular polarization .
| (4) | |||||
Here is the angle between the maser propagation direction and the magnetic field () and is the maser full width half maximum (FWHM). and are the maximum and minimum of the circular polarization and is the maximum total intensity maser flux density. The coefficient describes the relation between the circular polarization and the magnetic field strength for a transition between a high () and low () rotational energy level. depends on and maser saturation level as described in NW92 and V02 as well as on velocity and magnetic field gradients along the maser path as shown in V05. We used , which is the typical value we found for the maser of Cepheus A HW2. For maser features where no circular polarization was detected the upper limits were determined using Eq. 4 with , with being the rms noise on the maser V-spectrum determined after Hanning smoothing the spectrum (5–8 mJy).
For maser brightness temperatures K sr it was shown in NW92 that the dependence of Eq. 4 breaks down introducing a more complex dependence on . This was later shown in more detail in Watson & Wyld (2001) for masing involving angular momentum 1–0 and 2–1 transitions. In V02, figure 7 shows the derived magnetic field strength dependence on to for the 22 GHz 6–5 transition. This figure is repeated here as Fig. 12.
A.2 Linear Polarization
Maser theory has shown that the percentage of linear polarization of H2O masers depends on the degree of saturation and the angle between the maser propagation direction and the magnetic field (e.g. NW92; Deguchi & Watson, 1990). Figure 7 of NW92 shows the relationship between and while their Figure 8 shows the dependence on saturation level. Fig. 11 shows the dependence of on for various emerging brightness temperatures as calculated from the models of NW92 and V02. A high linear polarization fraction () can only be produced when the maser is saturated. Additionally, the polarization vectors are either perpendicular or parallel to the magnetic field lines, depending on . When 55∘ the polarization vectors are perpendicular to the magnetic field, and when they are parallel (Goldreich et al., 1973). Consequently, the linear polarization vectors can flip at very small scales as was observed in for instance circumstellar SiO masers (Kemball & Diamond, 1997).
References
- Akeson & Carlstrom (1997) Akeson, R. L. & Carlstrom, J. E. 1997, ApJ, 491, 254
- Anderson & Watson (1993) Anderson, N. & Watson, W. D. 1993, ApJ, 407, 620
- Bartkiewicz et al. (2005) Bartkiewicz, A., Szymczak, M., Cohen, R. J., & Richards, A. M. S. 2005, MNRAS, 361, 623
- Bonnell et al. (1998) Bonnell, I. A., Bate, M. R., & Zinnecker, H. 1998, MNRAS, 298, 93
- Cohen et al. (1990) Cohen, R. J., Brebner, G. C., & Potter, M. M. 1990, MNRAS, 246, 3P
- Cohen et al. (1984) Cohen, R. J., Rowland, P. R., & Blair, M. M. 1984, MNRAS, 210, 425
- Crutcher (1999) Crutcher, R. M. 1999, ApJ, 520, 706
- Curiel et al. (2005) Curiel, S., Ho, P. T. P., Patel, N. A., et al. 2005, ApJ, submitted
- Curiel et al. (2002) Curiel, S., Trinidad, M. A., Cantó, J., et al. 2002, ApJ, 564, L35
- Deguchi & Watson (1990) Deguchi, S. & Watson, W. D. 1990, ApJ, 354, 649
- Elitzur (1994) Elitzur, M. 1994, ApJ, 422, 751
- Elitzur et al. (1989) Elitzur, M., Hollenbach, D. J., & McKee, C. F. 1989, ApJ, 346, 983
- Etoka & Diamond (2004) Etoka, S. & Diamond, P. 2004, MNRAS, 348, 34
- Fiebig & Güsten (1989) Fiebig, D. & Güsten, R. 1989, A&A, 214, 333
- Gallimore et al. (2003) Gallimore, J. F., Cool, R. J., Thornley, M. D., & McMullin, J. 2003, ApJ, 586, 306 (G03)
- Garay et al. (1996) Garay, G., Ramirez, S., Rodriguez, L. F., Curiel, S., & Torrelles, J. M. 1996, ApJ, 459, 193
- Goldreich & Keeley (1972) Goldreich, P. & Keeley, D. A. 1972, ApJ, 174, 517
- Goldreich et al. (1973) Goldreich, P., Keeley, D. A., & Kwan, J. Y. 1973, ApJ, 179, 111
- Hughes & Wouterloot (1984) Hughes, V. A. & Wouterloot, J. G. A. 1984, ApJ, 276, 204
- Imai et al. (2003) Imai, H., Horiuchi, S., Deguchi, S., & Kameya, O. 2003, ApJ, 595, 285
- Jiang et al. (2005) Jiang, Z., Tamura, M., Fukagawa, M., et al 2005, Nature, 437, 112
- Johnson (1957) Johnson, H. L. 1957, ApJ, 126, 121
- Jones et al. (2004) Jones, T. J., Woodward, C. E., & Kelley, M. S. 2004, AJ, 128, 2448
- Kaufman & Neufeld (1996) Kaufman, M. J. & Neufeld, D. A. 1996, ApJ, 456, 250
- Kemball & Diamond (1997) Kemball, A. J. & Diamond, P. J. 1997, ApJ, 481, L111
- Kemball et al. (1995) Kemball, A. J., Diamond, P. J., & Cotton, W. D. 1995, A&AS, 110, 383
- Lada et al. (1981) Lada, C. J., Blitz, L., Reid, M. J., & Moran, J. M. 1981, ApJ, 243, 769
- Leppänen et al. (1998) Leppänen, K., Liljeström, T., & Diamond, P. 1998, ApJ, 507, 909
- McKee & Tan (2003) McKee, C. F. & Tan, J. C. 2003, ApJ, 585, 850
- Minier et al. (2001) Minier, V., Conway, J. E., & Booth, R. S. 2001, A&A, 369, 278
- Modjaz et al. (2005) Modjaz, M., Moran, J. M., Kondratko, P. T., & Greenhill, L. J. 2005, ApJ, 626, 104
- Mouschovias & Ciolek (1999) Mouschovias, T. C. & Ciolek, G. E. 1999, in NATO ASIC Proc. 540: The Origins of Stars and Planetary Systems, ed. C. J. Lada & N. D. Kylafis (Dordrecht: Kluwer), 305
- Nedoluha & Watson (1992) Nedoluha, G. E. & Watson, W. D. 1992, ApJ, 384, 185 (NW92)
- Patel et al. (2005) Patel, N. A., Curiel, S., Sridharan, T. K., et al 2005, Nature, 427, 109
- Reid & Moran (1981) Reid, M. J. & Moran, J. M. 1981, ARA&A, 19, 231
- Reid & Moran (1988) Reid, M. J. & Moran, J. M. 1988, Astronomical masers; in Galactic and Extragalactic Radio Astronomy 2nd ed., ed. G. L. Verschuur & K. I. Kellermann, (Berlin: Springer), 255–294
- Rodríguez et al. (1994) Rodríguez, L. F., Garay, G., Curiel, S., et al. 1994, ApJ, 430, L65
- Rowland & Cohen (1986) Rowland, P. R. & Cohen, R. J. 1986, MNRAS, 220, 233
- Sarma et al. (2002) Sarma, A. P., Troland, T. H., Crutcher, R. M., & Roberts, D. A. 2002, ApJ, 580, 928
- Sarma et al. (2001) Sarma, A. P., Troland, T. H., & Romney, J. D. 2001, ApJ, 554, L217
- Shu et al. (1987) Shu, F. H., Adams, F. C., & Lizano, S. 1987, ARA&A, 25, 23
- Torrelles et al. (1998) Torrelles, J. M., Gómez, J. F., Garay, G., et al. 1998, ApJ, 509, 262 (T98)
- Torrelles et al. (1996) Torrelles, J. M., Gómez, J. F., Rodríguez, L. F., et al. 1996, ApJ, 457, L107 (T96)
- Torrelles et al. (2001a) Torrelles, J. M., Patel, N. A., Gómez, J. F., et al. 2001a, ApJ, 560, 853 (T01a)
- Torrelles et al. (2001b) Torrelles, J. M., Patel, N. A., Gómez, J. F., et al. 2001b, Nature, 411, 277 (T01b)
- Vlemmings (2005) Vlemmings, W. H. T. 2005, A&A, accepted (V05)
- Vlemmings et al. (2002) Vlemmings, W. H. T., Diamond, P. J., & van Langevelde, H. J. 2002, A&A, 394, 589 (V02)
- Vlemmings & van Langevelde (2005) Vlemmings, W. H. T. & van Langevelde, H. J. 2005, A&A, 434, 1021
- Vlemmings et al. (2005) Vlemmings, W. H. T., van Langevelde, H. J., & Diamond, P. J. 2005, A&A, 434, 1029
- Wardle & Kronberg (1974) Wardle, J. F. C. & Kronberg, P. P. 1974, ApJ, 194, 249
- Watson & Wyld (2001) Watson, W. D. & Wyld, H. W. 2001, ApJ, 558, L55