Supernova Remnant 1987A: Opening the Future by Reaching the Past
Abstract
We report an up-turn in the soft X-ray light curve of supernova remnant (SNR) 1987A in late 2003 (6200 days after the explosion), as observed with the Chandra X-ray Observatory. Since early 2004, the rapid increase of the 0.52 keV band X-ray light curve can no longer be described by the exponential density distribution model with which we successfully fitted the data between 1990 and 2003. Around day 6200, we also find that the fractional contribution to the observed soft X-ray flux from the decelerated shock begins to exceed that of the fast shock and that the X-ray brightening becomes “global” rather than “spotty”. We interpret these results as evidence that the blast wave has reached the main body of the dense circumstellar material all around the inner ring. This interpretation is supported by other recent observations, including a deceleration of the radial expansion of the X-ray remnant, a significant up-turn in the mid-IR intensities, and the prevalence of the optical hot spots around the entire inner ring, all of which occur at around day 6000. In contrast to the soft X-ray light curve, the hard band (310 keV) X-ray light curve increases at a much lower rate which is rather similar to the radio light curve. The hard X-ray emission may thus originate from the reverse shock where the radio emission is likely produced. Alternatively, the low increase rate of the hard X-rays may simply be a result of the continuous softening of the overall X-ray spectrum.
1 INTRODUCTION
The inner ring of supernova (SN) 1987A is believed to be a relic structure produced by the massive progenitor’s equatorial stellar winds. The optical and X-ray brightness of SNR 1987A were expected to increase dramatically when the blast wave shock front hit this high-density structure (Borkowski et al. 1997a; 1997b). The soft X-ray light curve of SN 1987A has been monitored on a regular basis since 1991, first by the ROSAT satellite (Hasinger et al., 1996) and then by the Chandra X-ray Observatory (Burrows et al. 2000; Park et al. 2002; Park et al. 2004, P04 hereafter). Up to day 3000 (since the SN), the soft X-ray emission from SNR 1987A was faint and was linearly increasing (Burrows et al., 2000). The first optical hot spot emerged in 1997 (Pun et al., 1997), and subsequent soft X-ray observations by the Chandra X-ray Observatory (beginning in October 1999) found an up-turn in the soft X-ray light curve (Burrows et al., 2000), which deviated from the earlier linear increase. Since then the soft X-ray light curve has brightened dramatically (Park et al. 2002; P04). The rapid brightening of the soft X-ray light curve over the first four years of Chandra observations has been successfully described with a simple model which assumes a constant velocity shock propagating into an ambient medium whose density increases exponentially with radius (P04; Park et al. 2005).
The emergence of optical hot spots in the inner ring has been interpreted in terms of the interaction of the shock front with irregularities (i.e., protrusions or clumps of dense gas, possibly produced by instabilities) on the inner surface of the inner ring (Michael et al., 2000). In this picture, the decelerated forward shock entering the dense protrusions is also expected to produce significant soft X-ray emission, and indeed soft X-ray bright spots have emerged at these same locations. The fraction of the shock front interacting with high density gas should increase gradually through the inclusion of more and more protrusions until the entire inner ring is finally engulfed. Recent optical images obtained with the Hubble Space Telescope (HST) have indeed revealed spectacular developments of the optically bright spots all around the entire inner ring by the end of 2003 (e.g., Plate 1 in McCray 2005).
Given the evidence for bright X-ray emission from the hot spots, it is somewhat surprising that the simple model of a blast wave interacting with an exponential density distribution has provided such a good fit to the soft X-ray light curve up to this point. We report here a significant up-turn of the soft X-ray light curve at day 6200, which cannot be fitted with the simple exponential density model.
2 OBSERVATIONS & DATA REDUCTION
We have now performed a total of eleven monitoring observations of SNR 1987A with the Advanced CCD Imaging Spectrometer (ACIS) on board Chandra. We reduced the data following the methods described in our previous papers (Burrows et al., 2000; Park et al., 2002). In order to derive the X-ray fluxes, we performed spectral fits using the two component plane-parallel shock model of P04, which provides a useful approximation of the complex temperature/velocity structure of the blast wave. The detailed description of the observations, data reduction and the image/spectral analyses of SNR 1987A, in which we obtained the X-ray fluxes and images presented in this Letter, can be found elsewhere (Park et el. 2005 in preparation). We note here that we use an updated version of the XSPEC shock model appropriate for the non-equilibrium ionization plasma111The unpublished version of the updated model has been provided by K. Borkowski.. We also re-generated the ancillary response functions using the ACIS caldb v3.00 for all eleven observations in order to consistently correct for the quantum efficiency degradation of the ACIS over the five year period of the observations. The updated X-ray fluxes for all eleven ACIS-S3 observations are presented in Table 1.
3 Soft X-ray Light Curves
The latest X-ray light curves of SNR 1987A are shown in Figure 1. As of 2005 July, the observed 0.52 keV band X-ray flux is 19.4 10-13 ergs cm-2 s-1 ( 1.42 1036 ergs s-1 at = 50 kpc, after correcting for = 2.35 1021 cm-2), which is an order of magnitude brighter than it was in 2000 January and two orders of magnitude brighter than in 1992. Figure 1 shows that the simple “exponential” model of P04 (the short-dashed curve) adequately fits the observed soft X-ray flux only until day 6200. The observed soft X-ray flux at later times increases significantly faster than the model prediction and cannot be fitted by this model. It is perhaps because this simple model does not accurately describe the soft X-ray emission from the blast wave shock interacting with the more complex density profile. The effect of this complex shock structure may have recently become significant, as indicated by the development of the optically bright spots all around the inner ring.
The forward shock is expected to encounter an extremely steep increase in the ambient density as it interacts with the dense inner ring, which will result in a substantial deceleration of the overall shock velocity and a significant increase in the soft X-ray emission. We thus construct a more sophisticated model of the light curve which considers the fast and decelerated shock components separately. This model is motivated by the picture proposed in Zhekov et al. (2005), which reconciles the slow velocities inferred from X-ray line profiles with the much faster velocities obtained from the expansion of the X-ray remnant: i.e., the long-term expansion is dominated by the rapid shock in the low-density HII region while the line widths are dominated by the slower forward shock in the dense protrusions. Following the basic arguments of P04, the observed X-ray flux can be expressed as + , where , , and are density, volume, and the electron temperature for the less dense HII region, respectively, while , , and are those for the shocked portion of the dense protrusions. As the blast wave enters the dense clumps, can be assumed for an electron-ion temperature equilibration. The total emitting volume is given by = + , and is the volume filling factor of the dense clumps. The HII region is expected to have roughly constant density inside the inner ring, and the blast wave radius is therefore a power law with time (Chevalier, 1982). For the case of SN1987A, with , the radius of the forward shock can be written as , where is the radius (in arcseconds) at which the blast wave started to interact with the HII region, is the time at , and is a coefficient related to the radial expansion rate of the shock. Given that the number of optical spots has increased rapidly in recent years, we assume that the protrusion filling factor increases exponentially with radius to a value of unity at the radius of the inner ring. For simplicity, we assume and . The observed soft X-ray flux can then be expressed as
where , is the characteristic scale height of the exponential filling factor, , and is the radius of the inner ring. Based on the previous observations (P04 and references therein), we adopt = 06, 1200 days, 083. If we assume an average shock velocity of 3000 km s-1 for the last several years, these results imply 007.
We fit the soft X-ray light curve using this model in terms of , , and . The best-fit model, displayed in Figure 1 (the solid curve), gives = 0.20.02 10-13 ergs cm-2 s-1, = 7.30.4, and = 00180001, with = 13.1/15. The recent up-turn in the soft X-ray flux appears to be the result of a significant increase in the fraction of the shock front interacting with the irregular inner boundary of the dense inner ring. As might be expected, the protrusion component now dominates the flux (providing 96% of the total flux at day 6700), while providing only a small contribution at early times (e.g., 9% of the total flux at day 3000, shortly before the first optical bright spot appeared). We note that the density ratio is considerably lower than previous estimates (P04 and references therein). We attribute the low density ratio to the simplified diagnostics of our model which can only treat the detailed density structure around the inner ring as an “average” value.
4 Soft X-ray Images
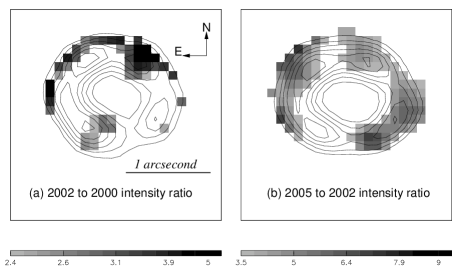
Given the recent up-turn of the soft X-ray light curve and the prevalence of the optical hot spots around the entire inner ring, the X-ray images might also reveal evidence for the brightening of the entire SNR. We therefore examined the spatial distribution of the soft X-ray brightening at two epochs. In Figure 2, we present the 0.52 keV band intensity ratios of SNR 1987A between two pairs of observations. In each panel, the gray-scales are cut above the average value in order to emphasize flux increases. It is evident that the strong brightening occurred mostly in the northern rim and the southeastern bright spot between 2000 and 2002 (Figure 2a). By contrast, the intensity increase between 2002 and 2005 (after day 6000) is nearly ubiquitous (Figure 2b), suggesting that the entire ring is now increasing in X-ray brightness.
5 Discussion
Days 6000 6200 seem to be an important milestone in the evolution of SNR 1987A. This is the point after which the observed soft X-ray light curve starts to deviate considerably from the model prediction which had successfully described the data obtained over the previous 13 years. It is remarkable that this soft X-ray up-turn is accompanied by several other notable observational events. (1) The blast wave shock kinematics obtained with our recent Chandra gratings observations indicated significantly slower velocities ( 300 1700 km s-1) for the X-ray emitting hot gas than shock velocities previously estimated by X-ray and radio images ( 3000 4000 km s-1) (Zhekov et al., 2005). (2) The fractional contribution to the total observed X-ray flux from the decelerated shock (based on the two-shock spectral modeling, Park et al. 2005 in preparation) has steadily increased over the past five years, and became dominant after day 6200 (Figure 3). (3) Until day 5800, the radial expansion rate of the X-ray remnant was 4000 km s-1 (P04). The latest Chandra data show that the X-ray radial expansion rate decreases substantially to 1600 km s-1 after day 6200 (Racusin et al. 2005, in preparation). (4) The entire inner ring became dominated by the optical hot spots by day 6000 (e.g., Plate 1 in McCray 2005). (5) Recent mid-IR observations of SNR 1987A, most likely indicating dust emission in the inner ring, show a remarkable brightening since day 6000 (Bouchet et al., 2005). The optical/IR observations, X-ray spectral results, X-ray expansion measurements, soft X-ray images, and soft X-ray light curves are all consistent with our picture that the shock is now interacting with dense gas all around the inner ring.
On the other hand, the hard X-ray flux is increasing much less rapidly than the soft X-ray flux, although it is still steeper than the extrapolated ROSAT light curve (Figure 1, the long-dashed curve). We note that the hard X-ray light curve is similar to the radio light curves (Figure 1). The radio emission likely originates from synchrotron emission from the shocked ejecta behind the reverse shock (Manchester et al., 2005). The similarity between the light curves in the radio and the hard X-ray emission suggests that the hard X-rays might also be produced behind the reverse shock rather than the decelerated forward shock front. However, the radio map does not show a clearly better correlation with the hard X-ray image than with the soft X-ray image (Figure 4). Alternatively, the low rate of brightening in the hard X-ray light curve may simply result from the overall softening of the X-ray spectrum as an increasing fraction of the forward shock front decelerates. If the hard X-rays are truly originating from the same locations where the radio emission is produced, we may expect the hard X-ray and radio light curves to increase at the same rate in the future. Otherwise, the hard X-ray flux increase rate may continue to decline. As SNR 1987A continues to brighten, we may achieve sufficient photon statistics even in the hard X-ray band to distinguish between thermal and nonthermal nature, which will be critical to unveil the origin of the hard X-ray emission: e.g., broad (a few 103 km s-1) emission lines may be detected if the hard X-rays originate from a thermal plasma behind the reverse shock.
As the blast wave now sweeps through the inner ring, the soft X-ray brightening of SNR 1987A will be more spectacular than ever and the X-ray spectrum may significantly change in coming years. In this new stage, SNR 1987A will provide a unique, unprecedented opportunity for “real time” studies of the evolution of both the forward and reverse shocks. The soft X-ray emission from the main body of the inner ring would also be useful to study the past history of the progenitor star by monitoring the progress of the forward shock through this material. Continuous multi-wavelength monitoring of SNR 1987A, including in X-rays, will be essential for such studies.
References
- (1) Borkowski, K. J., Blondin, J. M., & McCray, R. 1997a, ApJ, 476, L31
- (2) Borkowski, K. J., Blondin, J. M., & McCray, R. 1997b, ApJ, 477, 281
- Bouchet et al. (2005) Bouchet, P. et al. 2005, ApJ, Submitted
- Burrows et al. (2000) Burrows, D. N. et al. 2000, ApJ, 543, L149
- Chevalier (1982) Chevalier, R. A. 1982, ApJ, 258, 790
- Hasinger et al. (1996) Hasinger, G., Aschenbach, B., & Trümper, J. 1996, A&A, 312, L9
- Manchester et al. (2002) Manchester, R. N. et al. 2002, PASA, 19, 207
- Manchester et al. (2005) Manchester, R. N. et al. 2005, ApJ, 628, L131
- McCray (2005) McCray, R. 2005, in “Cosmic Explosions”, Proc. IAU Colloquium No. 192, eds. J. M. Marcaide and K. W. Weiler, (Heidelberg: Springer), 77
- Michael et al. (2000) Michael, E. et al. 2000, ApJ, 542, L53
- Park et al. (2002) Park, S. et al. 2002, ApJ, 567, 314
- Park et al. (2004) Park, S. et al. 2004, ApJ, 610, 275 (P04)
- Park et al. (2005) Park, S. et al. 2005, AdSpR, 35, 991
- Pun et al. (1997) Pun, C. S. J. et al. 1997, IAU Circ., 6665
- Zhekov et al. (2005) Zhekov, S. A. et al. 2005, ApJ, 628, L127
| AgeaaDays since the SN explosion. | Observed FluxbbX-ray fluxes are in units of 10-13 ergs cm-2 s-1. The ROSAT fluxes are taken from Hasinger et al. (1996). (ROSAT) | AgeaaDays since the SN explosion. | Observed FluxbbX-ray fluxes are in units of 10-13 ergs cm-2 s-1. The ROSAT fluxes are taken from Hasinger et al. (1996). (Chandra) | AgeaaDays since the SN explosion. | Observed FluxbbX-ray fluxes are in units of 10-13 ergs cm-2 s-1. The ROSAT fluxes are taken from Hasinger et al. (1996). (Chandra) |
|---|---|---|---|---|---|
| (days) | (0.52 keV) | (days) | (0.52 keV) | (days) | (310 keV) |
| 1215 | 0.23 | 4711 | 1.610.66 | 4711 | 0.840.57 |
| 1448 | 0.070.09 | 5038 | 2.400.22 | 5038 | 0.920.21 |
| 1645 | 0.150.04 | 5176 | 2.710.54 | 5176 | 1.220.41 |
| 1872 | 0.190.04 | 5407 | 3.550.43 | 5407 | 1.200.44 |
| 2258 | 0.270.05 | 5561 | 4.190.46 | 5561 | 1.490.64 |
| 2408 | 0.320.07 | 5791 | 5.620.45 | 5791 | 1.820.46 |
| 2715 | 0.330.11 | 5980 | 6.440.52 | 5980 | 1.950.62 |
| 3013 | 0.410.06 | 6157 | 7.730.62 | 6157 | 2.380.57 |
| - | - | 6359 | 11.480.69 | 6359 | 2.400.60 |
| - | - | 6533 | 16.290.65 | 6533 | 2.800.73 |
| - | - | 6716 | 19.410.97 | 6716 | 3.260.68 |