Atomic hydrogen in the one-sided “compact double” radio galaxy 2050+364
European VLBI Network spectral imaging of the “compact double” radio source 2050+364 in the UHF band at 1049 MHz has resolved the H i absorbing region, and has shown a faint continuum component to the North (N), in addition to the well-known East-West double (E, W).
Re-examination of VLBI continuum images at multiple frequencies suggests that 2050+364 may well be a one-sided core-jet source, which appears as a double over a limited frequency range. One of the dominant features, W, would then be the innermost visible portion of the jet, and could be at or adjacent to the canonical radio core. The other, E, is probably related to shocks at a sudden bend of the jet, towards extended steep-spectrum region N.
A remarkably deep and narrow H i absorption line component extends over the entire projected extent of 2050+364. It coincides in velocity with the [O iii] optical doublet lines to within 10 km s-1. This H i absorption could arise in the atomic cores of NLR clouds, and the motion in the NLR is then remarkably coherent both along the line-of-sight and across a projected distance of pc on the plane of the sky.
Broader, shallower H i absorption at lower velocities covers only the plausible core area W. This absorption could be due to gas which is either being entrained by the inner jet or is flowing out from the accretion region; it could be related to the BLR.
Key Words.:
Galaxies: active – Galaxies: ISM – Galaxies: individual: 2050+364 – Galaxies: jets – Radio lines: galaxies1 Introduction
2050+364 (J2052+3635, DA 529; J2000 coordinates , Beasley et al. beasley02 (2002)), is one the original members of the group of radio sources described as “Compact Doubles” (CDs) by Phillips & Mutel (philmut81 (1981), philmut82 (1982)), and then studied in more detail by Mutel, Hodges, & Phillips (mutel85 (1985)). Phillips & Mutel (philmut81 (1981)) suggested that, in contrast to most of the radio-loud AGN imaged with VLBI at GHz frequencies, CDs are “mini-lobes”, on (sub)galactic scales, at the ends of bi-directional outflows from an unseen central (“core”) component. The spectrum of the two components in compact doubles is typically not flat but peaked at a frequency around a GHz; such sources are termed Gigahertz Peaked Spectrum (GPS) sources (see the review by O’Dea odea98 (1998)). The spectral shape can often be reasonably well understood from synchrotron self-absorption in GHz radio emitting regions of mas cross-section, but there are indications that in some sources, the low-frequency spectral shape is also determined (in part ?) by free-free absorption (e.g., Bicknell, Dopita, & O’Dea bicknell97 (1997); Kameno et al. kameno03 (2003), hereafter K03; Risaliti, Woltjer, & Salvati risaliti03 (2003)).
The CD and GPS source classes are related to the group of Compact Symmetric Objects (CSOs), first so termed by Conway et al. (conway94 (1994)) and Wilkinson et al. (wilkinson94 (1994)). In CSOs, a central compact core component is visible in between two lobe-like components, albeit usually only faintly and often only at high observing frequencies. Thus, in CSOs the two-sidedness of the radio emission is proven beyond reasonable doubt. Models have been considered in which the lobes are kept to subgalactic dimensions by a dense confining medium (e.g., De Young deyoung93 (1993); Carvalho carvalho94 (1994), carvalho98 (1998)). However, in a number of CSOs (e.g. Owsianik & Conway owsianik98 (1998); Polatidis & Conway polatidis03 (2003); Gugliucci et al. gugliucci05 (2005)) lobe advance velocities of a few tenths have now been observed, and this provides powerful evidence that CSOs structures signify young radio sources, some with kinematic ages as low as a few hundred years.
GPS radio sources at moderate redshifts () are typically identified with passively evolving elliptical galaxies (e.g., Snellen et al. snellen98 (1998)). The lifecycle of these sources is a subject of current interest, and is not well understood: at least some of them probably evolve to become fully fledged double-lobed FR I or perhaps even FR II radio sources, which typically have linear sizes of 100 kpc or even up to 1 Mpc, although, based on number counts, they should decrease in luminosity as they grow (e.g., Fanti et al. fanti95 (1995); Readhead et al. readhead96 (1996); O’Dea & Baum odeabaum97 (1997); Alexander alexander00 (2000); Snellen et al. snellen00 (2000)). On the other hand, perhaps some compact sources may have multiple very short-lived active episodes (e.g., Gugliucci et al. gugliucci05 (2005)). Compact double radio sources are also particularly promising objects to study in the context of AGN fuelling and radio source evolution models, and the interaction between the interstellar medium and jets, because they lie entirely within the inner galaxy, on kpc or even sub-kpc scales.
One attractive possibility is to observe the 21cm hyperfine line of atomic hydrogen in absorption against bright radio structure, to study the kinematics and density distribution of the atomic gas. VLBI offers spatial resolution on the scales of the NLR and sometimes even the BLR, not accessible by any other means in galaxies at any appreciable redshift. However, for most CPS/CSO/CSS radio sources the frequency of this H i line is redshifted outside the traditional observing band. But profiting from the advent of UHF receivers on interferometers, first at the Westerbork Synthesis Radio Telescope (WSRT), and then at many telescopes in the European VLBI Network (EVN), it has become possible to study the presence and distribution of associated H i in absorption against many compact radio sources.
A WSRT survey of a sample of compact radio sources was published by Vermeulen et al. (verm03 (2003), hereafter V03), and further analysed by Pihlström, Conway, & Vermeulen (pihl03 (2003)). About one third of the objects surveyed had detectable H i absorption, and the peak depth was found to be anti-correlated with linear size. A 16 % peak depth HI absorption line at 111H km sMpc-1, , and are adopted throughout this paper, so that an angular size of 1 mas corresponds to 5.0 pc at . was discovered towards 2050+364. This is uncommonly deep; for sources of similar overall linear extent, absorption depths of 0.1–1 % (or upper limits at that level) were found to be rather more typical by V03. 2050+364 was therefore included in one of the first sessions with the new UHF receivers on the EVN, in order to resolve the HI absorption region spatially. We describe the data analysis procedure in Sec. 2, and present the results in Sec. 3.
2050+364 has received comparatively little attention in its own right during the last two decades. Perhaps this was because of its low Galactic latitude, ∘, in the Cygnus superbubble region (∘), which is a handicap for obtaining a secure optical identification because of crowding, and hampers low frequency radio studies of the object because its image is broadened by interstellar scattering (Dennison et al. dennison84 (1984), Mutel & Hodges mutel86 (1986)). Biretta, Schneider, & Gunn (biretta85 (1985)) and O’Dea, Baum, & Morris (odea90 (1990)) have both found a good match between the radio position and an , galaxy. A spectrum was published by de Vries et al. (devries00 (2000)) showing prominent H and [O iii] emission lines. The latter have a redshift ; we will critically review the redshift of 2050+364 in Sec. 5.2 and the optical identification in Sec. 5.3. Meanwhile, the low galactic latitude of 2050+364 has been turned into an advantage by using it as a background probe for interstellar scattering (e.g., Fey & Mutel fey93 (1993)). This has culminated in a multi-frequency VLBI imaging study by Lazio & Fey (lazfey01 (2001), hereafter LF). Another multi-frequency VLBI dataset is available from the investigation into possible free-free absorption in a sample of GPS sources by K03. Their results are described in Sec. 4, and used in our discussion on the nature of 2050+364 in Sec. 5.
2 Observations and data processing
2.1 Observations
On 1999 September 08–09, in one of the earliest sessions at UHF frequecies with the European VLBI Network (EVN), 14 hours were spent observing 2050+364, and the calibrators DA 406, 3C 454.3, and 3C 84. Four telescopes produced usable data: dual circular polarisations were available at Effelsberg and the WSRT, while Jodrell Bank had only LCP, and Onsala recorded dual linear polarisations. The (u,v)-coverage on 2050+364 is shown in Fig. 1. The observing band, 1046.6 MHz to 1050.6 MHz, was centred on the absorption line discovered with the WSRT by V03. A more extensive description of early EVN UHF observing characteristics and data analysis procedures will be given in Vermeulen et al. (in preparation).

2.2 Initial calibration and data averaging
The initial data processing (fringe fitting, spectral passband
calibration, and a priori complex gain calibration) took place in the
NRAO Astronomical Image Processing Software (AIPS), using the
calibrator sources. After time-interpolated transfer of the solutions,
and residual fringe-fitting on 2050+364, the data
were averaged into 256 independent spectral channels (each 4.5 km s-1 wide), and 60 sec time samples. This increased the sensitivity per
visibility. The target source, 2050+364, was detected on all
baselines.
All available polarisation products were also averaged together, including the cross-correlations between the linear polarisations from Onsala and the circular polarisations from the other telescopes. We believe the sensitivity gained to total intensity is more important than any possible resultant limitations on absolute flux calibration accuracy or on (image or spectral) dynamic range; we think these are more affected by the sparseness of the array and the lack of complete system temperature data and gain curves.

Much care was taken to obtain consistent visibility calibration, for the rather sparse array, and in the occasional presence of external radio interference (although its impact is mitigated since it is typically not coherent over VLBI baselines). Relative antenna gains were derived from requiring consistent visibility amplitudes on the calibrator sources, while the overall flux density scale was set such that in the final self-calibrated image (see below) the total flux density is equal to 3.34 Jy at 1049 MHz, a value derived by interpolation from total flux densities at a number of other frequencies (Salgado et al. salgado99 (1999); White & Becker white92 (1992)). We estimate the overall uncertainty in the flux scale of this UHF VLBI dataset to be as much as 20 %, but the main astrophysical results are unaffected, since they depend on opacities rather than on absolute flux densities.
2.3 Self-calibration; continuum imaging and modeling
The Caltech DIFMAP software package (Shepherd, Pearson & Taylor
shepherd (1977)) was used for all further calibration and analysis. A
continuum dataset was formed by averaging all of the line-free channels
on both sides of the H i absorption line, of which the location and
width were taken from the WSRT survey (V03).
The available VLBI array was sparse, but contained some crossing
points (see Fig. 1), and careful self-calibration was
feasible. A double source structure was already evident in the first
image made. After initial phase self-calibration, some additional flux
density to the north-east quickly became apparent. At that time, we
were unaware of the images published by LF, which at the lower
frequencies also show emission in that area. Extensive tests of the
reality of this third component were convincing:
our data demand its presence. There are no major sidelobes of the
dirty beam (shown in Fig. 2) to affect its
deconvolution with respect to the brighter parts of the source. We have
performed careful iterative cycles of self-calibration with
imaging/cleaning/modeling, both in trial runs where we kept excluding
the third component from the models, and in runs where we admitted the
presence of this additional continuum feature. The latter both gave
cleaner-looking images and, more significantly, consistently required
less extreme and more time-stable self-calibration coefficients.
| Component | Flux | Radial | P.A. | Diam |
|---|---|---|---|---|
| (Jy) | dist (mas) | (deg) | (mas) | |
| W | 0.79 | 0 | 0 | 13.1 |
| E | 2.44 | 57 | 99 | 5.2 |
| N | 0.11 | 74 | 66 | 7.7 |
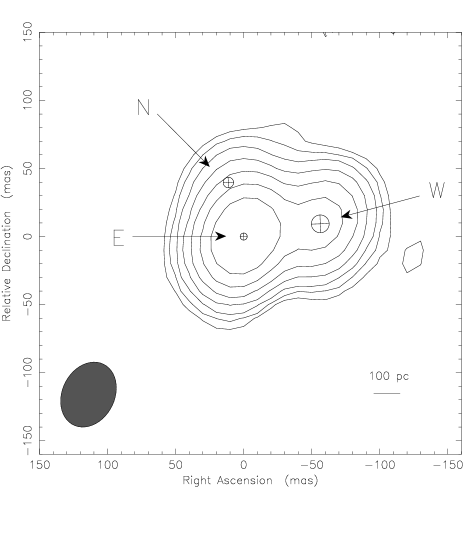
In order to restrict the number of free parameters, the sky model fitted to the visibility data during iterative self-calibration cycles consisted of three circular Gaussian components: W(est), E(ast), and N(orth); their parameters, fitted to the visibility data, are given in Table 1. The final self-calibrated continuum visibility data were used to produce the cleaned and restored image displayed in Fig. 3; symbols showing the three model components are overplotted.
2.4 Spatially resolved spectroscopy
The sensitivity of the data and the sparseness of the array did not allow generation of a full spectral image cube of acceptable signal-to-noise ratio. Instead, spectra of the W, E, and N areas of the source were determined by re-fitting the flux density of each of the three Gaussian model components derived for the line-free continuum, but then separately for each of the 256 spectral channels. The positions and diameters of the three components were not varied; they were fixed at the values derived from the continuum.


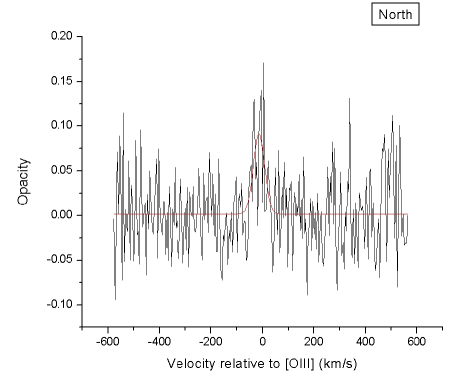
The resultant spectra are shown in Figures 4 and 5, as opacity with respect to the continuum strength of the appropriate components; this avoids the uncertainties in the absolute flux density scale, discussed in Sec. 2.2. Zero velocity for Figs. 4 and 5 corresponds to the redshift of [O iii], , published by de Vries et al. (devries00 (2000)); this choice will be further discussed in Sec. 5.2. Note that a less precise value of the optical redshift was used by V03.
| Region | Centre | FWHM | Peak opacity | |
|---|---|---|---|---|
| (km s-1) | (km s-1) | 1020 cm-2 | ||
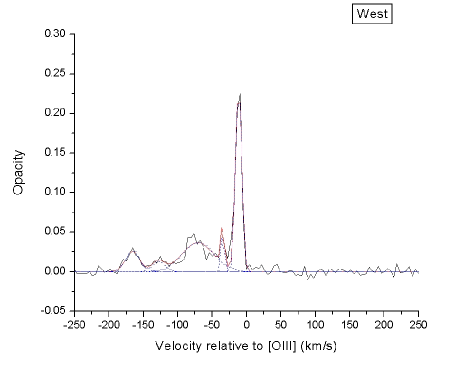
| W | 11.7 0.1 | 10.3 0.3 | 0.212 0.010 | 4.2 0.2 |
| 35 0 0.7 | 5.8 2.1 | 0.037 0.022 | 0.4 0.3 | |
| 71.0 2.3 | 55.0 6.9 | 0.036 0.006 | 3.9 0.8 | |
| 128.8 3.6 | 20.7 9.2 | 0.013 0.008 | 0.5 0.4 | |
| 166.1 1.9 | 24.1 4.8 | 0.026 0.007 | 1.2 0.4 | |
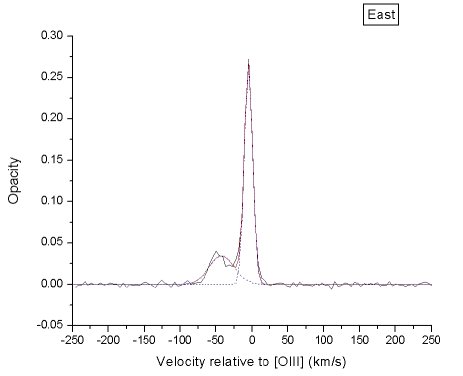
| E | 5.1 0.1 | 13.4 0.2 | 0.263 0.004 | 6.8 0.1 |
| 42 .4 0.9 | 41.1 2.4 | 0.034 0.003 | 2.7 0.3 | |
| N | 14.2 5.1 | 51.5 12.1 | 0.091 0.028 | 9.1 3.6 |
Gaussian line profiles were fitted to the most obvious features of the H i spectra at the three locations, using Origin 6.1. The fitted profiles are overplotted on the data in Fig. 6, and their parameters are listed in Table 2. These serve only to obtain a rough quantification of the absorber properties; in particular, no attempt was made to find an optimally fitting set of Gaussians to cover the complex observed line spectrum at W.
3 Results
3.1 VLBI continuum structure of 2050+364 at 1 GHz
The 1049 MHz continuum VLBI image shows the W and E components, which constitute the well-known “classical double”. At this frequency the W:E flux density ratio is close to 1:3; this is constrained better than the flux densities themselves. The two components are separated by about 57 mas (285 pc) along a PA of 100∘, which matches the relative locations found at other frequencies by LF. The component sizes we find at 1 GHz are only slightly larger than those found at 1.67 GHz by LF; we believe that the accuracy of our fitted component sizes is limited by the relatively poor resolution of our array (synthesised beam mas), although it is interesting that the angular diameter we find for E, 5.2 mas, is comparable to the scattering disk diameter determined by LF, 6–8 mas (as discussed below, this could be somewhat of an over-estimate since LF did not recognise sub-components which exist at the lowest frequencies.
We have also discovered with our data (before finding it in the low-frequency images published by LF) an additional emission region to the north/northeast, which we call N. While we are confident about the existence and approximate location of N, about 74 mas (370 pc) from W in PA ∘, its flux density (0.1 Jy) is subject to considerable uncertainty, both in view of the overall flux scale uncertainty and because, with the sparse imaging array, some extended emission may have been missed. The relatively small array of EVN antennas used did not allow the presence of substructure within any of the three components to be investigated.
3.2 H i absorption distribution
The VLBI data reveal that the two most prominent H i absorption features (16 % and 4 % integrated opacity) found towards 2050+364 in the WSRT survey (V03) do not cover the sub-kpc scale radio source uniformly. The integrated (WSRT) profile is dominated by the absorption towards E, because that component is much brighter than the other radio source components.
The distinct, deep absorption feature at the high velocity end of the absorption spectrum shows a 7 km s-1 centroid velocity offset between W and E; see also Fig. 5. This observed offset is highly significant, given the velocity resolution of 4.5 km s-1, and the high signal-to-noise ratio of these absorption features. The line is also narrower at W than at E. At N, a corresponding absorption feature is also visible in the VLBI data (see Figs. 5 and 6), but, due to the low background continuum flux density, the centroid velocity and the FWHM are too uncertain for a useful comparison. The peak opacity at N appears to be lower than at either W or E.
The VLBI data show that the second absorption feature tabulated by V03 for the integrated WSRT spectrum (where it covers the observed velocity range km s-1 to km s-1 with respect to the [O iii] redshift) has a peak opacity of at both W and E. But the detailed profile differs substantially between W and E; it is particularly irregular at W. The integrated profile shown in V03 is dominated by E, because it is the brightest feature. While the absorption at N was modeled with just a single Gaussian line, it is wider than the main component at E and W (see Table 2, and may therefore also encompass some secondary absorption features.
The VLBI data also show that there are further absorption features, extending to an observed velocity of nearly km s-1, at comparatively low opacities (a few percent, see Fig. 6). These are all detected towards W only, and not towards E; towards N the signal-to-noise ratio is too poor to establish or delimit the presence of similarly shallow features. Since E dominates the total flux density, these features are not readily apparent in the integrated spectrum of V03.
4 Multi-frequency Radio Continuum Structure
The compact structure of 2050+364 was imaged with VLBI at multiple frequencies by both LF and K03. Their projects were aimed at studying interstellar scattering, or free-free absorption statistics, respectively, and the structure of 2050+364 itself was not analysed in detail. However, we give our own description of the images here, because we will then show in Sec. 5 that together with our own results, a surprising new interpretation emerges: 2050+364 could well be a one-sided core-jet source !
To support the discussion, we show in Fig. 7 the flux densities at multiple frequencies as tabulated by LF and K03, and the flux densities at 1 GHz from our own data (Table 1). We have summed over all sub-components which were given the same label (W or E, respectively) by LF, except, as discussed below, at 0.61 GHz, where we recognise one of the components as N, and at 0.33 GHz, where we think the single flux density listed by LF should in fact be ascribed to a combination of all components. LF and K03 both have data at 2.3 GHz and 8.4 GHz. The morphologies in their images appear to match well, and while their tabulated flux densities differ at the 20 % level, the uncertainties do not obscure the trends on which we wish to focus; we simply use the average of the two available measurements in Fig. 7, with a bar to show the range between them.
The northeastern region, which we have called N, is clearly distinguishable in the 1.67 GHz image of LF, where it consists of rather extended emission at a distance of roughly 30–55 mas from region E, to the north and northeast, in position angles roughly between 0∘ and 30∘ as seen from E; the position angle of region N as seen from W is about 65∘. Note that this corresponds well with the position of N in our data (see Table 1; with respect to E, the distance of N at 1049 MHz is 41 mas, in a position angle of 16∘). There are, understandably, no model components tabulated by LF for this extended emission. From the contour levels and extent of the emission, our very rough estimate of the total flux density of N is 75 mJy, which we have indicated with a factor of 2 margin towards both lower and higher values in Fig. 7.
Region N is also unmistakably present in the 0.61 GHz image of LF. Even though, for their own analysis, LF have included it as part of E, the third 0.61 GHz model component tabulated by LF (with flux density 0.11 Jy) clearly forms part of N, given its position relative to E. The model component might only represent part the total flux density from that area, and it is thus indicated as a lower limit in Fig. 7.

At 0.33 GHz, LF have modeled the source as a single Gaussian, which they ascribed fully to E. However, in their image we find good evidence for the presence of all three components, W, E, and N. The image is clearly extended and elongated, and the western side is the fainter part. We believe this is W; all other data establish that W has a more inverted broad-band spectrum and is fainter than E at all frequencies below 8.4 GHz (see Fig. 7). Unfortunately, E and N are difficult to disentangle in the 0.33 GHz image, both because of the lower VLBI resolution, and because of scatter-broadening, although LF may have overestimated the amount of interstellar scattering at 0.33 GHz when they took the entire visible structure to be due to E. We find that the overall position angle of the contour image is 75∘–85∘. This suggests that the location of the centroid of the bright, eastern part of the source is influenced by significant contributions from both E (in PA100∘ from W) and N (in PA65∘ from W). Thus, we show in Fig. 7 a plausible but by no means unique decomposition of the total flux density of the single model component fitted by LF; to indicate our uncertainty, no marker symbols are drawn.
Components W and E, we believe, are thus separately visible at all frequencies, while component N is visible in the images up to 1.67 GHz. Above 1 GHz, where the linear resolution is sufficient and the impact of interstellar scattering negligible, “component” E shows considerable substructure. At the highest observing frequencies, 8.4 GHz and 15.4 GHz, “component” W is seen to have compact substructure as well. Where measurable, the intrinsic angular sizes of W or its sub-components are considerably smaller than those of E or its sub-components. Also, from Fig. 7, W clearly has the most inverted low-frequency spectrum, and very likely also the highest peak frequency and the flattest high-frequency spectrum.
N has quite the opposite properties: it is the most extended and does not appear to have much compact substructure; its broad-band radio spectrum is probably steep over the full frequency range (although with large uncertainties from the data of LF). Thus, W, E, and N, successively are in a sequence of decreasing compactness, steepening high frequency spectral index, and decreasing peak frequency.
5 Discussion
5.1 2050+364: a one-sided core-jet structure ?
The three regions W, E, and N show a progressive change of compactness and of spectral shape which is not typical for compact double-lobed radio sources, but rather for core-jet radio sources, where relativistic beaming and opacity effects lead to a one-sided observed structure. Furthermore, the relative alignment of the three regions is also compatible with a one-sided core-jet source. The very compact sub-components of W seen at the highest frequencies are aligned roughly, but not exactly, along the line towards E. The relative disposition of the substructures in E at various frequencies suggests that this may well be radio emission from shocks at the location of a sudden bend in a single jet, which is first visible at W, and after bending at E continues towards the more extended emission region N. The jet could be at a fairly small angle to the line of sight, such that the deprojected angle of the bend at E need not be large; this is seen in many other core-jet sources. Due to its substructure, E has a somewhat unusual convex broad-band radio spectrum, peaked at frequencies of a few GHz. We find that 2050+364 is set apart from many other GPS/CSS sources by the fact that at all GHz frequencies its total flux density is dominated by two emission regions, W and E, which are rather compact and widely separated, i.e., each one spans only a small fraction of the distance between them. Genuine double-lobed GPS/CSS sources can show compact hot spots at the two ends, but then in addition they typically have clearly visible, often dominant, extended emission regions (the lobes). Region N in 2050+364, on the other hand, is rather faint, even at the lowest frequencies, and as such would be rather atypical if it were a lobe beyond its putative hot-spot E. A convincing counter-lobe is not seen. Classical core-jet sources, on the other hand, do often show a faint extended emission region beyond a shock at a bend in the jet.
We think that it is, furthermore, plausible that the sub-components of W may be at or adjacent to the traditional radio core. Many core-jet radio sources show a few bright knots in the innermost jet. The overall apparent separation velocity between W and E at 1.67 GHz has been delimited by LF to be no faster than . However, this limit is still several times faster than what seems to be typical in CSOs (e.g., Gugliucci et al. gugliucci05 (2005)), and it also does not rule out that some sub-components might even show superluminal motions, as is sometimes seen in other sources, where stationary radio components are thought to mark regions of either confinement or bending in a jet, while other radio features may be moving with a flow or due to traveling disturbances. It is possible that the sub-components of W are still part of the inner jet, with the true core being somewhat further to the west, perhaps at a more compact radio component, as yet unseen due to a spectrum which is significantly inverted as a result of synchrotron self-absorption, free-free absorption, or a combination of both, as is probably the case in several other compact radio sources (e.g., Kameno et al. kameno03 (2003)). It would be interesting to attempt to monitor the positions of some of the well-defined sub-components in the W and E regions at high frequency.
In most well-known two-sided GPS/CSS sources, at the relatively high frequency of 15 GHz synchrotron self-absorption and/or free-free absorption do not fully hide the central core component (to a reasonable dynamic range of a hundred, say). However, even higher frequency observations would be useful before definitely ruling out the existence of a more inverted-spectrum core component between W and E, in which case the radio source might be two-sided after all. Likewise, even if the currently imaged structure is one-sided, with the core at or near W, it is possible that further high-dynamic-range imaging could reveal emission from a second jet or lobe on the opposite side. This situation has occurred, for example, in 2352+495, a well-known CSO (see Conway et al. conway92 (1992)).
The original selection of 2050+364 as a Compact Double (suggesting two-sided radio emission) seems to have been the result of a similarity between W and E which is partly coincidental; we now know that their properties diverge when studied over a wider range of frequencies, and that a section further out in the jet, N, has a steeper, more typical broad-band spectrum. Several other examples are now known in which the similarity between the components of an apparent compact double breaks down when the source is studied with high enough resolution and dynamic range and at high enough frequency. Amongst the sources now considered to be one-sided is CTD93 (see Shaffer, Kellermann, & Cornwell shaffer99 (1999)); like 2050+364, it was a member of the original group of CDs. The identification of a centrally located core component is a crucial part of confirming whether a CD or GPS source is indeed two-sided, and therefore a CSO, rather than a one-sided core-jet source in which two emission regions happen to have comparable flux densities and sizes, and therefore roughly similar spectra (Conway et al. conway94 (1994), Wilkinson et al. wilkinson94 (1994)).
5.2 The optical redshifts and H i: infall or outflow ?
The optical spectroscopy reported by de Vries et al. (devries00 (2000)) gives consistently for both [O iii] and [O iii] , while H is at . Thus, the observed centroid velocity of the [O iii] doublet is formally about 325 km s-1 larger than that of H. We believe that this difference is probably significant. The spectral resolution was 15 Å, but the centroid wavelengths are listed in integer Å, i.e with 4 significant figures. The [O iii] doublet lines are narrow and clearly have an excellent signal-to-noise ratio, so the total uncertainty in the centroid of these lines could well be of order 1Å in wavelength, or in redshift, or km s-1 in velocity. The observed FWHM of H looks like it is roughly 50 Å, or 2500 km s-1, and the line has a lower signal-to-noise ratio, so the uncertainty in its centroid is probably several times larger than for the [O iii] doublet. Nevertheless, we think that the combined velocity uncertainty probably cannot account for the entire 325 km s-1 observed centroid velocity offset between [O iii] and H.
The [O iii] line velocity and the velocity of the deepest H i features agree to within 10 km s-1 (see Fig. 4). The radio spectral resolution is 4.5 km s-1, and the H i absorption features are present at high signal-to-noise, so the uncertainty in this match is dominated by the optical data, and we believe that the offset of the [O iii] velocity from that of the deep H i feature is not significant.
The VLBI data show that there is atomic gas at the [O iii] velocity spanning a projected distance of several hundred parsecs, and probably overlapping in projection with the radio core. This makes it likely that the [O iii] emission is from a conventional narrow line region (NLR) surrounding the active nucleus, rather than from an isolated cloud moving with a fairly high peculiar velocity. In Sec. 5.3 some less conventional possibilities are discussed, but we believe these are less plausible. A substantial centroid offset from the systemic velocity of the host galaxy seems in general more likely for the broad line region (BLR), which shows the kinematics of gas under the immediate local influence of the active galactic nucleus, than for a region with an extent of several hundred parsecs. Thus, we have adopted the [O iii] redshift, , as the redshift of the host galaxy, and the zero point of the velocity scale used for our main analysis. This means that both the H line and the lower opacity H i absorption features extend to negative velocities (i.e. outflowing, approaching the observer); in the restframe, the velocity offset of H is km s-1.
The H i absorbers in 2050+364 thus appear to be somewhat different than in PKS 154979 (Tadhunter et al. tadhunter01 (2001)) and B122142 (Morganti, priv.comm.). In those objects the velocity of the H i line does not coincide with the optical redshift of the [O iii] line, but rather with the [O ii] line. Because of its lower ionisation level, one might expect [O ii] to originate in a larger region and perhaps to be more representative of the systemic velocity than [O iii].
5.3 The locations of the H i absorbers relative to the radio source
We think that all of the H i absorption may well occur in the same region as the radio source, in the inner kiloparsec of the host galaxy, and that the presence of this atomic gas might have some connection with the active nucleus, or with the radio morphology. Below we argue that an association of the narrow, deep H i component with the NLR in 2050+364 is plausible, and that the broader H i absorption towards region W could be related to the BLR.
The atomic gas is probably not kinematically disturbed very much as a result of interaction and bending of the jet at E. The absorption profile there only has two narrow components, and moreover, the dominant deep line is rather similar to the one at W, where no bending of the jet is visible. If the jet at E does impact and disturb clouds containing atomic hydrogen, these probably do not cover the radio source as seen along our line-of-sight.
The sharp, deep absorption features at low velocity are at first sight the most puzzling to explain. The integrated peak opacity in 2050+364, 16 %, is the third deepest in the sample of 41 CSS and GPS sources analysed by Pihlström et al. (pihl03 (2003)). Based on the anti-correlation of peak opacity with linear size in that sample, % absorption would be more typical for a projected extent of 300 pc. Conversely, the FWHM of the integrated deep H i absorption feature in 2050+364, 16 km s-1, is the narrowest in the sample, where most of the FWHM are in the range of fifty to several hundred km s-1, with no obvious dependence on source linear size.
Because the remarkably high peak opacity is partly balanced by a remarkably low FWHM, the integrated column depth lies only mildly above the anti-correlation with linear size in the sample of Pihlström et al. (pihl03 (2003)): assuming uniform coverage and a spin temperature K, as is often thought to prevail in typical ISM conditions, we obtain cm-2; column depths for the individual features are listed in Table 2.
The most likely location for this H i absorption is in the neutral cores of the clouds in the NLR, given the excellent correspondence with the velocity centroid of the [O iii] line, and the projected extent of at least 300 pc.
Taking cm-3 as a rough estimate of the atomic gas density in NLR clouds, and using the 300 pc transverse extent covered by the absorbers as an estimate of the line-of-sight depth through the NLR as well, this would imply that clouds are present along about 1 % of the pathlength. The key distinguishing property, then, is the low kinematic dispersion. The main direction of motion and/or rotation in the NLR of 2050+364 is evidently perpendicular to our line-of-sight, and coherent in velocity to 10 km s-1 over several hundred parsecs both along the line-of-sight and transverse to it. It is this velocity coherence which allows a deep, narrow absorption line to build up. Thus, it seems unlikely that the absorption is related to directly inflowing gas, feeding the nucleus, because the velocity is so similar over a region substantially larger than typical accretion regions.
On the other hand, the absorption features of comparatively low opacity but spanning a broader observed velocity range (to nearly km s-1) occur only towards W, which we believe is most likely to be at or close to the nucleus (see Sec. 5.3). It is plausible that this shows neutral hydrogen which is either being entrained by the inner jet of 2050+364, or is flowing out from the accretion region. Perhaps this atomic gas is related to the BLR in 2050+364, particularly since the H centroid, while subject to considerable uncertainty, is probably also at a negative velocity of a few hundred km s-1. The neutral gas, especially that part of it which happens to be visible in absorption, is likely to sample only a part of the velocity profile of the ionised gas. The broader part of the H i profile clearly has several distinct kinematic components (a possible representation with Gaussian lines is given in Fig. 6 and Table 2); the average opacity is . Assuming W to be uniformly covered gives a column depth integrated over the observed velocity range km s-1 to km s-1, of roughly cm-2. Making the further and surely oversimplified assumption that the absorbing atomic gas is also uniformly dense along a pathlength comparable to the total transverse extent of W (10 pc), then the atomic gas density would be cm-3, which is rather low. Unfortunately, with the EVN we cannot resolve region W at the frequency of the H i line. The optical BLR itself probably has an extent of at most 1 pc, so if the atomic gas were also confined to that region only, then its density would be perhaps two or three orders of magnitude higher, because the pathlength would decrease, the opacity and column depth would increase since the covering factor of W would be less than unity, and finally, close to the active nucleus the spin temperature could be significantly elevated.
Could the H i absorption arise instead outside the host galaxy of 2050+364 ? A chance superposition, in which the galaxy visible at the position of 2050+364 would be a foreground object rather than the host of the radio source, is a priori unlikely. Such a situation does exist for lensed radio sources, such as 0218+357, where the foreground lensing galaxy also leads to H i absorption (Carilli, Rupen, & Yanni carilli93 (1993)), but we do not think that the radio morphology of 2050+364 is suggestive of gravitational lensing.
Close to the radio position, two other galaxies of comparable brightness are visible in the images of Biretta et al. (biretta85 (1985) and O’Dea et al. (odea90 (1990)). One or both of these could be a true companion to the host galaxy of the radio source. The closer neighbour, in PA 180∘, is centred at a projected distance of only 2 arcsec (10 kpc at ), and so part of its disk could well be overlapping with the radio source in projection. The other one, centred at a projected distance of 7 arcsec (35 kpc at ) in PA ∘, seems to show an extension (a spiral arm ?) in the direction of the radio source, and this might be another candidate foreground absorber.
However, in any external absorber scenario considered, that other galaxy would probably have to be responsible for both the [O iii] line as well as the H i absorption, given the velocity correspondence to within 10 km s-1. But that would mean that the other galaxy may also have an active nucleus, or prodigious star-bursting activity, since strong [O iii] emission is not usually seen in ordinary galaxies. The optical spectrum shown in de Vries et al. (devries00 (2000)) suggests a high ratio of [O iii] to H, i.e., high ionisation gas. This would indicate ionisation by an AGN rather than a starburst. In our view the required coincidence of two active galaxies makes external absorber options much less plausible than the simple model discussed earlier that the H i absorption shows atomic hydrogen in the NLR and BLR associated with the compact radio source 2050+364.
6 Summary
We have presented and discussed VLBI continuum and spectral line data at 1049 MHz of the compact radio source 2050+364, and we have interpreted the multi-frequency continuum VLBI images of LF. Our conclusions can be summarised as follows:
– The continuum structure at 1049 MHz consists of a faint component N to the northeast, in addition to the two well-known components E and W, which constitute the original double; their flux density ratio is 3:1.
– The compact-double properties hold only over a limited frequency range. W, E, and N, in that order, have decreasing compactness, steepening low frequency spectral index, and decreasing peak frequency.
– Compactness and radio spectra, plus the alignment of substructures within W and E, suggest that 2050+364 is a one-sided core-jet originating at or near W, bending sharply (in projection) at E, and continuing towards N.
– At the high velocity end of the absorption spectrum is a deep H i line, which reaches a maximum opacity at E, with a FWHM of 13 km s-1. At W it is even narrower, with a FWHM of 10 km s-1 and somewhat lower opacity, . At N the opacity is . This absorption thus covers the entire source, extending over pc, albeit with significant differences in opacity. Implied column depths are cm-2.
– Extending to lower velocities is lower opacity H i absorption, which only covers W. The average opacity between km s-1 and km s-1 is , and the estimated column depth is cm-2.
– The centroid of the [O iii] optical doublet lines, , coincides to within 10 km s-1 with the distinct deep line at the high velocity end of the H i radio absorption line spectrum. The formal line centroid of the optical H line is at an observed velocity of km s-1 relative to [O iii].
– We believe that the uncommonly deep but also uncommonly narrow H i absorption line is likely to be due to atomic gas in the cores of NLR clouds in the inner kpc of 2050+364. Assuming NLR clouds of density cm-3 in a region with a 300 pc radius would imply their presence along 1 % of the line-of-sight. The direction of motion and/or rotation in the NLR of 2050+364 is coherent to 10 km s-1 over several hundred parsecs both along the line-of-sight and transverse to it, and is largely perpendicular to our line-of-sight.
– We believe that the lower opacity absorption at W ranging to km s-1 is likely to be due to atomic gas which is either being entrained in the inner parsecs of the jet of 2050+364, or is flowing out from the accretion region. It is plausibly related to the BLR in 2050+364. The atomic gas density is at least cm-3, for a 10 pc absorbing region, but could well be as much as three orders of magnitude higher if the region is smaller.
Acknowledgements.
The European VLBI Network is a joint facility of European, Chinese, South African and other astronomy institutes funded by their national research councils. The WSRT is operated by ASTRON (The Netherlands Foundation for Research in Astronomy) with support from the Netherlands Foundation for Scientific Research (NWO). The data were correlated at the NRAO, Socorro processor. This research has made use of the NASA/IPAC Extragalactic Database (NED), which is operated by the Jet Propulsion Laboratory, California Institute of Technology, under contract with the National Aeronautics and Space Administration in the United States of America. We thank Dr. Raffaella Morganti for useful discussions, and the referee, Dr. Seiji Kameno, for a very thorough report, which has led to considerable enhancements to this paper.References
- (1) Alexander, P., 2000, MNRAS, 319, 8
- (2) Beasley, A. J., Gordon, D., Peck, A. B., Petrov, L., MacMillan, D. S., Fomalont, E. B., Ma. C. 2002, ApJS, 141, 13
- (3) Bicknell, G., Dopita, M. A., O’Dea, C. P. 1997, ApJ, 485, 112
- (4) Biretta, J. A., Schneider, D. P, Gunn, J. E. 1985, AJ, 90, 2058
- (5) Carilli, C. L., Rupen, M. P., Yanny, B. 1993, ApJ, 412, L59
- (6) Carvalho, J. C. 1994, A&A, 292, 392
- (7) Carvalho, J. C. 1998, A&A, 329, 845
- (8) Conway, J. E., Pearson, T. J., Readhead, A. C. S., Unwin, S. C., Xu, W., Mutel, R. C. 1992, ApJ, 396, 62
- (9) Conway, J. E., Myers, S. T., Pearson, T. J., Readhead, A. C. S., Unwin, S. C., Xu, W. 1994, ApJ, 425, 568
- (10) Dennison, B., Thomas, M., Booth, R. S., Brown, R. L., Broderick, J. J., Condon, J. J. 1984, A&A, 135, 199
- (11) De Young, D. S. 1993, ApJ, 402, 95
- (12) de Vries, W. H., O’Dea, C. P., Barthel, P. D., Thompson, D. J. 2000, A&AS, 143, 181
- (13) Fanti, R., Fanti, C., Dallacasa, D., Schilizzi, R. T., Spencer, R. E., Stangehllini, C. 1995, A&A, 302, 317
- (14) Fey, A. L., Mutel, R. L. 1993, ApJ, 404, 197
- (15) Lazio, T. J. W., Fey, A. L. 2001, ApJ, 560, 698 (LF)
- (16) Gugliucci, N. E., Taylor, G. B., Peck, A. B., Giroletti, M. 2005, ApJ, 622, 136
- (17) Kameno, S., Inoue, M., Wajima, K., Sawada-Satoh, S., Shen, Z. 2003, PASA, 20, 213 (K03)
- (18) Mutel, R. L., Hodges, M. W., Phillips, R. B. 1985, ApJ, 290, 86
- (19) Mutel, R. L., Hodges, M. W. 1986, ApJ, 307, 472
- (20) O’Dea, C. P., Baum, S. A., Morris, G. B. 1990, A&AS, 82, 261
- (21) O’Dea, C. P., Baum, S. A. 1997, AJ, 113, 148
- (22) O’Dea, C. P. 1998, PASP, 110, 493
- (23) Owsianik, I., Conway, J. E. 1998, A&A, 337, 69
- (24) Phillips, R. B., Mutel, R. L. 1981, ApJ, 244, 19
- (25) Phillips, R. B., Mutel, R. L. 1982, A&A, 106, 21
- (26) Pihlström, Y. M., Conway, J. E., Vermeulen, R. C. 2003, A&A, 404, 871
- (27) Polatidis, A. G., Conway, J. E. 2003, PASA, 20, 69
- (28) Readhead, A. C. S., Taylor, G. B., Pearson, T. J., Wilkinson, P. N. 1996, ApJ, 460, 634
- (29) Risaliti, G. Woltjer, L. Salvati, M. 2003, A&A, 401, 895
- (30) Salgado, J. F., Altschuler, D. R., Ghosh, T., Dennison, B. K., Mitchell, K. J., Payne, H. E. 1999, ApJS, 120, 77
- (31) Shaffer, D. B., Kellermann, K. I., Cornwell, T. J. 1999, ApJ, 515, 558
- (32) Shepherd, M. C. 1997, in Hunt G., Payne H. E., eds., ASP Conf. Ser. Vol. 125, Astronomical Data Analysis Software and Systems VI. Astron. Soc. Pac., San Fransisco, p. 77
- (33) Snellen, I. A. G., Schilizzi, R. T., Bremer, M., de Bruyn, A. G., Miley, G. K., Röttgering, H. J. A., McMahon, R. G., Perze-Fournon, I. 1998, MNRAS, 301, 985
- (34) Snellen, I. A. G., Schilizzi, R. T., Miley, G. K., de Bruyn, A. G., Bremer, M., Röttgering, H. J. A., 2000, MNRAS, 319, 445
- (35) Tadhunter, C., Wills, K., Morganti, R., Oosterloo, T., Dickson, R. 2001, MNRAS, 327, 227
- (36) Vermeulen, R. C., Pihlström, Y. M., Tschager, W., de Vries, W. H., Conway, J. E., Barthel, P. D., Baum, S. A., Braun, R., Bremer, M. N., Miley, G. K., O’Dea, C. P., Röttgering, H. J. A., Schilizzi, R. T., Snellen, I. A. G., Taylor, G. B. 2003, A&A, 404, 861 (V03)
- (37) Wilkinson, P. N., Polatidis, A. G., Readhead, A. C. S., Xu, W., Pearson, T. J. 1994, ApJ, 432, L87
- (38) White, R. L., Becker, R. H., 1992, ApJS, 79, 331