The cluster relic source in A 521
Abstract
We present high sensitivity radio observations of the
merging cluster A 521, at a mean redsfhit z=0.247. The observations
were carried out with the GMRT at 610 MHz and cover a region of 1 square
degree, with a sensitivity limit of = 35 Jy b-1.
The most relevant result of these observations is the presence of a radio
relic
at the cluster periphery, at the edge of a region where group infalling into
the main cluster is taking place.
Thanks to the wealth of information available in the literature
in the optical and X–ray bands, a multi–band study of the relic and its
surroundings was performed. Our analysis is suggestive of a connection
between this source and the complex ongoing merger in the A 521 region.
The relic might be “revived’ fossil radio plasma through adiabatic compression
of the magnetic field or shock re–acceleration due to the merger events.
We also briefly discussed the possibility that this source is the result of
induced ram pressure stripping of radio lobes associated with the nearby cluster
radio galaxy J0454–1016a.
Allowing for the large uncertainties due to the small statistics,
the number of radio emitting early–type galaxies found in A 521
is consistent with the expectations from the standard radio luminosity
function for local
(z0.09) cluster ellipticals.
keywords:
radio continuum : galaxies , galaxies: clusters: general , galaxies: clusters: individual: A 521PACS:
98.65.Cw , 98.65.Hb , 95.85.Bh1 Introduction
Radio observations reveal that a number of galaxy clusters host diffuse synchrotron radio emission, not obviously associated with cluster galaxies, extended on cluster scale and referred to as radio halos and relics. These sources probe the presence of magnetic fields and relativistic particles mixed with the hot gas in the intracluster medium (ICM). A promising approach in our understanding of the nature of these sources is the possibility that turbulence and shocks induced by cluster mergers may be able to re–accelerate pre–existing electrons in the ICM, producing the emission from radio halos and relics (see the recent reviews by Brunetti 2003 and 2004, Sarazin 2004).
Both halos and relics are characterised by very low
surface brightness. They lack an obvious optical counterpart
and can reach sizes Mpc.
The class of radio halos is at present well defined (see
Giovannini & Feretti 2002 for a review).
Halos are detected in the central regions of galaxy clusters,
show a fairly regular shape, and are usually unpolarized.
They are characterised by steep integrated radio spectra,
i.e. 1 for S , although
the spectral index distribution may
show small scale inhomogeneities (Feretti et al. 2004).
High frequency spectral steepening is present in few cases
(Feretti 2005, Giacintucci et al. 2005).
Cluster relic sources are less homogeneous and more difficult to
classify, possibly due to our still limited knowledge
and understanding of their formation and evolution.
They are usually located in peripheral cluster regions,
and show many different morphologies (sheet, arc, irregular, toroidal).
At present 20 relics and candidates are known
(Kempner & Sarazin 2001; Giovannini & Feretti 2004),
however the observational information is still limited.
Their radio emission is usually highly polarized (up to 30%).
For those few sources with multifrequency imaging, a steep
integrated spectrum is found ( 1, up to ultra–steep
regimes).
All clusters known to host a radio halo
and/or a relic soure are found to show some degree of disturbance
in the distribution of the hot gas and of the optical galaxies
(Buote 2001, Schuecker et al. 2001,
Sarazin 2002). Some well studied and impressive examples are
for instance the radio halo in A 2163 (Feretti et al. 2001) and
the double relics in A 3667 (Roettiger et al. 1999) and
A 3367 (Bagchi et al. 2005).
It is interesting to point out that the observational link between cluster halos, relics and the merging phenomena has been outlined a posteriori. A different and promising approach is the a priori selection of clusters experiencing well studied merging events, in order to determine the occurence of halos and relics. As an example, deep radio observations of the merging chain of clusters in the core of the Shapley Concentration led to the discovery of a radio halo at the centre of A 3562, which is the faintest radio halo known to date (Venturi et al. 2000 and 2003, Giacintucci et al. 2004 and 2005), and given its very low surface brightness it would have not been detected in a “blind” radio survey.
In this paper we present Giant Metrewave Radio Telescope (GMRT) 610 MHz observations of the galaxy cluster A 521. This cluster was selected for the search of extended cluster scale radio emission on the basis of the wealth of optical (Maurogordato et al. 2000, hereinafter M00; Ferrari et al. 2003, hereinafter F03) and X–ray (Arnaud et al. 2000, hereinafter A00; Ferrari et al. 2005, hereinafter F05) information available in the literature, suggesting a very complex dynamical state. Furthermore, thanks to the amount of photometric and spectroscopic data available, A 521 is also an ideal environment to study the effects of cluster mergers on the radio emission properties of the member galaxy population, which is still controversial (see e.g. Venturi et al. 2000, Giacintucci et al. 2004, Owen et al. 1999, Miller & Owen 2003, Miller et al. 2003).
The observations presented here are part
of a much larger project carried out with a deep GMRT radio survey
at 610 MHz (Venturi et al. in prep.), whose aim is the search for radio
halos and relics in clusters at intermediate redshift (z=0.20.4),
to test current statistical expectations from models for the formation
of cluster radio halos (Cassano et al. 2004; Cassano & Brunetti
2005; Cassano et al. in prep.).
The outline of the paper is as follows: in Section 2 we
give a summary of the main properties of A 521 and its complex dynamical
state of merging; the 610 MHz observations and the data reduction are
described in Section 3; in Section 4
we present the radio source sample in the A 521 region;
in Section 5 we give the radio–optical identifications
and present the nuclear radio activity of cluster early–type
galaxies; the relic radio source is presented
in Section 6; the discussion is carried out in
Section 7; our conclusions are summarized in
Section 8.
Throughout the paper we assume km s-1 Mpc-1,
=0.3 and =0.7.
At the average redshift of A 521 (),
this cosmology leads to a linear scale of
1 arcsec= 3.87 kpc.
2 The cluster Abell 521
Abell 521 is a rich galaxy cluster, located at a mean redshift z=0.247. Its general properties are given in Table 1. Note that the cluster coordinates in the table are those of the ROSAT/HRI X–ray centre (A00); the X–ray luminosity (0.1–2 keV band) is from Böhringer et al. 2004 (REFLEX galaxy cluster catalogue); the velocity dispersion is from F03; the temperature value is taken from A00; the virial mass MV was computed from the LX–MV relation in Reiprich & Böhriger (2002), adopting the cosmology used in this paper; RV is the corresponding virial radius.
| RAJ2000 | 04h 54m 08.6s |
|---|---|
| DECJ2000 | 10∘ 14′ 39.0′′ |
| Bautz–Morgan Class | III |
| Richness | 1 |
| Redshift | 0.247 |
| (km s-1) | 1325 |
| LX (1044 erg s-1) | 8.178 |
| TX (keV) | 6.4 |
| MV (M⊙) | 1.8 1015 |
| RV (Mpc) | 2.8 |
Detailed X–ray (A00, F05) and optical studies of A 521 (M00, F03) revealed that the dynamical state of this cluster is very complex, since it is still undergoing multiple merging events. Figure 1 sketches the scenario proposed by these authors.
From the X–ray analysis A00 concluded that the main merger episode is occurring along the North–West/South–East direction (arrow in Fig. 1), between the main cluster (G11) and a northwestern compact group (G111), whose X–ray emissions are centered on RA=04h 54m 08.6s, DEC=10∘ 14′ 39.0′′ and RA=04h 54m 05.8s, DEC=10∘ 13′ 00.4′′ respectively. The gas mass ratio between G11 and G111 components is Mgas,main/M (A00). In their more recent analysis F05 reported a misalignment between the X–ray and optical merger axis.
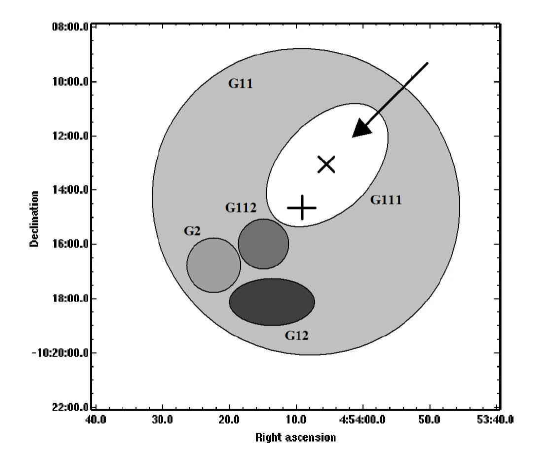
The study of the galaxy distribution and the substructure analysis carried out by F03 revealed the existence of many optical subclumps aligned along the merger direction. In particular these authors identified the following velocity groups along this axis (see Figure 1):
G11: the main cluster with a mean velocity v km s-1 and a velocity dispersion km s-1;
G111: a group dynamically bound to the brightest cluster galaxy (BCG), with a very low velocity dispersion ( km s-1) and a slightly higher mean velocity (v=74290 km s-1) as compared to the main cluster G11. This group is associated with the compact X–ray group detected by A00, which is probably falling onto the cluster from the NW direction. The small difference in the mean velocity between G111 and G11 suggests that the merging is likely to take place on the plane of the sky.
G112: a compact group bound to the cluster, whose velocity (v=74068 km s-1, km s-1) is similar to that of the infalling group G111. The virial masses estimated for G111 and G112 in F03 on the basis of the optical information are much smaller ( one order of magnitude) than that of the main cluster G11. We note that the mass ratios between G11 and the infalling groups estimated from the optical information are even larger than those derived from the X–ray data.
G12: the lowest mass group bound to A 521, with higher velocity galaxies (v=75730 km s-1, 120 km s-1).
G2: a group South–East of A 521, at a
projected distance of 900 kpc from the X–ray centre of the main
cluster G11. This group has a mean velocity of v=78418 km s-1
( 500 km s-1), which is much higher than the cluster
velocity. On the basis of the two–body criteria, F03 concluded that this
group is probably not bound to A 521.
Furthermore, F03 found also evidence of a filamentary structure
of galaxies in the central region of the cluster, extending
along the NE-SW direction, with velocity
v=73625 km s-1 and high velocity dispersion.
This structure has been interpreted by F03 as
evidence of an older merger, which occurred along a direction
orthogonal to the axis of the presently ongoing merger.
3 Radio observations
| Observation date | 7 – 8 January 2005 |
|---|---|
| 610 MHz | |
| 32 MHz | |
| RAJ2000 | 04h 54m 09s |
| DECJ2000 | –10∘ 14′ 19′′ |
| Primary beam | 43′ |
| Restoring beam, PA (full array) | 8.64.0′′, 57∘ |
| Total Obs.time | 3.5 h |
| rms | 35 Jy b-1 |
We observed the cluster A 521 at 610 MHz with the GMRT on 7 and 8 January 2005, using simultaneously the R (USB) and L (LSB) bands of 16 MHz each, for a total frequency band of 32 MHz. Table 2 gives the details of the observations.
The observations were carried out in spectral line mode, with 128 channels in each band, with a spectral resolution of 125 kHz.
The four data sets (7 and 8 Jan 2005, USB and LSB) were analysed individually. The data calibration and reduction were performed using the NRAO Astronomical Image Processing System (AIPS) package. The sources 3C 147 and 3C 48 were observed as primary calibrators at the beginning and at the end of the observations, to determine and correct for the bandpass shape and for the initial amplitude and phase calibration. The source 0447–220 was used as secondary phase calibrator and was observed every 20 minutes throughout the observation. In order to reduce the size of the data set, after the bandpass calibration the central channels of each data set were averaged to 6 channels of MHz each.
For each data set, images were produced using the wide–field imaging technique, with 25 facets covering a total field of view of square degree. After a number of phase self–calibration cycles, a final step was made, allowing for phase and amplitude corrections in order to improve the quality of the final images. The residual errors in the estimated flux density are 5.
The four self–calibrated data sets were then averaged from 6 channels to 1 single channel and finally combined together using the AIPS task DBCON. We note that bandwidth smearing is relevant only at the edge of the wide field, and does not affect the region presented and analysed here, i.e. the inner 30 (see Section 4). The images from the combined data set were obtained using again the wide–field imaging technique, combined with the task FLATN and finally corrected for the primary beam appropriate to the GMRT antennas at 610 MHz.
We produced images over a range of resolutions, reaching rms noise levels of the order of Jy b-1. For the purpose of the present paper we show only the image tapered to a resolution of 13.18.1′′, in p.a. 56∘. The 5 detection limit in this image, 0.20 mJy b-1, corresponds to a radio power limit of 3.5 W Hz-1.
4 The sample of radio sources
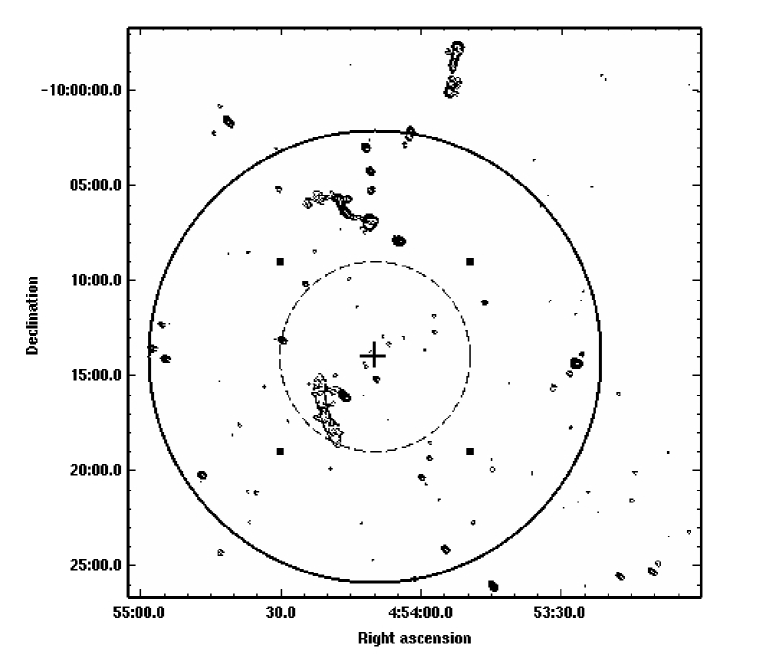
The total field of view of our observations is 1∘ 1∘, which is much larger than the cluster size. Here we present only a portion of the whole field, with size of 30, centered on RA=04h 53m 00 55m 00s and DEC= 55′ 00 25′ 00′′. At the cluster distance this corresponds to a region as large as Mpc2.
The 610 MHz radio emission from this region is shown in Figure 2. In the figure we also plotted a solid circle with a radius corresponding to the virial radius of A 521 (Tab. 1), and a dashed circle, representing the 5’ radius region covered by the redshift catalogues in M00 and F03. The cross marks the X-ray centre of the cluster (Tab. 1).
The radio emission from the A 521 region is dominated by point–like and marginally resolved sources. However, the whole field is characterised by the presence of three extended radio sources. Two of them (see Section 5.2) are located in the northern part of the field and are associated with early–type galaxies without redshift information. The elongated structure located South–East with respect to the cluster centre is the relic source discussed in Section 6.
We used the AIPS task SAD to identify sources in the final 13.1′′
8.1′′ image of A 521 (1= 40 Jy b-1).
Given a radio image, this task (1) finds all potential sources whose peak is
brighter than a given level; (2) Gaussian components are fitted; (3) positions
and flux density values are given. The task also produces a residual image,
which can be inspected to identify both extended sources not well fitted
by Gaussians, and sources with peak flux density lower than the previous
threshold.
As first step, we used SAD to find all sources with peak flux density
greater than 0.32 mJy b-1, i.e. 8 times the rms noise level in
the field. Then, on the residual image we searched for all sources with
peak flux densities in the range 5 – 8 (i.e. 0.20 – 0.32
mJy b-1). On this image we identified also the extended sources.
Each radio source of the list was then carefully inspected, and
the flux density values given by SAD for the unresolved or
marginally resolved sources were checked using the task JMFIT.
For the extended sources the flux density was obtained by means of TVSTAT.
The final list of radio sources (over the whole 1∘ 1∘ field), contains a total of 101 radio sources above the peak flux density limit of 0.20 mJy b-1; 52 radio sources out of the total are located in the 3030′ region shown in Figure 2, and are presented in Table 3, where we give:
columns 1, 2 and 3: respectively name (GMRT–) and J2000 position;
column 4 and 5: respectively peak and integrated flux density at 610 MHz, corrected for the primary beam attenuation. Note that the flux density given for the relic source (J0454–1017a) does not include the embedded point sources, whose flux density was estimated from the full resolution image (, see Table 1) and subtracted;
column 6: radio morphology. We classified the sources as unres.= unresolved and ext. = extended. Moreover we indicated as WAT a wide–angle–tailed morphology, D a double structure and Rel the relic source. For the double sources we give the position of the radio barycentre and for the extended sources we give the position of the radio peak.
| Name | RAJ2000 | DECJ2000 | Speak | Stot | Radio Morphology |
|---|---|---|---|---|---|
| GMRT | mJy b-1 | mJy | |||
| J04531023 | 04 53 02.69 | 10 23 12.0 | 0.74 | 0.89 | unres. |
| J04531020a | 04 53 14.19 | 10 20 05.4 | 0.54 | 0.67 | unres. |
| J04531021 | 04 53 14.97 | 10 21 33.0 | 0.68 | 0.91 | unres. |
| J04531015 | 04 53 17.70 | 10 15 58.0 | 0.53 | 0.59 | unres. |
| J04531014 | 04 53 26.84 | 10 14 19.7 | 74.43 | 96.56 | unres. |
| J04531019a | 04 53 44.72 | 10 19 55.2 | 0.48 | 0.78 | unres. |
| J04531011a | 04 53 46.43 | 10 11 09.3 | 0.72 | 0.79 | unres. |
| J04531022 | 04 53 48.85 | 10 22 43.5 | 0.45 | 0.64 | unres. |
| J04530957 | 04 53 52.14 | 09 57 59.0 | 4.84 | 49.73 | D |
| J04531024 | 04 53 54.80 | 10 24 08.2 | 3.72 | 4.59 | unres. |
| J04531012 | 04 53 57.05 | 10 12 41.7 | 0.51 | 0.54 | unres. |
| J04531011b | 04 53 57.23 | 10 11 51.2 | 0.35 | 0.52 | unres. |
| J04531018 | 04 53 58.04 | 10 18 32.1 | 0.42 | 0.43 | unres. |
| J04531019b | 04 53 58.21 | 10 19 21.4 | 0.89 | 0.90 | unres. |
| J04531020b | 04 53 59.87 | 10 20 21.1 | 1.47 | 1.54 | unres. |
| J04541002a | 04 54 02.26 | 10 02 07.0 | 3.68 | 9.11 | ext. |
| J04541002b | 04 54 03.45 | 10 02 50.1 | 0.73 | 1.02 | unres. |
| J04541013a | 04 54 03.60 | 10 13 00.1 | 0.33 | 0.33 | unres. |
| J04541007 | 04 54 04.40 | 10 07 53.5 | 16.43 | 36.77 | D |
| J04541013b | 04 54 06.90 | 10 13 20.7 | 0.32 | 0.47 | unres. |
| J04541012a | 04 54 08.15 | 10 12 55.0 | 0.31 | 0.46 | unres. |
| J04541015 | 04 54 09.53 | 10 15 09.6 | 1.47 | 1.49 | unres. |
| J04541005a | 04 54 10.79 | 10 05 16.0 | 1.21 | 2.33 | ext. |
| J04541004 | 04 54 10.82 | 10 04 14.1 | 5.99 | 7.69 | unres. |
| J04541013c | 04 54 10.94 | 10 13 43.6 | 0.27 | 0.33 | unres. |
| J04541014a | 04 54 11.66 | 10 14 33.2 | 0.30 | 0.47 | unres. |
| J04541002c | 04 54 11.82 | 10 02 59.00 | 5.37 | 7.46 | unres. |
| J04541014b | 04 54 12.08 | 10 14 19.6 | 0.33 | 0.42 | unres. |
| J04541011 | 04 54 13.71 | 10 11 21.9 | 0.30 | 0.37 | unres. |
| J04541013d | 04 54 13.93 | 10 13 31.4 | 0.24 | 0.28 | unres. |
|---|---|---|---|---|---|
| J04541009 | 04 54 15.39 | 10 09 53.8 | 0.47 | 0.47 | unres. |
| J04541005b | 04 54 15.68 | 10 05 42.8 | 1.84 | 2.89 | unres. |
| J04541016a | 04 54 16.28 | 10 16 05.9 | 22.93 | 27.56 | unres. |
| J04541006 | 04 54 16.33 | 10 06 16.4 | 23.84 | 104.36 | WAT |
| J04541019 | 04 54 19.34 | 10 19 53.2 | 0.37 | 0.38 | unres. |
| J04541017a | 04 54 20 | 10 17 00 | 41.9 | Rel. | |
| J04541016b | 04 54 21.02 | 10 16 44.2 | 1.77 | 3.85 | unres. |
| J04541017b | 04 54 22.34 | 10 17 11.9 | 0.71 | 1.13 | unres. |
| J04541008a | 04 54 22.79 | 10 08 26.9 | 0.38 | 0.38 | unres. |
| J04541010 | 04 54 24.73 | 10 10 09.4 | 1.01 | 1.04 | unres. |
| J04541013c | 04 54 29.60 | 10 13 08.2 | 4.48 | 4.55 | unres. |
| J04541005c | 04 54 30.41 | 10 05 09.8 | 1.14 | 1.27 | unres. |
| J04541021a | 04 54 35.33 | 10 21 10.0 | 0.59 | 0.67 | unres. |
| J04541008b | 04 54 36.97 | 10 08 30.0 | 0.39 | 0.40 | unres. |
| J04541001 | 04 54 41.14 | 10 01 37.6 | 16.54 | 24.35 | unres. |
| J04541024 | 04 54 42.89 | 10 24 17.5 | 0.70 | 0.93 | ext. |
| J04541002d | 04 54 44.20 | 10 02 11.6 | 0.75 | 0.95 | unres. |
| J04541020 | 04 54 46.79 | 10 20 14.5 | 4.31 | 5.68 | unres. |
| J04541014c | 04 54 54.60 | 10 14 06.5 | 5.42 | 6.82 | unres. |
| J04541012b | 04 54 55.54 | 10 12 16.7 | 1.44 | 1.98 | unres. |
| J04540955 | 04 54 57.27 | 09 55 41.5 | 1.64 | 2.46 | ext. |
| J04541013e | 04 54 57.55 | 10 13 33.0 | 3.82 | 5.24 | unres. |
We detected all the 20 radio sources found by A00 in their analysis of a portion of the 1.4 GHz NRAO VLA Sky Survey (NVSS, Condon et al. 1996) image, with a size similar to the field shown in Figure 2. We note that their sources labelled 12, 14 and 15 are part of the diffuse radio relic (see Section 6), and their sources labelled 7, 11 and 13 are part of the wide–angle tail described in Section 5.2. The remaining radio sources listed in Table 3 are either undetected or only marginally visible in the NVSS, due to the different resolution and the sensitivity limit of the NVSS survey (1=0.45 mJy b-1).
5 Optical Identifications
The sample of 52 radio sources presented in the previous section was cross–correlated with the Super COSMOS/UKST Southern Sky Object Catalogue (Hambly et al. 2001) and the APM Catalogue (Maddox et al. 1990), to search for optical counterparts. Radio/optical overlays (using the DSS–1) were visually inspected for all the candidate identifications, and for the remaining radio sources in the sample, in order to find possible optical counterparts lost by the incompleteness of these catalogues.
We estimated the reliability of the optical identifications on the basis of the parameter , which takes into account the uncertainty in the radio and optical positions:
where is the offset between the radio and optical coordinates, and and are the optical and the radio position errors respectively. We adopted a mean positional uncertainty of =1.5 arcsec for the optical catalogues (Unewisse et al. 1993), and with the parameters of our observations we estimated an average radio positional error of 1 arcsec both in right ascension and declination (Prandoni et al. 2000).
We considered reliable identifications all matches with , i.e. we assume that all matches are due to the random distribution of the positional errors, while for R 3 the difference between the optical and radio position is significant. For two sources we found , and therefore we cosidered them uncertain identification (see notes to Table 4). We found 21 radio–optical identifications (including the 2 uncertain cases), which correspond to of our radio source sample.
In order to find the sources associated with A 521 member galaxies, we cross–correlated our sample of identified sources with the redshift catalogues in M00 and F03. We note that these two catalogues do not cover the full region of analysed in the present paper, therefore our redshift search is actually restricted to a region of (1.1 Mpc) radius from the cluster centre (Fig. 2). This region includes 17 radio sources, 11 of which with an optical counterpart. Among these, 8 radio galaxies are located within the velocity range 70000 – 80000 km/s. One of them, however (J0454–1016b) is located in the group G2 (see Sect. 2), considered to be unbound in F03, therefore it will not be considered in the analysis presented in Sect. 5.3.
The list of the radio–optical identifications is reported in Table 4, where we give:
column 1: radio and optical name, where FMC and MBP stands for optical counterparts from F03 and M00 respectively;
columns 2 and 3: J2000 radio and optical coordinates;
column 4: integrated flux density at 610 MHz and magnitude given by the SuperCOSMOS or the APM catalogue when available, otherwise determined from the R magnitude adopting the (R–I)=0.77 colour for early–type galaxies at z=0.2 (Fukugita et al. 1995). The I magnitudes are corrected for a galactic absorption of AI=0.146 (Schlegel et al. 1998); if they were derived from the R magnitudes, we first corrected these latter using an absorption AR=0.201;
column 5: radio morphology and (R–I) colour from the SuperCOSMOS or the APM catalogue;
column 6: radio power at 610 MHz and radial velocity;
column 7: information about the galaxy type, and spectral features of the optical counterpart from M00 and F03 and parameter. Note that for the extended radio galaxies discussed in Section 5.2, no value of is given, due to the extended and complex radio morphology.
| Radio Name | RAJ2000 | DECJ2000 | Radio type | logP610MHz | optical notes | |
|---|---|---|---|---|---|---|
| GMRT | (mJy) | (W Hz-1) | ||||
| Opt. Name | RAJ2000 | DECJ2000 | I | (R–I) | v | |
| (km s-1) | ||||||
| J04531023 | 04 53 02.69 | 10 23 12.0 | 0.89 | unres. | ||
| 04 53 03.31 | 10 23 06.2 | 16.20 | 0.93 | 6.0 (*) | ||
| J04531015 | 04 53 17.70 | 10 15 58.0 | 0.59 | unres. | ||
| 04 53 17.62 | 10 16 00.6 | 18.59 | 0.17 | 1.6 | ||
| J04531019a | 04 53 44.72 | 10 19 55.2 | 0.77 | unres. | ||
| 04 53 44.45 | 10 19 58.7 | 15.58 | 0.93 | 2.9 | ||
| J04530957 | 04 53 52.14 | 09 57 59.0 | 49.73 | D | ||
| 04 53 53.07 | 09 58 35.4 | 16.76 | 1.00 | |||
| J04531024 | 04 53 54.80 | 10 24 08.2 | 4.59 | unres. | ||
| 04 53 55.25 | 10 24 15.4 | 5.3 (**) | ||||
| J04531012 | 04 53 57.05 | 10 12 41.7 | 0.54 | unres. | 22.96 | early–type |
| MBP20 | 04 53 57.00 | 10 12 44.9 | 16.67 | 0.94 | 73044 | 1.8 |
| J04531019b | 04 53 58.21 | 10 19 21.4 | 0.90 | unres. | ||
| 04 53 58.26 | 10 19 21.0 | 18.67 | 0.4 | |||
| J04541013a | 04 54 03.60 | 10 13 00.1 | 0.33 | unres. | 22.77 | early–type |
| MBP14 | 04 54 03.58 | 10 12 59.6 | 17.90 | 0.92 | 75146 | 0.3 |
| J04541013b | 04 54 06.90 | 10 13 20.7 | 0.47 | unres. | 22.92 | early–type, BCG |
| FMC65 | 04 54 06.84 | 10 13 23.3 | 16.19 | 1.10 | 74372 | 1.5 |
| J04541012a | 04 54 08.15 | 10 12 55.0 | 0.46 | unres. | 22.92 | early–type |
| MBP11 | 04 54 08.11 | 10 12 54.0 | 19.00 | 0.92 | 74873 | 0.6 |
| J04541015 | 04 54 09.53 | 10 15 09.6 | 1.49 | unres. | 22.85 | |
| FMC90 | 04 54 09.33 | 10 15 10.1 | 17.74 | 40747 | 1.7 | |
| J04541014a | 04 54 11.66 | 10 14 33.2 | 0.47 | unres. | 22.87 | late–type, OII,OIIIa,b,H |
| FMC105 | 04 54 11.72 | 10 14 35.3 | 18.93 | 0.63 | 70952 | 1.2 |
| J04541013d | 04 54 13.93 | 10 13 31.3 | 0.28 | unres. | 22.86 | OII, Balmer |
| FMC121 | 04 54 13.90 | 10 13 32.3 | 18.12 | 0.79 | 88714 | 0.6 |
| J04541016a | 04 54 16.28 | 10 16 05.9 | 27.56 | unres. | 24.69 | |
| FMC143 | 04 54 16.34 | 10 16 04.6 | 17.00 | 1.26 | 74282 | 0.9 |
| J04541006 | 05 54 16.28 | 10 06 16.4 | 103.36 | WAT | ||
| 05 54 16.05 | 10 06 24.6 | 16.69 | 0.91 | |||
| J04541016b | 04 54 21.02 | 10 16 44.2 | 3.85 | unres. | 23.88 | late–type, OII, H |
| FMC170 | 04 54 20.96 | 10 16 44.8 | 18.35 | 0.88 | 78326 | 0.5 |
| J04541017b | 04 54 22.34 | 10 17 11.9 | 1.13 | unres. | 23.28 | late–type, H |
| FMC178 | 04 54 22.35 | 10 17 13.4 | 17.20 | 0.75 | 72593 | 0.8 |
| J04541008a | 04 54 22.79 | 10 08 26.9 | 0.38 | unres. | ||
| 04 54 22.97 | 10 08 25.7 | 18.05 | 1.6 | |||
| J04541010 | 04 54 24.73 | 10 10 09.4 | 1.04 | unres. | ||
| 04 54 24.65 | 10 10 10.0 | 17.47 | 0.85 | 0.8 | ||
| J04541005c | 04 54 30.41 | 10 05 09.8 | 1.27 | unres. | ||
| 04 54 30.25 | 10 05 11.9 | 16.75 | 0.92 | 1.7 | ||
| J04541008b | 04 54 36.97 | 10 08 30.0 | 0.39 | unres. | ||
| 04 54 36.72 | 10 08 32.7 | 18.19 | 0.28 | 2.5 |
(*): this identification is uncertain since the candidate optical counterpart is misplaced with respect to the radio emission peak; (**): for the optical counterpart of this source only the magnitude bJ=21.71 is available. This galaxy falls within the radio contours of the source, but it is dislocated with respect to the emission peak.
5.1 Unresolved radio galaxies in the A 521 region
Among the 8 cluster radio galaxies (see Table 4), we found three late–type and four early–type galaxies. One of them, J0454–1013b, is associated with the Brightest Cluster Galaxy (FMC65). For the remaining source, J04541016a, no colour information is available, however on the basis of its featureless spectrum (F03), and of the (R–I)=1.26 colour (taken from the SuperCOSMOS catalogue), we can bona fide classify it as an early–type galaxy.
For the cluster radio galaxies we searched for segregation effects
both in the plane of the sky and in the velocity space.
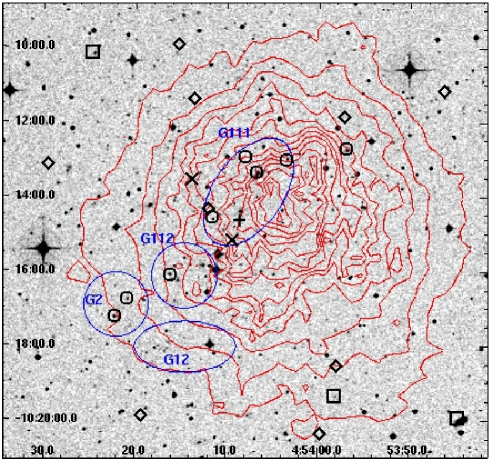
In Figure 3 we show the distribution
of the radio galaxies within 1.5 Mpc from the cluster centre,
overlaid on the DSS–1 optical image and the X–ray
isophotes from an archival ASCA observation ( 45 ks).
This X–ray image was extensively analysed in A00;
the purpose of its use here is to illustrate
the relative distribution of the hot gas and
the positions of the cluster radio galaxies.
The 8 radio galaxies of A 521 are represented by circles, while
the two radio galaxies at a redshift different from A 521
are indicated by x–points. Squares show the location of radio
sources identified with objects without redshift
information, and diamonds are radio sources with no optical
identification. Moreover the cross indicates the X–ray (ROSAT/HRI)
centre of the cluster (Tab. 1) and the blue large circles and ellipses
represent the dynamical groups of optical galaxies
found by F03 ( Section 2, Fig. 1). The misplacement between
the ROSAT cluster centre and the peaks of the ASCA isophotes
can be explained as due to the lower resolution of the ASCA image,
combined with the large uncertainties in the positional accuracy
(A00).
It is clear that the radio galaxy distribution in A 521 is not random. In particular, all the radio galaxies within the cluster X–ray emission are aligned along the NW–SE axis, which is the suggested direction of the ongoing merger (A00, F05). On the other hand, no radio galaxy was detected along the old merger axis (roughly perpendicular to the NW–SE axis), where F03 found a ridge of high optical density. We note that a similar situation (at least in projection onto the plane of the sky) is found in A 2255 (Miller & Owen 2003), where the radio galaxies are distributed along the merger axis.
In Figure 4 the velocity distribution of
the radio galaxies in A 521 is compared to the
distribution of the whole velocity sample in M00
and F03 with secure velocity measurement.
Objects corresponding to late–type radio galaxies are marked as
black bins, the early–type radio galaxies are indicated by the dashed bin.
The early–type objects are all found in the bins containing
the bulk of the cluster galaxies, while the late–type
radio galaxies are at the edge of the velocity distribution,
even excluding the G2 member from these qualitative considerations.
In particular, the three radio galaxies in the northern part
of the G111 group (the BCG group, associated with the
group detected in the X–ray) and the source belonging to
G112 (see Figure 3) are all early–type galaxies,
and are within a narrow range in velocity, i.e. 7428275146 km s-1.
F03 already noted that G111 and G112 are essentially at
the same velocity within 200 km s-1 (Sect. 2).
The remaining early–type radio galaxy of A 521 is the
westernmost optical identification in Figure 3
and has a lower velocity (73044 km s-1), consistent
in redshift with the main cluster G11 (Fig. 1).

Among the late–type radio galaxies, one is located within the G111 group boundary (see Figure 3), but has a significantly lower velocity with respect to the group. The remaining two sources are embedded in the relic emission (Section 6) and projected within the G2 group. Of these two, J04541016b (the northwestern one) has a velocity consistent with the group, which is probably unbound to A 521, while the velocity of the other is significantly lower and consistent with the main cluster.
All the radio galaxies in A 521 have low radio power, exception made for J0454–1016a, located in projection close to the radio relic (see Table 4 and Figure 5), with logP610MHz (W Hz-1) = 24.69. Interestingly, two late–type radio galaxies are more powerful than the early–type ones, suggesting enhanced star formation. Unfortunately, the data available in the literature do not allow to confirm this possibility.
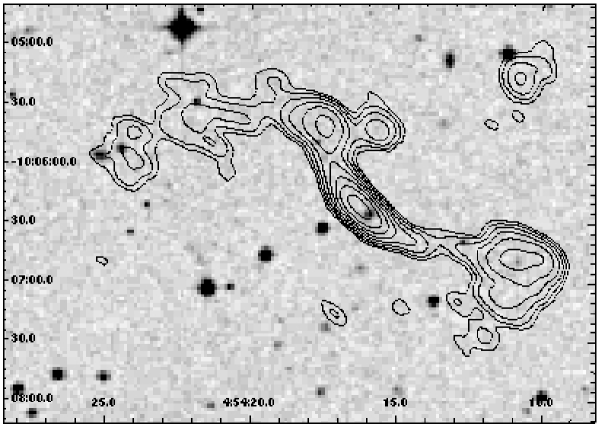
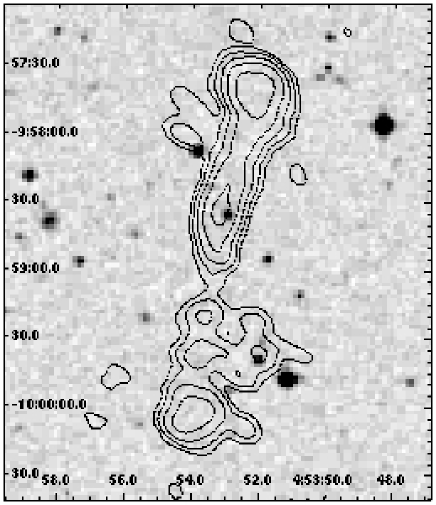
5.2 Extended radio galaxies in the A 521 region
The radio galaxy population in A 521 is dominated by point–like
low power objects. However, two extended radio galaxies are well
visible in the northern region of the field
of Figure 2. Their radio emission is overlaid on the DDS–1
in Figs. 6 (J0454–1006) and 7 (J0453–0957).
Unfortunately, no redshift information is
available for the two optical counterparts, whose apparent magnitude is
similar to that of the brightest cluster galaxies. Their (BI)
colour, derived from the SuperCOSMOS catalogue,
is in very good agreement with the red sequence of the elliptical
galaxies of the cluster, i.e. (see Fig.15 in F03).
In particular, for
J0454–1006 (B–I)=2.47 and for J0453–0957 (B–I)=2.64, therefore
they might be part of A 521, despite the large distance from the cluster
centre.
If we assume that they are located at the average cluster distance,
their total radio power is
logP610MHz= and logP610MHz=
for the wide–angle–tail J0454–1006 and the source J0453–0957 respectively.
These values are consistent with their radio structure, typical
of intermediate power radio galaxies.
The tailed morphology of J0454–1006 is
suggestive of interaction between the radio plasma and the external
medium. Furthermore, even though this source is outside the
boundary of the cluster X–ray emission (Figs. 3 and
8), it is projected at a distance within the virial
radius of A 521 (Tab. 1, Fig 2). Therefore
its distorted radio structure may be the result of a recent accretion
at the cluster virial radius. On the contrary, the morphology of J0453–0957,
which is outside the virial radius, appears undisturbed.
5.3 AGN activity in A 521
In order to understand if the ongoing merger event in A 521 has significant effect on the radio emission of the AGN cluster population, it is useful to compare the number of observed radio galaxies in this merging environment with the number expected from the the radio luminosity function (RLF) for early–type galaxies in normal clusters and in the field. As reference we used the RLF at 1.4 GHz computed by Ledlow & Owen 1996, hereinafter LO96) for early–type galaxies in a sample of local Abell clusters. We are aware that the reference luminosity function was computed with a sample of clusters at lower redshift, i.e. z0.09. Unfortunately, no statistical information on the RLF of cluster radio galaxies at the redshift of A 521 is available at present. This point will be further addressed in Section 7.
The analysis carried out by LO96 includes all radio galaxies within 0.3 Abell radius (RA), with logP1.4GHz (W Hz-1) 22.03 and optical counterpart brighter than MR=20.5. This magnitude limit corresponds to mR=19.8 at the distance of the cluster A 521, and to the limit Ilim=19.0, adopting the (RI) = 0.77 colour for early–type galaxies at redshift z=0.2, reported in Fukugita et al. 1995).
For full consistency with LO96 we restricted our analysis to the inner 0.3 RA, which corresponds to 2.9 arcmin at the redshift of A 521. The detection limit of our observations, i.e. 0.20 mJy, corresponds to logP (W Hz-1) = 22.14 in the cosmology of LO96 and assuming a spectral index (Condon 1992). In order to avoid our incompleteness in their first radio power bin, we compared the predictions from LO96 and our detections for logP1.4GHz (W Hz-1) 22.43, which corresponds to a flux limit S610MHz 0.36 mJy (in our cosmology and again assuming ).
Three early–type radio galaxies of A 521 match the above constraints for the radio power and the optical magnitude, i.e. of the total.
The total number of early–type galaxies belonging to A 521 can be derived using the information in F03. A fraction of of their spectroscopic sample is composed by early–type galaxies, and for I Ilim, of these objects are cluster members (see Figure 2 in F03). We corrected the number of early–type cluster galaxies for the incompleteness of the F03 spectroscopic sample, which is up to Ilim. We obtained that the total number of galaxies in the A 521 region brighter than Ilim is 131, of which 112 belonging to the cluster. Taking all these constraints into account, we end up with 64 early–type members in the inner 0.3 RA of A 521.
On the basis of LO96, the expected number of radio emitting early–type galaxies is 6, i.e. of the total.
Allowing for the large poissonian uncertainties given by the small numbers we are dealing with, our 3 detections are consistent with the expectations from LO96 well within 1.
In Sect. 5.1 we pointed out the preferred location of the radio galaxies along the NW–SE axis. Unfortunately, the incomplete optical information (i.e. non–uniform coverage of A 521, see F03) does not allow any consideration on the connection between the distribution of the radio galaxies and that of the early–type objects in the cluster.
6 The relic source in A 521
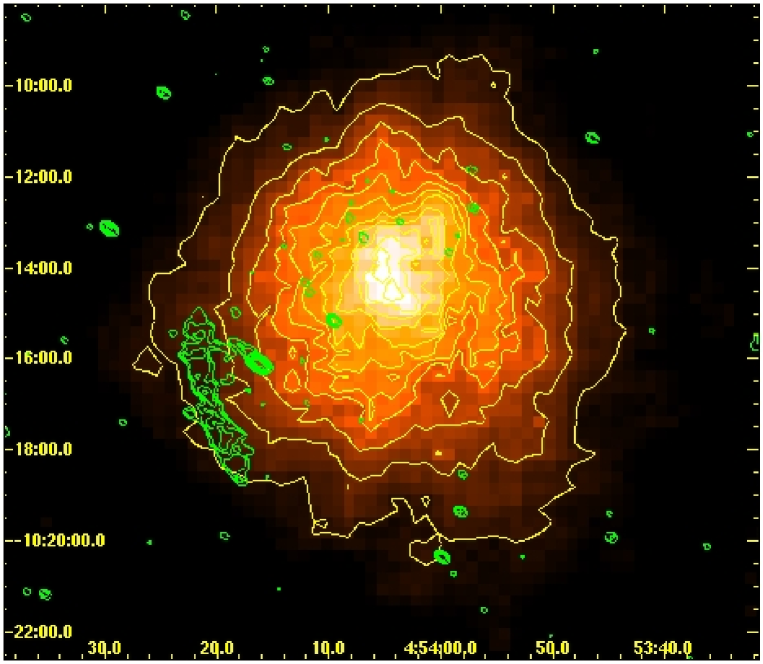
The most remarkable feature of A 521 is the presence of a region of diffuse radio emission (Fig. 5) in the south–eastern peripheral part of the cluster, at a projected distance of arcmin (i.e. 930 kpc) from the A 521 centre, and at the border of the X–ray emission of the cluster (Figure 8).
| S610MHz (mJy) | 41.92.1 |
|---|---|
| S1400MHz (mJy) | 16.21.5 |
| 1.140.16 | |
| Linear size (kpckpc) | 930 200 |
| axial ratio | 4.5 |
| d (arcmin)1 | 4 |
| P610MHz (1024 W Hz-1) | 8.13 |
| P1400MHz (1024 W Hz-1) | 3.09 |
| B (G) 2 | 1.3 |
1 distance from the cluster centre
2 see Section 6
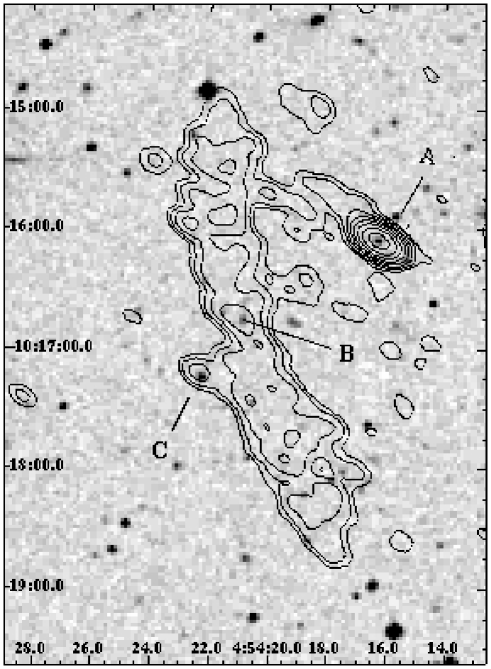
The morphology of the source (labelled J0454–1017a in Table 3) is arc–shaped and highly elongated. Its total angular size along the major axis is , corresponding to a linear size of 930 kpc, and its largest transversal angular size is only , corresponding to 200 kpc. This source was first detected at 1.4 GHz with the Very Large Array (VLA) by Ferrari (2003), and an image is given also in the appendix of F05.
The resolution of the radio image in Figs. 5 and 8 is high enough to rule out the possibility that this object is a blend of different radio sources. If we exclude the cluster radio galaxies embedded in the diffuse emission (the point sources A, B and C in Fig. 5 and Table 4), the extended radio source does not appear to be associated with any optical counterpart.
The size and the radio morphology, as well as the
lack of an optical identification, suggest that
the diffuse radio source located at the outskirts of
A 521 can be included in the class of cluster relics.
Fig. 5
also shows that the cluster radio galaxy A (J0454–1016a, the most powerful
source in A 521) is located only away
from the relic (in the plane of the sky), and a faint bridge of radio
emission connects the two sources. Even though projection effects in
A 521 should be taken into account, we note that this situation is similar to
what is found in the Coma cluster, where a bridge of radio emission connects the
tails of the radio galaxy NGC 4789 and the prototype relic source
1253+275 (Giovannini et al. 1991).
In order to properly determine the value of the total flux density of the relic at 610 MHz, we integrated over the whole region covered by its emission and subtracted the flux density of the embedded point–sources (see Section 4). The flux density is S610MHz= 41.92.1 mJy, which gives a radio power logP610MHz (W Hz-1) = 24.91.
Using the NVSS information, we estimated the total spectral index of the relic between 610 MHz and 1400 MHz. The NVSS flux density at 1400 MHz is S1400MHz=16.21.5 mJy (after subtraction of the embedded point sources), and therefore .
A zero–order estimate of the energy density of the relativistic plasma and magnetic field associated with the relic can be obtained under the assumption of minimum energy conditions (e.g. Pacholczyk 1970). Assuming a power law spectrum for the electrons with slope (), and the classical minimum energy equations (normally computed in the frequency range between =10 MHz and =100 GHz), we obtained an equipartition magnetic field Beq=0.4 G. However, we note that for this value of , the electrons with Lorentz factor emit at 10 MHz, and thus the contribution of electrons with to the total energy density is not taken into account. A more accurate approach is given by adopting equipartition equations with a low energy cut–off in the electron energy distribution (not in the emitted synchrotron spectrum). Using the equations given in Brunetti et al. 1997), we derived the following value for the magnetic field:
with expressed in G. The parameters of the relic source are given in Table 5 ( given for ).
Both values of the equipartition magnetic field are in agreement with the estimates found in the literature for radio relic sources and cluster radio halos, i.e. in the range 0.1 – 1 G (see the review by Govoni & Feretti 2004).
7 Discussion
The main results of our 610 MHz GMRT study of A 521 can be summarized as follows.
i) We detected a relic source, whose projected location is just at the boundary of the X–ray emission from the intracluster gas (Section 6);
ii) We compared the number of detected radio loud AGN with
the expectations from the radio luminosity function by LO96
(inner 0.3 RA and logP(W Hz 22.43)
and found 3 objects, to be compared to the 6 expected (Section 5.3).
Point (i) is by far the most relevant.
In the following we will discuss these results
in the light of the assessed ongoing merger in this galaxy cluster.
7.1 Cluster merger and AGN/starburst radio activity
Our analysis on the cluster radio galaxies showed that the number of radio emitting early–type galaxies in the A 521 is consistent with the expectations from the standard RLF (3 against 6) if we allow for the large uncertainties due to the very small number statistics. Such comparison should be taken with care, since it is done with the local (z0.09) radio luminosity function for cluster ellipticals (see Section 5.3), while A 521 is at redshift 0.247. However, this result is striking if we take into account the positive evolution of the RLF for X–ray selected high redshift clusters (Stocke et al. 1999, Branchesi et al. 2005), and leads us to safely conclude that the multiple merger events in A 521 are not increasing the probability of an early–type galaxy to develop a nuclear radio source compared to other less extreme environments, as already found in the complex merging environment of A 3558, in the central region of the Shapley Concentration (Venturi et al. 2000; Giacintucci et al. 2004).
The optical analysis of F03 showed that the late–type star forming galaxies, are preferentially located on the axis perpendicular to the direction of the merger (see Fig. 1). The radio power limit in our observations (logP610MHz (W Hz-1)= 22.54) favours the detection of AGNs, so very little can be inferred on the role of the ongoing merger on the starburst activity in this cluster. However, if we consider logP610MH (W Hz-1) = 23 as a reasonable upper limit for the radio emission from starburst galaxies (e.g. Condon 1992), we can conclude that no major starburst emission is detected. Unfortunately, no information on the infrared flux of the late–type radio galaxies in our sample is available in the literature to give support to our conclusions.
7.2 The merging events in A 521 and the formation of the relic
The most important result of this paper is the detection of the relic source, which gives further observational support to the hypothesis of a close connection between cluster mergers and relic radio emission. The relic in A 521 is located in projection at the border of the cluster X–ray emission. It is slightly inclined with respect to the outer ring of the ASCA X–ray isophotes (see Fig. 8).
A number of models have been proposed to explain the origin of radio relics. All these models invoke a connection between these sources and the presence of a shock within the X–ray gas driven by a merging episode (see for instance Markevitch et al. 2005). Simulations of cluster mergers (Ricker & Sarazin, 2001) show that the merging of two subclusters leads to the formation of two shocks (front and back shock).
A 521 has a complex dynamics. The main cluster has a mass of the order of 1015 M⊙ and has been undergoing multiple minor merging events with groups whose mass is 1/10 lower. Using the dynamical analysis of M00, F03 and F05, and from inspection of Figure 1, a possible scenario is that the group G111 is falling onto the main cluster G11, coming from North–West. Furthermore, the presence of the two optical groups G12 and G112 south of the central part of the cluster (see Figs. 1 and 3) suggests that also the southern part of the cluster region may be dynamically active.
7.2.1 Merger shock
One possibility is that relativistic electrons are accelerated from the thermal pool by the passage of a strong merger shock (Ensslin et al. 1998, Röttgering et al. 1997). In this case the spectrum of the emitting electrons111We do not consider the case of reacceleration of a pre-existing population of relativistic electrons (see Markevitch et al. 2005 for a detailed discussion). is related to the Mach number of the shock by
(e.g. Blandford & Eichler 1987). Here we include also the effect of particle aging , which comes out from the combined effect of Inverse Compton energy losses and continuous injection. In the case of A 521 the spectral index of the relic is , which gives , and the requested Mach number of the shock is .
7.2.2 Adiabatic compression
A second possibility is adiabatic compression of fossil radio plasma by a merger shock (Ensslin & Gopal–Krishna 2001, hereinafter EG–K01). In this case, the numerical 3–D MHD simulations by Ensslin & Brüggen (2002, hereinafter EB02) predict a variety of radio morphologies and polarization properties, which may be reasonably well matched by the available high sensitivity radio images. Another important requirement in this scenario is the presence of an active radio galaxy in the proximity of the relic. This constraint is satisfied in A 521, where the radio galaxy J0454–1016a is located only 1.5′ from the relic, i.e. a projected distance of 350 kpc. A previous cycle of activity of this radio galaxy could have provided the fossil radio plasma in the ICM, revived by the shock compression.
7.2.3 Ram pressure stripping
Finally, another appealing possibility is that the relic in A 521 is the
result of ram pressure stripping of the radio lobes of J04541016a
(a) by group merger in the southern cluster region, or
(b) by the infalling of J04541016a itself through G11.
This scenario requires that the internal pressure of the lobes
is significantly smaller than the external ram pressure, i.e.
where is the infalling velocity in units
of 1000 km s-1,
is the density of the intracluster medium,
and is the number density in units of particle cm-3.
The projected distance of J04541016a from the relic
( kpc) requires a time of the order of
to be crossed by the ICM of any merging group (case (a)), or by J0454–1016a itself (case (b)). We note that in (a) we assume that the core position of J0454–1016a is not affected by the group merger dynamics. In order to allow the electrons in the radio lobes to still emit in the radio band, the time should be smaller than the life–time of the radiating electrons. This implies 3000 km/s. Such velocity leads to a Mach number 2 for the merging group, or for J0454–1016a.
7.3 Is there a shock in the external region of A 521?
All the possibilities given above to explain the formation of a radio relic require the presence of a shock in the external region of A 521, with Mach number in the range 2 4. In search for an observational signature of a shock in the relic region we re–analysed the public archive Chandra ACIS–I (39 ksec, OBSID 901) and ACIS–S (39 ksec OBSID 430) observations, analysed also in F05. We point out that the work in F05 is mainly restricted to the central and northern part of the cluster, and does not include the region which is relevant to the present discussion.
We processed tha data using CIAO 3.2 and the newest calibration
database CALDB 3.1.0.
On the (0.5–5) keV background–subtracted
and exposure–corrected image of the cluster, we extracted the
radial X–ray surface brightness profile perpendicular to the relic source,
using a 80∘ sector centered on the cluster centre and containing
the relic.
The X–ray brightness profile does not show any evidence in
support of the existence of a shock front at the projected location of
the relic. This result is consistent with what we found in
re–analysing the archive ASCA data (see also Fig. 8).
We point out, however, that this is not enough to rule out a connection
between the relic and the presence of a shock. Two more issues
should be considered. In particular:
(a) the relic is very peripheral, therefore the cluster X–ray surface
brightness is very low here, and deeper X–ray imaging is necessary to
investigate the presence of a shock; (b) projection effects
should also be taken into account in the analysis. We defer a detailed
discussion on this point to a future paper.
8 Summary
In this paper we presented high sensitivity observations of the cluster of galaxies A 521, carried out at 610 MHz with the GMRT. The cluster is known to have a complex dyamics, and the radio emission from the cluster was analysed in detail, using the multiband (X–ray and optical) information available in the literature.
We found that the AGN activity in the cluster is consistent with the local RLF for cluster ellipticals within the large poissonian errors, i.e. we have 3 detections out of 6 expected sources. This result suggests that the multiple merging events in A 521 are not increasing the AGN radio activity in the early–type population compared to other environments.
A radio relic was detected at the cluster periphery, and a
few possible scenarios for the presence of this relic were
discussed.
One possibility is that the relic is connected to the
presence of shock waves induced by the merger.
Such shocks may have accelerated relativistic electrons or “revived”
fossil radio plasma
through adiabatic compression of the magnetic field or shock re–acceleration.
The presence of an active cluster radio galaxy in the proximity of
the relic suggests that the “revived” plasma might be connected to
previous cycles of activity in this object. The radio properties of
the relic require a high Mach number for such shock.
Another possible explanation is ram pressure stripping of radio
lobes associated with the nearby radio galaxy J0454–1016a as a
consequence of group infalling/merger. We showed that
the projected distance between the relic and the radio galaxy
may be in reasonable agreement with the age of the radiating electrons
in such sources.
An analysis of public archive Chandra data does not provide
observational evidence for the presence of a shock at the location of
the relic, however projection effects should be taken into account
for an accurate study.
We thank the staff of the GMRT for their help during the observations.
GMRT is run by the National Centre for
Radio Astrophysics of the Tata Institute of Fundamental Research.
G.B. and R.C. acknowledge partial support from MIUR from grant
PRIN2004. The authors wish to thank P. Mazzotta for insightful discussions
and help with the analysis of the X–ray archive data.
References
Arnaud M., Maurogordato S., Slezak E., Rho J., 2000, A&A, 355, 461 (A00)
Bagchi J., Durret F., Neto G., Surajit P., Chavan S., 2005, 29th International Cosmic ray Conference, Pune, in press (astro–ph/0508013)
Blandford R. & Eichler D., 1987, Phys. Rep., 154, 1
Böhringer H., Schuecker P., Guzzo L., Collins C. A., Voges W., Cruddace R. G., Ortiz-Gil A., Chincarini G., De Grandi S., Edge, A. C, 2004, A&A, 425, 367
Branchesi M., Gioia I.M., Fanti C., Fanti R., Perley, R.A., 2005, A&A, in press (astro–ph/0509138)
Brunetti G., Setti G., Comastri A., 1997 A&A, 325, 898
Brunetti G., 2003, in Matter and Energy in Clusters of Galaxies, ASP Conf. Series 301, p.349
Brunetti G., in Outskirts of galaxy clusters: intense life in the suburbs, 2004, IAU colloquium 195, Ed. A. Diaferio,Cambridge Univ. Press, p.148
Buote D.A., 2001, ApJ, 553, L15
Cassano R., Brunetti G., Setti G., 2004, JKAS, 37, 589
Cassano R., Brunetti G., 2005, MNRAS, 357, 1313
Condon J.J., 1992, A&A Rev., 30, 575
Condon J.J., Cotton W.D., Greisen E.W, et al., 1996, ADIL, JC, 01
Ensslin T.A., Biermann P.L., Klein U., Kohle S., 1998, A&A 332, 395
Ensslin T.A., Brüggen M., 2002, MNRAS, 331, 1011 (EB02)
Ensslin T.A., Gopal–Krishna, 2001, A&A, 366, 26 (EG–K01)
Feretti L., Orrú E., Brunetti G., Giovannini G., Kassim N., Setti G., 2004, A&A, 423, 111
Feretti L., Fusco–Femiano R., Giovannini G., Govoni G., 2001, A&A, 373, 106
Feretti L., 2005, in X-ray and Radio Connections, eds. L.O. Sjouwerman & K.K Dyer, astro-ph/0406090
Ferrari C., 2003, Ph.D. Thesis, University of Nice–Sophia Antipolis, France
Ferrari C., Arnaud M., ettori S., Maurogordato S., Rho J., 2005, A&A, in press (astro–ph/0508585) (F05)
Ferrari C., Maurogordato S., Cappi A., Benoist C., 2003, A&A, 399, 813 (F03)
Fukugita, M., Shimasaku, K., & Ichikawa, T., 1995, PASP, 107, 945
Giacintucci S., Venturi T., Bardelli S., Dallacasa D., Zucca E., 2004, A&A, 419, 71
Giacintucci S., Venturi T., Brunetti G., Bardelli S., Dallacasa D., Ettori S., Finoguenov A., Rao A.P., Zucca E., 2005, A&A, 440, 867
Giovannini G., Feretti L., Stanghellini C., 1991, A&A, 252, 528
Giovannini G., Feretti L., 2002, in Merging Processes in Galaxy Clusters, ed. L. Feretti, I.M. Gioia, G. Giovannini, ASSL, 272, 197
Giovannini G., Feretti L., 2004, JKAS, 37, 323
Govoni F., Feretti L., 2004, Journal of Mod. Phys., Vol. 13, Issue 8, p. 1549
Hambly, N. C., MacGillivray, H. T., Read, M. A., Tritton, S. B., Thomson, E. B., Kelly, B. D., Morgan, D. H., Smith, R. E., Driver, S. P., Williamson, J., Parker, Q. A., Hawkins, M. R. S., Williams, P. M., Lawrence, A. 2001, MNRAS, 326, 1279
Kempner J.C., Sarazin C.L., 2001, ApJ, 548, 639
Ledlow M.J. & Owen F.N., 1996 ApJ, 112, 9 (LO96)
Maddox S.J., Efstathiou G., Sutherland W.J., Loveday J. 1990, MNRAS, 243, 692
Markevitch M., Govoni F., Brunetti G., Jerius D., 2005, ApJ, 627, 733
Maurogordato S., Proust D., Beers T.C., Arnaud M., Pelló R., Cappi A., Slezak E., Kriessler J.R., 2000, A&A, 355, 848, (M00)
Miller N.A., Owen F.N., Hill J.M., 2003, AJ, 125, 2393
Miller N.A., Owen F.N., 2003, AJ, 125, 2427
Owen F.M., Ledlow M.J., Keel W.C., Morrison G.E., 1999, AJ, 118, 633
Pacholczyk A.G., Radio Astrophyisics, 1970, Freeman Eds.
Prandoni I., Gregorini L., Parma P. et al. 2000, A&AS, 146, 41
Reiprich T.H. & Böhringer H., 2002, ApJ, 567, 716
Ricker P. M. & Sarazin C. L., 2001, ApJ, 561, 621
Roettiger K., Burns J.O., Stone J.M., 1999, ApJ, 518, 603
Röttgering H.J.A, Wieringa M.H., Hunstead R.W., Ekers R.D., 1997, MNRAS 290, 577
Sarazin C.L., 2002, in Merging Processes in Galaxy Clusters, ed. L. Feretti, I.M. Gioia, G. Giovannini, ASSL, 272, 1
Sarazin C.L., 2004, in X–ray and radio connections meeting, ed. L. O. Sjouwerman & K. K. Dyer, astro–ph/0406181
Schlegel D.J., Finkbeiner D.P., Davis M., 1998, ApJ, 500, 525
Schuecker P., Bhringer H., Reiprich T.H., Feretti L., 2001, A&A, 378, 408
Stocke J.T., Perlman E.S., Gioia I.M., Harvanek M., 1999, AJ 117, 1967
Unewisse A.M., Hunstead D.W. & Pietrzynski B., 1993, Publ. Astron. Soc. Austr., 10, 229
Venturi T., Bardelli S., Morganti R., Hunstead R.W., 2000, MNRAS, 314, 594
Venturi T., Bardelli S., Dallacasa D., Brunetti G., Giacintucci S., Hunstead R.W., Morganti R., 2003, A&A, 402, 913