Vertical distribution of Galactic disk stars: ††thanks: Based on observations made at the Observatoire de Haute Provence (France). Based on data from the Hipparcos astrometry satellite.
We used red clump stars to measure the surface mass density of the Galactic disk in the solar neighbourhood. High resolution spectra of red clump stars towards the NGP have been obtained with the ELODIE spectrograph at OHP for Tycho-2 selected stars, and nearby Hipparcos counterparts were also observed. We determined their distances, velocities, and metallicities to measure the gravitational force law perpendicular to the Galactic plane. As in most previous studies, we applied one-parameter models of the vertical gravitational potential. We obtained a disk surface mass density within 1.1 kpc of the Galactic plane, , with an excellent formal accuracy, however we found that such one-parameter models can underestimate the real uncertainties. Applying two-parameter models, we derived more realistic estimates of the total surface mass density within 800 pc from the Galactic plane, = 57-66, and within 1.1 kpc, = 57-79. This can be compared to literature estimates of 40 in stars and to 13 in the less accurately measured ISM contribution. We conclude that there is no evidence of large amounts of dark matter in the disk and, furthermore, that the dark matter halo is round or not vey much flattened.
A by-product of this study is the determination of the half period of oscillation by the Sun through the Galactic plane, Myr, which cannot be related to the possible period of large terrestrial impact craters 33-37 Myr.
Key Words.:
Stars: kinematics – Galaxy: disk – Galaxy: fundamental parameters – Galaxy: kinematics and dynamics – Galaxy: structure – solar neighbourhood1 Introduction
This paper is the extension of the previous works published by Soubiran et al. (sou03 (2003), hereafter Paper I) and Siebert et al. (sie03 (2003), hereafter Paper II), which probed the properties of red clump stars within 100 pc of the Sun and at larger distances towards the North Galactic Pole (NGP). We obtained a new determination of the local surface mass density. We discuss this new result with respect to recent works, and we comment on the different ways the uncertainties have been estimated and the resulting consequences for the estimated mass density of the Galactic disk.
Since the pioneering works of Kapteyn (kap22 (1922)) and, later, Oort (oor32 (1932, 1960)), regular improvements have been obtained in determining the vertical Galactic potential, thereby allowing one to constrain the determination of the total volume mass density in the solar neighbourhood, now called the Oort limit. Two decades ago, a seminal improvement was achieved by Bahcall (bah84 (1984)), who built a consistent Galactic vertical potential linked to current knowledge of the kinematics and the density distributions of stellar populations. Bienaymé et al. (bie87 (1987)) followed a very similar approach by constraining the Galactic vertical potential through global Galactic star counts and the current knowledge on the stellar population kinematics.
Later, a major step forward was made by Kuijken & Gilmore (kg89 (1989)) with a new sample of K dwarfs towards the South Galactic Pole (SGP) tracing the vertical potential. They used the same stars to measure both the vertical density distribution and kinematics. This had the immediate consequence of considerably reducing uncertainties existing in previous works, where different samples were used to determine both the vertical density and kinematics.
Thereafter, regular advances occured with improved stellar samples and accurate corrections of systematic effects by Flynn and collaborators (fly94 (1994, 1998, 2000, 2004)), in our Papers I and II, and by other authors (for instance Korchagin et al., kor03 (2003)).
A decisive moment was, of course, the arrival of Hipparcos observations (ESA, (1997)) that allows precise calibration111 We note that the correction of systematic effects should be easier with Hipparcos data, since the distribution of errors is understood so well. However, the way the correction of systematic effects is applied always depends on the astrophysical question examined. The bias of Lutz-Kelker, Malmquist or others must be cautiously considered to achieve a proper correction; see for instance a discussion by Arenou et al. (are99 (1999)). of stellar parallaxes and absolute magnitudes. This has allowed robust estimation of distances and also useful measurement of tangential velocities. An immediate application has consisted in probing the potential close to the Galactic plane within 100-200 pc directly. Likewise, Hipparcos data gave immediate access to the Oort limit (Pham pha98 (1998), Crézé et al. 1998a ; 1998b , Holmberg & Flynn hol00 (2000), Korchagin et al. kor03 (2003)).
In this general context, our paper describes the observational extension of the red clump samples analysed in Paper II, and gives a new dynamical determination of the total local surface mass density. We also discuss what are probably the real current constraints obtained on the surface mass density, and comment on other results obtained in previous papers.
There is no perfect agreement yet between the various recent determinations of the vertical potential perpendicular to the Galactic plane. Samples remain small; methods and analysis are probably not yet optimized; and some assumptions, like full phase mixing and stationarity, are difficult to check. Furthermore, useful and complementary information are not used optimally like the change of metallicities with kinematics.
Even if many systematic effects can now be conveniently considered and corrected, the lack of large unbiased stellar samples with radial velocities prevent us from examining the stationarity of stellar tracers in detail, which is a central question that will need further examination. We may, however, note that the Hipparcos proper motions and tangential velocities have allowed the 3D velocity distribution in the solar neighbourhood to be probed. The phase mixing appears to be ‘slow’ for horizontal motions within the Galactic plane. The corresponding period of the epicyclic motions is 169 Myr, and a few streams are still visible in the () velocity space (Chereul et al. che99 (1999), and Famaey et al. fam04 (2004)). For vertical motions, the oscillation period is shorter, 86 Myr, or half the epicyclic period, and only one velocity stream is still clearly visible (associated with the Hyades cluster); otherwise the () phase space corresponding to the vertical motions seems to be phase-mixed.
Future advances are expected with the measurement of the disk surface mass density towards regions away from the solar neighbourhood. Local kinematics still carries non-local information about the structure of the disk: for instance, the coupling between the vertical and () horizontal motions of stars in the solar neighbourhood is directly linked to the scale length of the total mass distribution in the disk (Bienaymé, bie99 (1999)).
Analysis of stellar IR surveys, 2MASS, DENIS or DIRBE (Smith et al., smi04 (2004)) will allow minimization the effects of the extinction and uncertainties on distance scales. Surveys like the RAVE project (Steinmetz, ste03 (2003)) will increase the number of available radial velocities by one or two orders of magnitude: a few hundred thousand bright stars with . The next step, an ESA cornerstone mission, will be the GAIA project (Perryman et al., per01 (2001)), but new methods of analysis should be prepared. Classical analyses, like the one applied in this paper, would certainly be insufficient for fully investigating the huge amount of data expected.
In Sect. 2 we describe selection of the 3 samples that we use: a local one and 2 distant ones towards the North Galactic Pole, optimized to include a large fraction of clump giants. Section 3 is devoted to methods and explains how we determinated of the vertical potential and the disk surface mass density. Our discussion and conclusions are given in Sects. 4 and 5. In Soubiran et al. (sou05 (2005), hereafter Paper IV), we describe the improvement of our local and distant samples in detail as compared to Papers I and II, and we analyse these samples in terms of the properties of thin and thick disk populations.
2 The survey
To determine the vertical force perpendicular to the Galactic plane, we measured the spatial and the vertical velocity distributions of a test stellar population as a function of vertical height. As far as possible, this test population must be homogeneous and unbiased with selection criteria that are independent of velocity and distance. It must also be in a stationary state. For this purpose, we used one local and two distant samples of red clump giants selected within the same colour window and the same absolute magnitude window; our selected NGP clump stars are the distant counterparts of our selected Hipparcos stars. We find that at magnitude towards the NGP, half of stars, with are clump stars while at magnitudes , more than 80 percent are clump stars. Redder and bluer clump stars do exist. The blue cut removes the most metal poor stars ([Fe/H] ) very efficiently but allows us to reach fainter magnitudes with low contamination by main sequence stars. The red cut was applied to minimize the contribution of subgiant stars and of other giants on their first ascent of the giant branch.
The distant sample is the extension to larger distances from the Galactic plane of the NGP sample that was previously analysed in Papers I and II. It was built from a preliminary list of red clump candidates from the Tycho-2 star catalogue (Høg et al. hog00 (2000)). High resolution spectroscopic observations were used to confirm the red clump stars, to separate them from the other stars, and to measure radial velocities. We also improved the local sample of 203 red giants by measuring new radial velocities and metallicities for 88 of these stars. The selection, observation, and reduction of the two samples is briefly described below and explained in Paper IV.
2.1 The Hipparcos red clump stars
The local sample of 203 nearby red clump giants was selected from the Hipparcos catalogue according to the following criteria :
where is the Hipparcos parallax and 222The Hipparcos star positions are expressed in the International Celestial Reference System (see http://www.iers.org/iers/earth/icrs/icrs.html). the declination. The Johnson colour was transformed from the Tycho-2 colour by applying Eq. 1.3.20 from ESA, (1997):
The absolute magnitude was computed with the magnitude resulting from the transformation of the Hipparcos magnitude to the Johnson system with the equation calibrated by Harmanec (har98 (1998)).
We searched for radial velocities and metallicities for these stars in the literature. Our source of spectroscopic metallicities is the [Fe/H] catalogue (Cayrel et al., cayrelstr01 (2001)), in which we found a fraction of our stars in common with McWilliam (mcW90 (1990)) and Zhao et al. (zhaoet01 (2001)). Unfortunately metallicities by Zhao et al. (zhaoet01 (2001)) could not be considered because of an error in their temperature scale, and those by McWilliam (mcW90 (1990)) had to be corrected from a systematic trend as described in Paper IV. Complementary data were obtained for 88 stars observed with the echelle spectrograph ELODIE in February 2003, October 2003, and February 2004 at the Observatoire de Haute Provence (France) with signal to noise ratios at 550 nm (S/N) ranging from 150 to 200. We measured and determined their radial velocities, [Fe/H] metallicities, and abundances of several chemical elements. Metallicities are missing for 7 remaining stars, among which there are three binaries.
A detailed description of the atmospheric parameters and abundance determination is given in Kovtyukh et al. (Kovtet05 (2005)) and Mishenina et al. (Mishet05 (2005)). Briefly, the effective temperatures were determined with line-depth ratios, a technique similar to the one developed by Gray (gray94 (1994)), leading to excellent precision of 10-20 K. The surface gravities were determined using two different methods : ionisation-balance for iron and fitting the wings of a Ca I line profile. For the method of ionisation-balance, we selected about 100 Fe I and 10 Fe II unblended lines based on the synthetic spectra calculations obtained with the software STARSP (Tsymbal, tsymbal96 (1996)). For the profile-fitting method, the Ca I line at 6162 Å, which is carefully investigated in Cayrel et al. (CFFST96 (1996)), was used. The gravities obtained with these two methods show very good agreement, as shown in Mishenina et al. (Mishet05 (2005)). The [Fe/H] determination is constrained by the large number of lines of neutral iron present in the spectra of giants. The iron abundances were determined from the equivalent width of lines by applying the program of Kurucz WIDTH9. The measurement of the equivalent width of lines was carried out with the program DECH20 (Galazutdinovgal94 (1994)).
2.2 NGP K giants
The distant K giant sample was drawn from the Tycho-2 catalogue (Høg et al., hog00 (2000)). We applied similar criteria as in Paper I to build the list of red clump candidates, just extending the limiting apparent magnitudes to fainter stars. In summary, we selected stars in two fields close to the NGP. The first field (radius , hereafter F10) is centred on the NGP, the second one (radius , hereafter F15) is centred on the Galactic direction (), avoiding the Coma open cluster area (a circular field of radius around ). The total area effectively covered by our samples is 720 square degrees. We selected stars with , in the magnitude range 7.0-10.6 for F10, and 7.0-9.5 for F15 (Johnson magnitudes transformed from Tycho2 ones). Known Hipparcos dwarfs were rejected.
A total of 536 spectra were obtained with the ELODIE echelle spectrograph at the Observatoire de Haute Provence, corresponding to 523 different stars: 347 in F10 and 176 in F15. The spectra have a median S/N ratio of 22 at 550 nm. This low S/N is sufficient to estimate with good accuracy the stellar parameters, , gravity, and [Fe/H] metallicity, and absolute magnitude with the tgmet method (Katz et al. kat98 (1998)), as previously described in Paper I. tgmet relies on a comparison by minimum distance of the target spectra to a library of stars with well-known parameters, also observed with ELODIE (Soubiran et al. sou98 (1998), Prugniel & Soubiran pru01 (2001)). Since our previous study of clump giants at the NGP, the tgmet library has been improved considerably. Many stars with well-determined atmospheric parameters and with accurate Hipparcos parallaxes have been added to the library as reference stars for (, , [Fe/H], ). The improvment of the tgmet library and the extended sample is fully described in Paper IV. Here we just give useful characteristics of the extended sample.
The accuracy of the tgmet results was assessed with a bootstrap test on reference stars with very reliable atmospheric parameters and absolute magnitudes. A rms scatter of 0.27 was obtained on and 0.13 on [Fe/H]. These values give the typical accuracy of the tgmet results. The scatter on corresponds to a 13% error in distance. As explained in Paper I, the absolute magnitudes from Hipparcos parallaxes of the tgmet reference stars are affected by the Lutz-Kelker bias. This causes an additional external error that must be taken into account. In Paper II, the Lutz-Kelker bias for local clump giants is estimated to be mag corresponding to a systematic overestimation of distances by 4%. We did not attempt to correct individual absolute magnitudes of the reference stars, because the Lutz-Kelker bias was estimated from the luminosity function of the parent population, which is unknown for most giants of the TGMET library, except for the clump ones.

In order to test the internal precision of tgmet on [Fe/H], we compared the results obtained for the 13 clump giants observed twice (Fig. 1). As can be seen, the agreement is excellent ( dex). For , the scatter is only 0.08 mag.
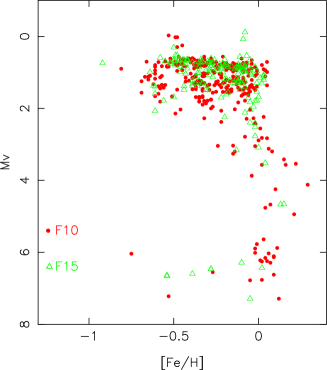
Once the stellar parameters (, , [Fe/H], ) were determined for each of the 523 target stars of the NGP sample, was used to identify the real red clump giants from the dwarfs and subgiants and to compute their distances. ELODIE radial velocities, Tycho-2 proper motions, and distances were combined to compute 3D velocities () with respect to the Sun. According to typical errors of 0.1 km.s-1 in radial velocities, 15 % in distances, 1.4 mas.yr-1 in proper motions at a mean distance of 470 pc for F10, and 1.2 mas.yr-1 in proper motions at a mean distance of 335 pc for F15, the mean errors on the two velocity components and are 5.6 and 4.0 km.s-1 in F10 et F15, respectively, while it is 0.1 km.s-1 on in both fields.
The 523 target stars are represented in Fig. 2, in the plane metallicity - absolute magnitude, with different colours for F10 and F15. The F10 field is more contaminated by dwarfs.
2.3 Binaries
Binarity can be recognized from the shape of the correlation function of the spectra with a stellar template. None of the 536 target spectra correspond to a clear SB2 (double-lined spectroscopic binary), but a dozen of them present an asymmetric or enlarged profile that could be the signature of a companion. Only multi-epoch measurements could establish the binarity fraction in our sample precisely, but it seems to be small as also found by Setiawan et al. (set04 (2004)). This was expected, as for a short period binary, the system would merge during the giant phase. Moreover, a binary system with a red clump giant and a sufficiently bright star, i.e. spectral type earlier than K, is expected to have a colour outside our colour selection interval. The only star that was really a problem for tgmet is TYC 1470-34-1, because of a very enlarged profile, which can be due either to a companion or to rotation, so this star was removed from the following analysis.
2.4 Kinematics and metallicity
We note a deficiency of stars with metallicities [Fe/H] , although this is not specific to our red clump sample (Fig. 2). Our selection criteria does not favour very low metallicity stars for which the red clump covers an extended colour interval, much larger than our colour interval selection. This lack of stars with [Fe/H] exists also in distance-complete samples of dwarfs, for instance in Reddy et al. (red03 (2003)). It is also a result obtained by Haywood (hay01 (2001, 2002)) when revisiting the metallicity distribution of nearby G dwarf stars. A more complete discussion of this aspect of our sample is presented in Paper IV.
For our analysis, we rejected stars with [Fe/H] metallicities outside the metallicity interval []. Table 1 gives the number of stars used for the determination.
Forthy clump stars have [Fe/H] abundances within and a mean vertical velocity of km.s-1, which differs (at 3 ) from the usual or expected km.s-1. The 116 clump stars with [Fe/H] abundances within have a high velocity dispersion of km.s-1, and their vertical density distibution decreases slowly over the limited -extension of our samples. Their density decreases too gradually to bring an efficient constraint on our present determination. Moreover, including these stars degrades the analysis by increasing the uncertainty on drastically. For all these reasons, we rejected the lowest metallicity stars from our analysis.
A small fraction of stars have [Fe/H] . These stars (24 stars in the local sample and 1 in the NGP cone samples) have a relatively low vertical velocity dispersion =10 km.s-1; they also have a correspondingly low scale height. In this study, including or rejecting these stars has no influence: here they do not constrain the total surface mass density of the disk, and have not been included in the analysis.
| Hipparcos | Field 1 | Field2 | |
|---|---|---|---|
| Area (sq.deg.) | 309 | 410 | |
| 7-9.5 | 7-10.6 | ||
| full sample | 203 | 176 | 347 |
| red clump | 203 | 124 | 204 |
| Fe cuts to | 152 | 67 | 100 |
3 Volume and surface mass density determinations
3.1 The Oort limit
Thanks to the Hipparcos data, the Galactic potential was probed in the first two hundred parsecs from the Sun, giving excellent accuracy for determining the Oort limit, i.e. the total volume density in the Galactic plane at the solar position.
A first set of studies based on A to F Hipparcos stars within a sphere of about 125 pc, have been published by Pham (pha98 (1998)), Crézé et al. (1998a ; 1998b ), and by Holmberg & Flynn (hol00 (2000)). Their results all agree within 1- error limits, with differences depending probably on the various ways the potential has been parameterized. Holmberg & Flynn (hol00 (2000)) model the local potential according to a set of disk stellar populations and also a thin disk of gas, while Crézé et al. (1998a ; 1998b ) assume a simple quadratic potential. We note that an important limitation has been the lack of published radial velocities, limiting both the accuracy of the modelling of the kinematics and the possibility of checking the stationary state of the various samples used for these analyses independently. From these studies, we will consider (see Holmberg & Flynn hol04 (2004) and Paper II) that the Oort limit is determined as . The Oort limit includes the local mass density from both the disk and dark halo components.
Recently Korchagin et al. (kor03 (2003)), using Hipparcos data, analyse the vertical potential at slightly larger distances. The tracer stars are giant stars that are brighter than clump giants, within a vertical cylinder of 200 pc radius and an extension of pc out of the Galactic plane. For the dynamical estimate of the local volume density, they obtain: . A small improvement could perhaps still be achieved using 2mass colour to minimize uncertainties on extinction, distances, and vertical velocities.
3.2 The total disk surface mass density.
Model
To analyse the vertical density and velocity distributions of our samples and to measure the surface mass density of the Galactic disk, we model the distribution function, with the vertical position, the vertical velocity relative to the Local Standard of Rest, and we adjusted the free model parameters by a least-square fitting to the apparent magnitude star counts and to the vertical velocity dispersions in different magnitude intervals. We simultaneously adjusted the model to the data from the 3 samples.
The distribution function is modeled as the sum of two isothermal components, according to
| (1) |
For the total vertical potential , we used the parametric expression proposed by Kuijken & Gilmore (kg89 (1989)):
| (2) |
where the potential is related, through the Poisson equation, to the vertical distribution of the total volume mass density . The -integration gives the total surface mass density within from the Galactic plane:
This parametric law models the vertical mass density by two density components. One component mimics the locally constant density of a round or slightly flattened halo. It produces a vertical quadratic potential locally. The other component mimics the potential of a flat disk; one parameter, , is its surface mass density while the other, , is its half thickness.
Data
Compared to our previous work (Paper II), we have increased the number of observed stars (726 against 387) and the limiting distances by a factor 1.26. We also obtained new or first [Fe/H] determinations and built a complete sample of Hipparcos red clump stars with measured metallicities.
Due to the lack of stars in the range 100-300 pc, our samples are not suited to constrain the potential in this region efficiently. More generally, pencil beam samples towards the Galactic poles are not adequate for measuring the Oort limit without supplementary assumptions on the shape of the vertical potential. Since the Oort limit has been previously and accurately measured, we will adopt for the volume mass density the value discussed above: .
Fitting the vertical potential with one free parameter:
A least-square minimization is applied to the observed star count distributions and vertical velocity dispersion distributions (see continuous lines Fig. 3-4 and Table 2). We fit the data from the three samples, local and distant. We fit all the data simultaneously to improve the parameter estimation and also the estimate of errors on parameters.
Individual errors on distances are small for stars from the NGP samples, about 13%, but this does not contribute to the model uncertainties since the analysed quantities (star counts and vertical velocities) are independent of distance. Vertical velocities remain slightly affected by uncertainties on distances through the small contribution of the projection of proper motions on the vertical -direction. The uncertainty on distances, however, reflects the accuracy achieved on absolute magnitude determination for distant stars (about 0.27 mag) and our ability to identify distant clump stars. Clump star absolute magnitudes are normally distributed (see Paper II) around with a dispersion of 0.25, and we select them in the range . Our results also depend on the absolute magnitude calibration of nearby giant stars, which is also explained in Paper II.


| [Fe/H] from to +0.10 | |
|---|---|
| local relative density | velocity dispersion (km s-1) |
We may consider that the main source of uncertainties is the restricted size of the samples. They are split into magnitude-bins, and the uncertainty is dominated by Poisson fluctuations. For a given bin of magnitude, the error on is , and the error on is , where is the number of stars in the bin. Errors given in Table 3 and elsewhere are deduced from the diagonal of the covariance matrix given by the least-square fit.
Results
We assume that the Galactic dark matter component needed to explain the flat rotation curve of our Galaxy is spherical and that its density in the solar neighbourhood is (Holmberg & Flynn, hol00 (2000)). Adopting this value, along with the previously mentioned local density , then only one parameter of our potential expression is free, since the two parameters and are related through
We find pc, and the surface density within 800 pc is found to be . Within 1.1 kpc, we obtain . The most recent determination, = 716, obtained by Holmberg & Flynn (hol04 (2004)) is comparable. Their study and ours have many similarities, with giant stars in the same range of apparent magnitudes, accurate absolute magnitude and distance estimates, similar number of stars and apparently similar kinematics, but also many differences: NGP versus SGP stars, spectroscopic versus photometric distances, clump giants versus a sample with a slightly larger range in colours and absolute magnitudes.
With an estimated mass density of for the visible matter (Holmberg & Flynn, hol04 (2004)) (see Sect. 4.1), there is no need a priori to add matter to the model, for example, by flattening the dark corona to explain our measured local surface density.
The other parameters (relative densities and velocity dispersions of stellar components) are explained in Table 2: the two fixed parameters are the Sun’s position above the Galactic plane, = 15 pc, and the Sun’s vertical velocity =8 .

| pc | |||
|---|---|---|---|
| 0.00 | 287 | 57 | 57 |
| 0.007 | 260 | 60 | 64 |
| 0.01 | 249 | 61 | 67 |
| 0.021 | 205 | 66 | 79 |
Fitting the vertical potential with two free parameters
Adjusting the model (Eq. 2) with a single free parameter gives a satisfying result with small error bars (9 percent), but it does not give information on correlations with the other (fixed) parameters and does not tell us much about the range of possible other solutions that are compatible with the observations. But it is known that in practice, the change of does have a significant impact on solutions: its correlation with others parameters is discussed by Gould (gou90 (1990)).
Adjusting both and we find that the best fit is obtained with , while other parameters are very close to these given in Table 2. Solutions within 1- from this best fit give the range 0-0.021 for the parameter.
Table 3 shows some values and solutions that still result in acceptable fits to our observations. Thus acceptable solutions for cover a greater range of 22 than does using a model with just one free parameter. This is understandable considering that the best determined quantity is the vertical potential (the adjusted quantity in Eq. 1), not the force. The derivative of the potential gives the surface density, which is proportional to the force, and similar potentials may produce different forces and surface densities (see Fig. 5).
This probably explains the scatter in determinations of the surface density in previous works in the 80’s and 90’s. These correlations were already discussed in detail in the same context by Gould (gou90 (1990)) to explain differences in the local surface mass density estimated by various authors.
We also note that Eq. 2 parameterizes the vertical potential and the total vertical mass distribution; however, the two apparent components of the r.h.s of Eq. 2 should not be strictly read as being one component for the stellar and gas disks (with a total surface mass density ) and another one for a round or flattened dark matter halo. Only the total vertical mass density distribution (plotted at the the bottom of Fig. 5) is constrained by our data; from that figure, we notice that the three plotted solutions are quite similar in the range of distances 0 to 400 pc.
4 Discussion
An abundant literature and a variety of results exist on the vertical force and the different methods applied to constrain the total local mass volume density, the Oort limit. The oldest papers must be read with care, since systematic bias on distances was more difficult to check before the Hipparcos satellite, but the techniques developed and comments remain valid. Stellar samples are extracted from thin and thick disk populations and are represented as the combination of isothermal populations. Kuijken (kui91 (1991)) proposed an original modeling with a continuum set of such isothermal populations. We estimate that the most decisive aspect to understand the differences between authors concerns the various techniques applied in modeling the vertical potential.
For instance, a powerful technique is non-parametric modeling of the force (Chen et al. che03 (2003) and references in Philip & Lu phi89 (1989)). These non-parametric determinations have been achieved without smoothing or regularisation (or, for instance, without a positivity condition on the mass distribution), and the resulting published forces show large oscillations that certainly result from the small sample sizes. One consequence is that these oscillations have no physical interpretation; for instance, the resulting total mass distribution is not positive everywhere. We expect that a conveniently applied regularisation should be sufficient for making these methods more reliable in this context.
On the other hand, the parametric modeling consists in assuming a global shape for the vertical potential. Bahcall (bah84 (1984)) and recently Holmberg & Flynn (hol04 (2004)) have assumed a total disk mass proportional to the observed disks of gas and stars, with an extra component of dark matter. This last component, proportional to one of the known components, is adjusted to constrain the vertical potential. Kuijken & Gilmore (kg89 (1989)) also proposed a simple analytical model (the model used in this study) and adjusted one of the parameters.
The advantage of using such a priori knowledge and realistic models is to minimize the number of free parameters and to reduce the measured uncertainties. But this decrease does not mean that the adjusted parameters have been really obtained with better accuracy, since the information on correlations is lost.
For example, in this paper, we have adjusted the vertical potential
with two free parameters; as a consequence, the formal errors are
larger while the observational accuracy of our data is probably better
or, at least of similar quality, than in the other recent studies.
But this adjustment with two free parameters allows us to probe more
realistic and general potentials. After analysing our data, we drew
the following conclusion: the uncertainty on (see
Table 3) is still large, about sixteen percent,
and this must also hold for previously published analyses.
4.1 The visible surface mass density:
Similar values of , the stellar surface mass density, at the solar position have been proposed in recent works: 25 (Chabrier, cha01 (2001)), but also 29 (Holmberg & Flynn, hol00 (2000)) and 28 from the Besançon Galaxy model (Robin, rob03 (2003)). The brown dwarf contributions to the surface mass density have been estimated: 6 (Holmberg & Flynn, hol04 (2004)) or 3 (Chabrier, cha02 (2002)). More difficult is to estimate the ISM contribution; Holmberg & Flynn (hol00 (2000)) proposed 13, but this quantity is uncertain. For instance it has been proposed that all the dark matter could contribute to the ISM disk component. Adding all known contributions, Holmberg & Flynn (hol04 (2004)) propose 53, the value we adopt here.
4.2 Are our solutions compatible with our current knowledge of the Galactic rotation curve?
To answer this question, we simplified and adopted a double-exponential density distribution for the Galactic disk, including stars and the interstellar medium. We set the scale length kpc, the scale height pc, and its local surface density at the solar radius , which includes 40 for the stellar contribution and 13 for the ISM. We neglected the contributions of the bulge and the stellar halo, as these are very small beyond 3 kpc from the Galactic centre. To maintain a flat Galactic rotation curve, we added a Miyamoto spheroid (Miyamoto and Nagai, miy75 (1975)). Adopting kpc and a flat Galactic rotation curve kpc, we adjusted the core radius () and the mass of the Miyamoto spheroid to find kpc. If the Miyamoto component is spherical (=0 kpc), its local density is . Flattening this dark component (=5 kpc, i.e. an axis ratio of 0.51), we obtained : the exact limit compatible with our analysis that still gives good fits to . Larger flattenings are excluded, as, for instance, = 6.5 kpc gives a 0.34 axis ratio and .
In conclusion, our data shows that the Galactic dark matter can be distributed in a spherical component, but it certainly cannot be distributed in a very flattened disk. For instance, if the Galaxy’s mass distribution were totally flat, the local surface density would be as high as (with km s-1 and =8.5 kpc for a Mestel disk, see Binney & Tremaine bin87 (1987)). In conclusion, there is room to flatten the dark matter halo by a maximum factor of about two or three. This agrees with the shape of the dark halo that de Boer (boer05 (2005)) interprets from diffuse Galactic EGRET gamma ray excess for energies above 1 GeV.
4.3 Terrestrial impact cratering
The main topic of this paper is the determination of the local surface mass density : for that purpose we used the most recent determinations of the local volume mass density . Our data alone gives a less accurate but close value of = . All these recent determinations are based on very different samples of stars: A-F dwarfs and different types of giants. These samples cover different distances, either in a sphere of 125 pc around the Sun, inside a cylinder of 800 pc length crossing the Galactic plane, or in pencil beams up to 1.1 kpc from the plane. All these determinations converge towards the same value of the local volume mass density, 0.10, implying that the half period of the vertical oscillations of the Sun through the Galactic plane is 42 Myr.
A 26 Myr periodicity in epochs of major mass exctinction of species was found by Raup & Sepkoski (rau86 (1986)), and a cycle of 28.4 Myr in the ages of terrestrial impact craters was found by Alavarez & Muller (alv84 (1984)). The periodicity in these catastrophes is disputed, however (see for instance Jetsu & Pelt, jet00 (2000)). The spectral analysis of the periodicity hypothesis in cratering records shows, in the most recently published works, possible or significant periods: Myr (Rampino & Stothers, 1984), Myr (Stothers, sto98 (1998)), and more recently 16.1 Myr and 34.7 Myr by Moon et al. (moo03 (2003)). We note that some authors estimate that periodicities could result from a spurious “human-signal” such as rounding (Jetsu & Pelt, jet00 (2000)). Recently, Yabushita (yab02 (2002, 2004)) claims a periodicity of Myr and considers that the probability of deriving this period by chance on the null hypothesis of a random distribution of crater ages is smaller than 0.10. From the width of the peaks in their periodograms, we estimate their period accuracy to be Myr.
It has been frequently proposed that the period of high-impact
terrestrial cratering would be directly linked to the crossing of
the solar system through the Galactic plane where the giant
molecular clouds are concentrated. However, the above-mentioned
periods in the range 33-37 Myr would correspond to the half period
of oscillation of the Sun only if the total local mass density were
0.15, a high value of the
local density measured in the 1980’s by a few authors. Recent and
accurate measurements now imply a
42Myr half period of oscillation of the Sun that can no
longer be related to possible periods of large impact craters and
mass extinction events.
5 Summary
Adopting the previous determination of the total local volume density in the Galactic disk, we modelled the vertical disk potential and mass distribution through the constraints of a sample of red clump stars towards the NGP with measured distances, velocities, and [Fe/H] abundances.
Our simplest model, including a spherical dark corona, shows that there is no need for extra dark matter in the Galactic disk to explain the vertical gravitational potential. The total surface mass density, at the Solar position, is found to be , compared to 53 for the visible matter (see section 4.1), which is sufficient to explain both the observed amount of visible matter and the local contribution of a round dark matter halo (15 ).
With a two-parameter model and some flattening of the dark matter halo, we obtained a larger extent of acceptable solutions: = 57-79 , = 57-66 . Flattening larger than about 2 or 3 is excluded by analysis of our red clump giants.
We note that a flattening by a factor two of the dark corona could contradict the other recent constraint obtained by Ibata et al. (iba01 (2001)), which is based on the non-precessing orbit of the Sagittarius stream. However, while their result concerns the outer halo, our analysis is only sensitive to the inner one.
On the other hand, it is not possible to flatten the dark matter halo without increasing its own contribution to the local volume mass density too much. The recent dynamical estimates based on Hipparcos data of the total volume mass density gives 0.10 . This includes the known stellar local mass density, 0.046 , and the gas volume mass density, 0.04 (see Palasi pal98 (1998), Holmberg & Flynn hol00 (2000), Chabrier cha01 (2001, 2002, 2003), or Kaberla kal03 (2003)). This leaves room for only 0.014 for the dark matter. This also implies that the halo cannot be flattened more than a factor two, unless the volume mass density of the gas, the weakest point in the analysis, has been strongly overestimated.
As a by-product of this study we determined the half period of oscillation of the Sun through the Galactic plane, Myr, which cannot be related to the possible period of large terrestrial impact craters 33-37 Myr.
Acknowledgements.
This research has made use of the SIMBAD and VIZIER databases, operated at the CDS, Strasbourg, France. It is based on data from the ESA Hipparcos satellite (Hipparcos and Tycho-2 catalogues). Special thanks go to P. Girard, C. Boily, and L. Veltz for their participation in the observations and to A. Robin and C. Flynn for useful comments.References
- (1) Alvarez, W., Muller, R.A., 1984, Nature, 308, 718
- (2) Arenou, F., Luri, X. 1999, in Harmonizing Cosmic Distance Scales in a Post-Hipparcos Era, ASP Conf. Ser., 167, 13
- (3) Bahcall, J. N. 1984, ApJ, 276, 156
- (4) Barbier-Brossat, M. & Figon, P. 2000, A&A Sup., 142, 217
- (5) Bienaymé, O. 1999, A&A, 341, 86
- (6) Bienaymé, O., Robin, A., Crézé, M. 1987 A&A, 186, 359
- (7) Binney, J., Tremaine, S. 1987, Galactic Dynamics, Princeton Series in Astrophysics
- (8) de Boer, W. 2005, New Astr. Rev., 49, 213
- (9) Cayrel, R., Faurobert-Sholl, M., Feautrier, N., Spielfield, A., Thevenin, F. 1996, A&A 312, 549
- (10) Cayrel de Strobel, G., Soubiran, C., Ralite, N. 2001, A&A, 373, 159
- (11) Chabrier, G. 2001, ApJ, 554, 1274
- (12) Chabrier, G. 2002, ApJ, 567, 304
- (13) Chabrier, G. 2002, ApJ, 586, L133
- (14) Chen, A. B.-C., Lu, P.K., Méndez, R. A., van Altena, W.F. 2003, AJ, 126, 762
- (15) Chereul, E., Crézé, M., Bienaymé, O. 1999, A&A, 135, 5
- (16) Crézé, M., Chereul, E., Bienaymé, O., & Pichon, C. 1998a, A&A, 329, 920
- (17) Crézé, M., Chereul, E., Bienaymé, O., & Pichon, C. 1998b, Proc. of the ESA Symp. ”Hipparcos - Venice 97”, ESA SP-402, 669
- ESA, (1997) ESA 1997, The Hipparcos and Tycho Catalogues, (Noordwijk) Series: ESA-SP 1200
- (19) Famaey, B., Jorissen, A., Luri, X. et al. 2004, A&A, 430, 165
- (20) Flynn, C., Fuchs, B. 1994, MNRAS, 270, 471
- (21) Galazutdinov, A.G., 1994, Odessa Astron. Pub., 7, 88
- (22) Gould, A. 1990, ApJ, 360, 504
- (23) Gould, A., Bahcall, J., Flynn, C. 1997, ApJ, 482, 913
- (24) Gray, D. 1994, PASP 106, 1248
- (25) Harmanec, P., 1998, A&A, 335, 173
- (26) Haywood, M., 2001, MNRAS, 325, 1365
- (27) Haywood, M., 2002, MNRAS, 337, 151
- (28) Høg, E., Fabricius, C., Makarov, V. V. et al. 2000, A&A, 363, 385
- (29) Høg, E., Flynn, C. 1998, MNRAS, 294, 28
- (30) Holmberg, J., Flynn, C. 2000, MNRAS, 313, 209
- (31) Holmberg, J., Flynn, C. 2004, MNRAS, 352, 440
- (32) Ibata, R., Lewis, G.F., Irwin, M. et al. 2001, ApJ, 551, 294
- (33) Jetsu, L., Pelt, J. 2000, A&A, 353, 409
- (34) Kalberla, P.M.W. 2003, ApJ, 588, 823
- (35) Kapteyn, J. C. 1922, ApJ, 55, 302
- (36) Katz, D., Soubiran, C., Cayrel, R. et al. 1998 A&A, 338, 151
- (37) Korchagin, V. I., Girard, T. M., Borkova, T. V., Dinescu, D. I., van Altena, W. F. 2003, AJ, 126, 2896
- (38) Kovtyukh, V.V., Mishenina, T.V., Gorbaneva, T.I., Bienaymé O., Soubiran, C., Kantcen, L.E. 2005, Sov. Astron. (in press)
- (39) Kuijken, K. 1991, ApJ, 372, 125
- (40) Kuijken, K., Gilmore, G. 1989, MNRAS, 239, 605
- (41) Mishenina, T.V. et al. 2005 in preparation
- (42) Miyamoto, M. Nagai, R. 1975, PASJ, 27, 533
- (43) McWilliam, A. 1990, ApJS 74, 1075
- (44) Moon, H.K., Min, B.H., Kim, S.L. 2003, J Astron. Space Sci., 20(4), 269
- (45) Oort, J. H. 1932, BAN, 6, 249
- (46) Oort, J. H. 1960, BAN, 15, 45
- (47) Palasi, J. 1998, Proc. of the ESA Symp. ”Hipparcos - Venice 97”, ESA SP-402, 551
- (48) Perryman, M.A.C., de Boer, K.S., Gilmore, G. et al. 2001 A&A 369, 339
- (49) Pham, H.-A. 1998, Proc. of the ESA Symp. ”Hipparcos - Venice 97”, ESA SP-402, 559
- (50) Philip A.G.D., Lu, P.K. (Eds.), 1989 The Gravitational Force Perpendicular to the Galactic Plane (1989), L. Davis Press, Schenectady, N.Y.
- (51) Prugniel, Ph., Soubiran, C. 2001, A&A, 369, 1048
- (52) Rampino, M.R., Stothers, R.B., 1984, Nature, 308, 709
- (53) Raup, D.M., Sepkoski, J.J. 1986, Sci, 231, 833
- (54) Reddy, B.E., Tomkin, J., Lambert, D. L., Allende Prieto, C. 2003, MNRAS, 340, 304
- (55) Robin, A. C., Reylé, C., Derrière, S., Picaud, S. 2003, A&A, 409, 523
- (56) Setiawan, J., Pasquini, L., da Silva et al. 2004, A&A, 421, 241
- (57) Siebert, A., Bienaymé, O., Soubiran, C. 2003, A&A, 399, 531 (paper II)
- (58) Smith, B., Price, S., Baker, R.. 2004, ApJS, 154, 673
- (59) Soubiran, C., Bienaymé, O., Siebert, A. 2003, A&A, 398, 141 (paper I)
- (60) Soubiran, C., Katz, D., Cayrel, R. 1998, A&A, 133, 221
- (61) Soubiran, C. et al. 2005 in preparation (paper IV)
- (62) Steinmetz, M. 2003, GAIA Spectroscopy: Science and Technology, ASP Conf. Proc., Vol. 298, Ed. U. Munari, 381
- (63) Stothers, R. 1998, MNRAS, 300, 1098
- (64) Tsymbal, V.V. 1996, Model Atmospheres and Spectrum Synthesis, ASP Conf. Ser. 108, 198
- (65) Zhao, G., Qiu, H.M., Mao, S. 2001, ApJ, 551, L85
- (66) Yabushita, S. 2002, MNRAS, 334, 369
- (67) Yabushita, S. 2004, MNRAS, 355, 51
- (68) Zheng, Z., Flynn, C., Gould, A. et al. 2001, ApJ, 555, 393