An ultracompact X-ray binary in the globular cluster M 15 (NGC 7078)1
Abstract
We have used the Advanced Camera for Surveys on board the Hubble Space Telescope to image the core of the globular cluster M 15 in the far-ultraviolet (FUV) waveband. Based on these observations, we identify the FUV counterpart of the recently discovered low-mass X-ray binary M 15 X-2. Our time-resolved FUV photometry shows a modulation with mag semi-amplitude and we clearly detect a period of min. We have carried out extensive Monte Carlo simulations which show that the signal is consistent with being coherent over the entire observational time range of more than 3000 cycles. This strongly suggests that it represents the orbital period of the binary system. M 15 X-2 is FUV bright ( mag) and is characterized by an extremely blue spectral energy distribution (). We also find evidence for an excess of flux between 1500 Å and 1600 Å and probably between 1600 Å and 2000 Å which might be due to C IV 1550 Å and He II 1640 Å emission lines. We also show that M15 X-2’s X-ray luminosity can be powered by accretion at the rate expected for gravitational-wave-driven mass transfer at this binary period. The observed FUV emission appears to be dominated by an irradiated accretion disk around the neutron star primary, and the variability can be explained by irradiation of the low-mass white dwarf donor if the inclination of the system is . We conclude that all observational characteristics of M15 X-2 are consistent with it being an ultracompact X-ray binary, only the third confirmed such object in a globular cluster.
1 Introduction
Ultracompact X-ray binaries (UCXBs) are very tight, interacting binaries ( cm orbit) with periods min. They contain neutron stars (NSs) or black holes accreting from a low-mass () degenerate companion. UCXBs are a sub-class of the low-mass X-ray binaries (LMXBs). It has been known for a long time that bright LMXBs are found to be overabundant in globular clusters (GCs) compared to the Galactic field (Katz 1975, Clark 1975). This leads to the suggestion that LMXBs, and consequently UCXBs, are preferentially formed in the dense environment of the GC cores through various stellar interactions, such as direct collisions between a NS and a red giant (Verbunt 1987, Davies et al. 1992, Ivanova et al. 2005), tidal capture of a main sequence star by a NS (Bailyn & Grindlay 1987), or exchange interactions between NSs and primordial binaries (Rasio et al. 2000). It has been suggested that most of the 13 bright LMXBs in GCs might be UCXBs (Bildsten & Deloye 2004, Ivanova et al. 2005). However, only two are confirmed in GCs to date. These are 4U 1820-30 in NGC 6624 ( min, Stella et al. 1987) and 4U 1850-087 in NGC 6712 ( min, Homer et al. 1996). Two other GC sources have been suggested as particularly strong UCXB candidates (Homer 2003). One of these candidates is CXO J212958.1+121002 in M 15, also known as M 15 X-2 (White & Angelini 2001).
M 15 is the only galactic GC known to harbour two bright LMXBs. A single source was detected in early X-ray studies, 4U 2127+119, and that was identified with the optical counterpart AC 211 (Aurière et al. 1984, Charles et al. 1986). Chandra observations later on resolved 4U 2127+119 into two X-ray sources (White & Angelini 2001). One of these was the previously known LMXB AC 211. The second source, CXO J212958.1+121002 or M 15 X-2, is actually 2.5 times brighter than AC 211 in X-rays. Based on Hubble Space Telescope (HST) data from Guhathakurta et al. (1996), White & Angelini (2001) identified a blue mag star as the optical counterpart to the second source (star 590 in De Marchi & Paresce 1994). However, the orbital period of M 15 X-2 has so far not been determined.
Here, we present FUV data of M 15 X-2 taken with the HST that allow us to classify the source as an UCXB. In Sect. 2 we describe the data and their reduction. We present the analysis of the photometry and determine the period of M 15 X-2 in Sect. 3. We summarize our results and conclusions in Sec. 4.
2 Observations and data reduction
M 15 was observed with the Advanced Camera for Surveys (ACS) on board the HST in September and October 2003, and October to December 2004. Images were taken using the far-ultraviolet (FUV) filters F140LP, F150LP, and F165LP in the Solar Blind Channel (SBC), and the near-UV (NUV) F220W filter in the High Resolution Channel (HRC).
For our variability study (see Sect. 3) only relative magnitudes are needed. These were derived directly from the individual flatfielded images. Aperture photometry was carried out using daophot (Stetson 1991) running under IRAF 111IRAF (Image Reduction and Analysis Facility) is distributed by the National Astronomy and Optical Observatories, which are operated by AURA, Inc., under cooperative agreement with the National Science Foundation. using an aperture radius of 4 pixels and a sky annulus of 50 to 60 pixels. For this purpose, we only used the 90 exposures taken in SBC/F140LP, since these data provide the longest time coverage (from October 14 to December 5, 2004). Eighty of these images had exposure times of 300 sec, four were exposed for 140 sec and six for 40 sec. One orbit of observation yielded 9 data points.
In order to determine the time-averaged spectral energy distribution (SED) of our counterpart, we also carried out absolute photometry on combined and geometrically corrected images for each filter. These master images were created using multidrizzle running under PyRAF. For our aperture photometry, we used an aperture radius of 5 pixels for all SBC FUV data, a smaller radius of 4 pixels in the HRC NUV data, and a sky annulus of 5 to 7 pixels. The smaller aperture in the NUV was chosen to avoid the effects of severe crowding. In the FUV, aperture corrections were determined via curves of growth constructed from isolated stars in our master images. For the NUV data, we used the encircled energy fractions published by Sirianni et al. (2005). In order to derive a reliable SED, we ideally want mean fluxes in non-overlapping wavelength windows. However, the ACS/SBC/F140LP bandpass fully includes F150LP, and F150LP in turn includes F165LP. We therefore created two artificial narrow-band filters that are defined as the differences between the actual filters, i.e. we define F140N = F150LP - F140LP and F150N = F150LP - F165LP. Thus the count rate of a source in F140N, for example, is simply obtained by subtracting its count rate in F150LP from that in F140LP. Fig. 4 (top panel) shows the resulting throughput curves for the artificial filters. As can be seen, they barely overlap and are thus ideal for characterizing the UV SED of our source. In order to convert count rates into STMAGs, we used the synphot package running under IRAF. Full details on our analysis procedure will be provided in a forthcoming publication that will present our entire FUV/NUV data set for M 15.
3 Analysis and Discussion
3.1 Source Identification
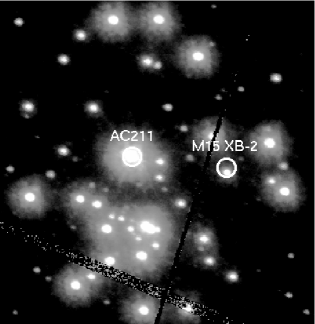
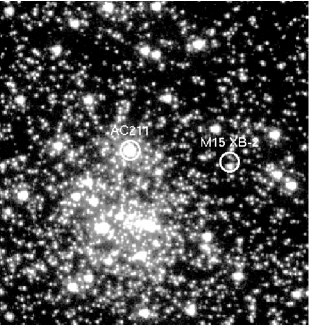
We identified the FUV counterparts to AC 211 and to M 15 X-2 on the F140LP images, using the Guhathakurta et al. (1996) HST images and the positions provided by White & Angelini (2001) as a reference guide. Fig. 1 shows a close-up of the FUV (SBC/F140LP) and NUV (HRC/F220W) master images, centred on AC 211 and M 15 X-2. The Chandra positions for these sources are also indicated, after shifting them by south in order to optimally align the X-ray and FUV positions of AC 211. The centre of the FUV counterpart to M 15 X-2 is slightly offset ( south) of the Chandra position, but still well within the internal Chandra error radius for this source (White & Angelini 2001). Our offset is consistent with the offset that White & Angelini (2001) found between their Chandra positions and the optical counterpart from De Marchi & Paresce (1994). Both AC 211 and M 15 X-2 are clearly detected as strong FUV and NUV sources in our ACS images.
3.2 Time-Series Analysis
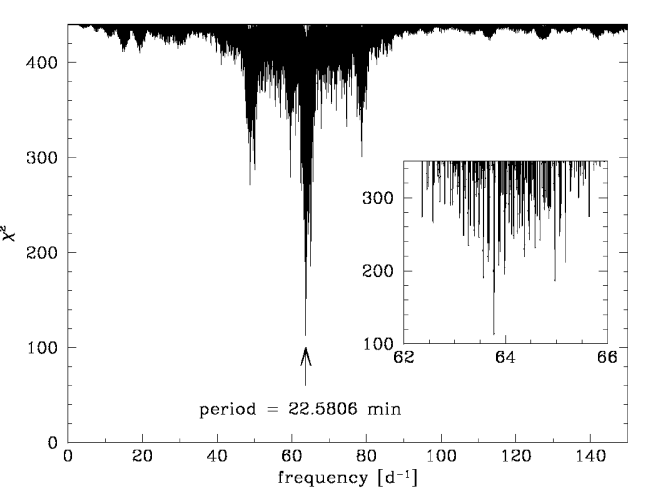
Fig. 2 shows the mean-subtracted light curve for all observing epochs. Low-amplitude variations with a peak-to-peak amplitude mag can be seen. We searched for a periodic signal by carrying out fits for a grid of trial frequencies. The resulting periodogram is shown in Fig. 3. The best fit yields a and suggests a period of min. In order to test the coherence of this period, we carried out Monte Carlo simulations. Briefly, we created 10000 fake data sets with the same time sampling, periodic signal and noise characteristics as our real data, but with a random phase offset assigned to each of the six observing epochs. Thus the phase was fully coherent within each epoch, but fully randomized between them. We then again carried out a sequence of fits for each data set. Next, we fixed the period at the best global value and fitted each epoch separately with both phase and amplitude as free parameters. We then defined a phase coherence index (PCI, see e.g. Haswell et al. 1997), which in our case is simply the of the phase estimates for the individual epochs, with the phase of the global fit as the reference value. We find that only 0.9% of the fake data with randomized phases have a PCI as good as the real data. We can therefore reject the null hypothesis that the periodic signal loses coherence completely over time-scales comparable to our inter-epoch spacing. The latter is days, corresponding to cycles. We can view this as a constraint on the period derivative, i.e. must be small enough so that less than one cycle is lost over cycles, i.e. . The quality factor of the 22.58 min signal must therefore be . By contrast, mHz QPOs tend to have (e.g. Chakrabarty et al. 2001, Boroson et al. 2000). As a further check, we carried out Monte Carlo simulations in which the input sinusoids were coherent, i.e. the phase was fixed at the same value for each epoch. This produced a PCI distribution that was consistent with the PCI of the real data set. Thus the 22.58 min signal is consistent with being fully coherent over the entire cycles spanned by our observations. All of these tests support the orbital nature of this signal.
We also used our Monte Carlo simulations to estimate the statistical error on the parameters of the observed signal. For this purpose, we again used coherent input signals and conservatively used error bars scaled so as to yield for the fit to the real data. We then used the standard deviation of the periods and amplitudes found for the fake data sets to estimate the errors on the measured parameters. The final results were min for the orbital period and mag for the semi-amplitude. This yields an ephemeris for the time of maximum light
| (1) |
where the numbers in brackets give the errors on the last two digits.
A sine wave with M 15 X-2’s period, amplitude and fixed phase is overplotted on the lightcurves in Fig. 2. This visually confirms that there is no sign of a loss of coherence over the entire observational time span of 3312 cycles. We conclude that the periodic signal is almost certainly an orbital modulation. 222We note that the average time resolution of our data is min which corresponds to a Nyquist frequency of . A period of min above could be reflected to yield our observed signal of 22.6 min. However, such short orbital periods are extremely unlikely (see e.g. Deloye & Bildsten 2003, Homer 2003).
3.3 Continuum Spectral Energy Distribution
The SED of M 15 X-2 is shown in Fig. 4 (top panel). Each point is plotted at the average wavelength of the corresponding filter. As expected for compact, interacting binaries, the SED of M 15 X-2 rises towards the blue. However, it is also worth noting that there seems to be an excess of flux in F150N, i.e. around 1550 Å. This excess flux can be caused by additional C IV Å and/or He II Å line emission. We therefore fit a power law to the two bracketing data points only. The best fit is found for a power-law index . This power-law spectrum is overplotted in Fig. 4. The depression at Å is due to a well known reddening feature there.
3.4 Evidence for Line Emission
The excess flux in F150N seems to indicate line emission due to C IV at Å and/or He II Å (the latter would also contribute to F165LP). However, such a peak might also be caused simply by a turnover in an otherwise smooth continuum. We have therefore carried out synthetic photometry for blackbodies (BBs) with temperatures . Fig. 4 (bottom panel) shows the resulting BB sequence in the F140N-F150N vs F150N-F165LP colour-colour diagram (CC diagram). Note that we reddened all synthetic photometry by M 15’s mag (Harris 1996). As expected, the BBs are located on a sequence going from blue (for hot sources) to red colours (for cool sources). The cross on the sequence marks K, which is the temperature of a BB peaking at Å, in the centre of the F150N filter. The observed location of M 15 X-2 in the CC diagram is also marked and is clearly distinct from the blackbody sequence. The reason is simply that the F150N filter is much narrower than the peaks of the BB distributions. Thus, the latter cannot cause a strong excess in this filter alone. We caution that true stellar spectra can have turnovers more sharp than suggested from a comparison with BB spectra, as the example of AC 211 shows (Downes et al. 1996).
The location of a power-law spectrum is also marked in the CC diagram. In order to check how strong a line might be needed to account for the observed flux excess, we have also carried out synthetic photometry of power law spectra (with index -2.0) and an emission line at C IV Å with equivalent widths (EW) of 10 Å to 50 Å. As can be seen, M 15 X-2 is located close to the power-law + C IV 1550 Å sequence, but slightly above, which suggests additional He II emission. We then carried out synthetic photometry of power law spectra and C IV Å ( Å) and He II Å emission line with EWs of 10 Å to 60 Å. We conclude that the SED of M 15 X-2 can be described by a power-law with an additional C IV 1550 Å and He II 1640 Å emission line with Å each. However, given that there are three free parameters in this model, a perfect match to just three colours is of course guaranteed. Spectroscopy will be needed to confirm the spectral shape and the existence of line emission.
4 Discussion
Knowledge of the orbital period of M 15 X-2 allows us to derive a more defined picture of this ultracompact system. Eggleton (1983) showed that for small mass ratios the mean density of the Roche lobe-filling companion becomes a function of mainly, i.e. . For an orbital period of 22.6 min, this gives which is consistent with the mean density of a low-mass white dwarf (WD). We can then use the mass-radius relationships published by Deloye & Bildsten (2003, their Fig. 4) to constrain the minimum mass of the donor star to and its minimum radius to , depending on composition. These lower limits correspond to low-temperature donors. Using Kepler’s 3rd law and assuming a NS-dominated system mass near , we estimate the binary separation to cm.
A blackbody of K has a blue spectral slope most similar to the one we fitted to M 15 X-2 (see Fig. 4). Placed at M 15’s distance, such a blackbody would have a radius of cm or if it is to have the same flux that we measured for M 15 X-2. This is larger than expected for the radius of the degenerate companion, but comparable to the circularization radius of of the accretion disk. We therefore conclude that the FUV light is coming from the accretion disk rather than from the WD donor. This is consistent with the UCXB model of Arons & King (1993) in which the orbital modulation is then caused by the irradiation of the WD donor. Using their Eq. 15 we then estimate the inclination angle of the system . This face-on inclination is consistent with the absence of eclipses. We note that no modulation can be seen in X-rays (Hannikainen et al. 2005).
M 15 X-2’s X-ray luminosity was found to be (White & Angelini 2001, Hannikainen et al. 2005). Assuming a 10 km radius and a mass of for the NS, this requires . This can be compared to the accretion rate expected from conservative mass transfer driven by angular momentum loss via gravitational radiation in an UCXB
| (2) |
Taking our minimum donor mass and corresponding mass-radius index (e.g. Deloye & Bildsten 2003), we derive a lower limit of . This suggests that the observed X-ray emission can be powered by gravitational radiation-driven mass transfer. We conclude that M 15 X-2 can be classified as an UCXB, only the third confirmed such system in a GC. Our results are consistent with the idea that indeed many GC LMXBs are UCXBs.
References
- (1) Arons, J. & King, I. R. 1993, ApJ, 413, L121
- (2) Aurière, M., Le Fèvre, O. & Terzan, A. 1984, A&A, 138, 415
- (3) Bailyn, C. D. & Grindlay, J. E. 1987, ApJ, 316, L25
- (4) Bildsten, L. & Deloye, C. J. 2004, ApJ, 607, L119
- (5) Boroson, B. et al. 2000, ApJ, 545, 399
- (6) Chakrabarty, D., Homer, L., Charles, P. A. & O’Donoghue, D. 2001, ApJ, 562, 985
- (7) Charles, P. A., Jones, D. C. & Naylor, T. 1986, Nature 323, 417
- (8) Clark, G. W. 1975, ApJ, 199, L143
- (9) Davies, M. B., Benz, W. & Hills, J. G. 1992, ApJ, 401, 246
- (10) Deloye, C. J. & Bildsten, L. 2003, ApJ, 598, 1217
- (11) De Marchi, G. & Paresce, F. 1994, ApJ, 422, 597
- (12) Downes, R. A., Anderson, S. F. & Margon, B. 1996, PASP, 108, 688
- (13) Eggleton, P. P. 1983, ApJ, 268, 368
- (14) Guhathakurta, P., Yanni, B., Schneider, D. P. & Bahcall, J. N. 1996, AJ, 111, 267
- (15) Hannikainen, D. C., Charles, P. A., van Zyl, L. et al. 2005, MNRAS, 357, 325
- (16) Harris, W.E. 1996, AJ, 112, 1487
- (17) Haswell, C. A., Patterson, J., Thorstensen, J. R., Hellier, C. & Skillman, D. R. 1997, ApJ, 467, 847
- (18) Homer, L., Charles, P. A., Naylor, T. et al. 1996, MNRAS, 282, L37
- (19) Homer, L. 2003, KITP Workshop: “The Physics of Ultracompact Stellar Binaries” (Feb 1-2, 2003), Coordinators: L. Bildsten, D. Chakrabarty, G. Nelemans, http://online.itp.ucsb.edu/online/ultra_c03/homer
- (20) Ivanova, N., Rasio, F. A., Lombardi, J. C., Dooley, K. L. & Proulx, Z. F. 2005, ApJ, 621, L109
- (21) Katz, J. I. 1975, Nature, 253, 698
- (22) Rasio, F. A., Pfahl, E. D. & Rappaport S. 2000, ApJ, 532, L47
- (23) Sirianni, M. et al. 2005, PASP, 117, 1049
- (24) Stella, L., Priedhorsky, W., & White, N. E. 1987a, ApJ, 312, L17
- (25) Stetson, P. B. 1991, in 3rd ESO/ST-ECF Garching - Data Analysis Workshop, eds. Grosbøl P. J., Warmels R. H., p. 187
- (26) Verbunt, F. 1987, ApJ, 312, L23
- (27) White, N. E. & Angelini, L. 2001, ApJ, 561, L101