11email: pere.blay@uv.es 22institutetext: Departamento de Física, Ingeniería de Sistemas y Teoría de la Señal, EPSA, Universidad de Alicante, P.O. BOX 99, E03080, Alicante, Spain
22email: ignacio@dfists.ua.es 33institutetext: Foundation for Research and Technology-Hellas, 711 10, Heraklion, Crete, Greece 44institutetext: Physics Department, University of Crete, 710 03 Heraklion, Crete, Greece
44email: pau@physics.uoc.gr 55institutetext: School of Physics and Astronomy, Southampton University, Southampton, SO17 1BJ, U.K.
55email: M.J.Coe@soton.ac.uk 66institutetext: X-ray Astrophysics Laboratory, Code 662, NASA/Goddard Space Flight Center, Greenbelt, MD 20771, U.S.A. 77institutetext: Universities Space Research Association
77email: corbet@milkyway.gsfc.nasa.gov 88institutetext: Observatori Astronómic, Universidad de Valencia, P.O. BOX 22085, E46071 Valencia, Spain
88email: juan@pleione.oauv.uv.es 99institutetext: Crimean Astrophysical Observatory, Nauchny, Crimea, 334413, Ukraine
99email: tarasov@crao.crimea.ua
Multiwavelength monitoring of BD~$+53°$2790, the optical counterpart to 4U~2206+54
We present the results of our long-term monitoring of BD~$+53°$2790, the optical counterpart to the X-ray source 4U~2206+54. Unlike previous studies that classify the source as a Be/X-ray binary, we find that its optical and infrared properties differ from those of typical Be stars: the variability of the V/R ratio is not cyclical; there are variations in the shape and strength of the H emission line on timescales less than 1 day; and no correlation between the EW and the IR magnitudes or colors is seen. Our observations suggest that BD~$+53°$2790 is very likely a peculiar O9.5V star. In spite of exhaustive searches we cannot find any significant modulation in any emission line parameter or optical/infrared magnitudes. Spectroscopy of the source extending from the optical to the -band confirms the peculiarity of the spectrum: not only are the He lines stronger than expected for an O9.5V star but also there is no clear pattern of variability. The possibility that BD~$+53°$2790 is an early-type analogue to He-strong stars (like Ori C) is discussed.
Key Words.:
stars:early-type - stars:emission-line - stars:magnetic fields - stars:individual:BD27901 Introduction
4U 2206+54, first detected by the UHURU satellite (Giacconi et al. 1972), is a weak persistent X-ray source. It has been observed by Ariel V (as 3A 2206+543; Warwick et al. 1981), HEAO–1 (Steiner et al. 1984), EXOSAT (Saraswat & Apparao 1992), ROSAT (as 1RX J220755+543111; Voges et al. 1999), RossiXTE (Corbet & Peele, 2001; Negueruela & Reig 2001, henceforth NR01) and INTEGRAL (Blay et al., 2005 ). The source is variable, by a factor on timescales of a few minutes and by a factor on longer timescales (Saraswat & Apparao 1992; Blay et al. 2005), keeping an average luminosity around for an assumed distance of (NR01).
The optical counterpart was identified by Steiner et al. (1984), based on the position from the HEAO–1 Scanning Modulation Collimator, as the early-type star BD~$+53°$2790. The star displayed H line in emission with two clearly differentiated peaks, separated by about 460 km s-1. Even though some characteristics of the counterpart suggested a Be star (Steiner et al., 1984), high resolution spectra show it to be an unusually active O-type star, with an approximate spectral type O9Vp (NR01).
RossiXTE/ASM observations of 4U~2206+54, show the X-ray flux to be modulated with a period of approximately 9.6 days (see Corbet & Peele, 2001; Ribó et al., 2005). The short orbital period, absence of X-ray pulsations and peculiar optical counterpart make 4U~2206+54 a rather unusual High-Mass X-ray Binary (HMXB). The absence of pulsations indicates that the compact companion could be a black hole. Recent studies of high energy emission from the system, however, suggest that the compact object in 4U42206+54 is a neutron star (Blay et al., 2005; Torrejón et al. 2004; Masseti et al. 2004).
In an attempt to improve our knowledge of this system, we have collected optical and infrared observations covering about 14 years.
2 Observations
We present data obtained as a part of a long-term monitoring campaign consisting of optical and infrared spectra, infrared and optical broad-band photometry and narrow-band Strömgren optical photometry of BD~$+53°$2790, the optical counterpart to 4U~2206+54.
2.1 Spectroscopy
2.1.1 Optical Spectroscopy
We have monitored the source from 1990 to 1998, using the 2.5-m Isaac Newton Telescope (INT) and the 1.0-m Jakobus Kapteyn Telescope (JKT), both located at the Observatorio del Roque de los Muchachos, La Palma, Spain, and the 1.5-m telescope at Palomar Mountain (PAL). We have also made use of data from the La Palma Archive (Zuiderwijk et al. 1994). The archival data consist of H spectroscopic observations taken with the INT over the period 1986 – 1990. The two datasets overlap for a few months and together they constitute continuous coverage of the source for thirteen years. The older INT observations had been taken with the Intermediate Dispersion Spectrograph (IDS) and either the Image Photon Counting System (IPCS) or a CCD camera. All the INT data after 1991 were obtained with CCD cameras. The JKT observations were obtained using the St Andrew’s Richardson-Brealey Spectrograph (RBS) with the R1200Y grating, the red optics and either the EEV7 or TEK4 CCD cameras, giving a nominal dispersion of 1.2 Å. The Palomar 1.5-m was operated using the f/8.75 Cassegrain echelle spectrograph in regular grating mode (dispersion Å/pixel).
Further observations were taken with the 2.6-m telescope at the Crimean Astrophysical Observatory (CRAO) in Ukraine.
From 1999, further monitoring has been carried out using the 1.52-m G. D. Cassini telescope at the Loiano Observatory (BOL), Italy, equipped with the Bologne Faint Object Spectrograph and Camera (BFOSC) and the 1.3-m Telescope at the Skinakas Observatory (SKI), in Crete, Greece. From Loiano, several observations were taken using grism#8, while higher resolution spectra were taken with grism#9 in echelle mode (using grism#10 as cross-disperser). Other spectra were taken with the echelle mode of grism#9 and grism#13 as cross-disperser, giving coverage of the red/far-red/near-IR region (up to Å). At Skinakas, the telescope is an f/7.7 Ritchey-Cretien, which was equipped with a ISA SITe chip CCD and a 1201 line mm-1 grating, giving a nominal dispersion of 1 Å pixel-1.
Blue-end spectra of the source have also been taken with all the telescopes listed, generally using the same configurations as in the red spectroscopy, but with blue gratings and/or optics when the difference was relevant (for example, from Loiano, grisms #6 and #7 were used for the blue and yellow regions respectively).
All the data have been reduced using the Starlink software package figaro (Shortridge et al., shortridge (1997)) and analysed using dipso (Howarth et al., howarth97 (1997)). Table Multiwavelength monitoring of BD~$+53°$2790, the optical counterpart to 4U~2206+54 lists a log of the spectroscopic observations.
2.1.2 Infrared Spectroscopy
Near-infrared ( band) spectra of BD~$+53°$2790 have also been taken with the JKT, INT and G. D. Cassini telescopes.
K-band spectroscopy of BD~$+53°$2790 was obtained on July 7-8, 1994, with the Cooled Grating Spectrometer (CGS4) on UKIRT, Hawaii. The instrumental configuration consisted of the long focal station (300 mm) camera and the 75 lines mm-1 grating, which gives a nominal velocity resolution of 445 km s-1 at 2m (). The data were reduced according to the procedure outlined by eve93 (1993).
2.2 Photometry
2.2.1 Optical Photometry
We took one set of UBVRI photometry of the source on August 18, 1994, using the 1.0-m Jakobus Kapteyn Telescope (JKT). The observations were made using the TEK#4 CCD Camera and the Harris filter set. The data have been calibrated with observations of photometric standards from Landolt et al. (1992) and the resulting magnitudes are on the Cousins system.
We also obtained several sets of Strömgren uvby photometry. The early observations were taken at the 1.5-m Spanish telescope at the German-Spanish Calar Alto Observatory, Almería, Spain, using the UBVRI photometer with the filters, in single-channel mode, attached to the Cassegrain focus. Three other sets were obtained with the 1.23-m telescope at Calar Alto, using the TEK#6 CCD equipment. One further set was taken with the 1.5-m Spanish telescope equipped with the single-channel multipurpose photoelectric photometer. Finally, one set was obtained with the 1.3-m Telescope at Skinakas, equipped with a Tektronik CCD.
| Date | MJD | T | |||||
|---|---|---|---|---|---|---|---|
| 1988, Jan 7 | 47168.290 | 9.9090.013 | 0.2570.005 | 0.0830.007 | 0.0110.007 | 2.5430.040 | a |
| 1989, Jan 4 | 74531.305 | 9.8450.015 | 0.2570.007 | 0.0420.010 | 0.1170.017 | 2.5430.007 | a |
| 1991, Nov 16 | 48577.401 | 9.9600.034 | 0.2680.005 | 0.0400.012 | 0.0410.033 | — | b |
| 1991, Dec 19 | 48610.297 | 9.9690.038 | 0.2710.021 | 0.3220.006 | 0.0100.018 | 2.4890.024 | b |
| 1994, Jun 21 | 49524.500 | 9.8350.019 | 0.2580.013 | 0.0320.021 | 0.0530.030 | 2.6170.020 | b |
| 1996, May 26 | 50229.642 | 9.8450.012 | 0.2670.007 | 0.0520.012 | 0.0740.013 | 2.5530.006 | a |
| 1999, Aug 16 | 51407.500 | 9.8830.031 | 0.2550.044 | 0.2260.074 | 0.2980.094 | c |
All observations are listed in Table 1.
2.2.2 Infrared Photometry
Infrared observations of BD~$+53°$2790 have been obtained with the Continuously Variable Filter (CVF) on the 1.5-m. Carlos Sánchez Telescope (TCS) at the Teide Observatory, Tenerife, Spain and the UKT9 detector at the 3.9-m UK Infrared Telescope (UKIRT) on Hawaii. All the observations are listed in Table Multiwavelength monitoring of BD~$+53°$2790, the optical counterpart to 4U~2206+54. The errors are much smaller after 1993, when we started implementing the multi-campaign reduction procedure described by Manfroid (manfroid93 (1993)).
3 Long-term monitoring
3.1 Spectrum description and variability
LABEL:baddata Spectra in the classification region (4000–5000 Å) show all Balmer and He i lines in absorption. Several spectra of BD$+53°$2790 at moderately high resolution were presented in NR01, together with a detailed discussion of its spectral peculiarities. A representative spectrum covering a wider spectral range is given in Fig. 1. The rather strong He ii 5412Å line represents further confirmation that the underlying spectrum is that of an O-type star. Together with the blue spectrum of BD$+53°$2790 a spectrum of the O9V standard 10 Lac is also shown in Fig. 1.

There is no evidence for variability in what can be considered with certainty to be photospheric features (i.e., the Balmer lines from H and higher and all He i and He ii lines in the blue). However, it must be noted that the EW of H is Å in all our spectra (and this value should also include the blended O ii 4350 Å line), which is too low for any main sequence or giant star in the OB spectral range (Balona & Crampton 1974). Average values of EWs for different lines are indicated in Table 2. The main spectral type discriminant for O-type stars is the ratio He ii 4541Å/He i 4471Å. The quantitative criteria of Conti & Alschuler (1971), revised by Mathys (1988), indicate that BD~$+33°$2790 is an O9.5 V star, close to the limit with O9 V.
| Line | EW (Å) |
|---|---|
| He ii 4200Å | 0.4 |
| H | 2.2 |
| He i 4471Å | 1.3 |
| He ii 4541Å | 0.4 |
| He i 4713Å | 0.5 |
| He i 4923Å | 0.7 |

Representative shapes of the H line in BD~$+53°$2790 are shown in Fig. 2. In all the spectra, two emission components appear clearly separated by a deep narrow central reversal. The absorption component normally extends well below the local continuum level – which is usually referred to as a “shell” spectrum – but in some spectra, it does not reach the continuum. The red (R) peak is always stronger than the blue (V) peak, but the V/R ratio is variable.
The first case of observed strong variability happened during 1986, when the profile was observed to have changed repeatedly over a few months from a shell structure to a double-peaked feature, with the central absorption not reaching the continuum level. The second one took place in 1992, when the strength of the emission peaks decreased considerably to about the continuum level. Finally, during the summer of 2000, we again saw line profiles in which the central absorption hardly reached the continuum level alternating with more pronounced shell-like profiles.
Figure 3 displays a plot of the Full Width at Half Maximum (FWHM), V/R and peak separation (V) of the H line against its EW, for all the data from the INT. H parameters (EW, FWHM, V/R and V) were obtained for all the datasets shown in Table Multiwavelength monitoring of BD~$+53°$2790, the optical counterpart to 4U~2206+54. Given the very diverse origins of the spectra and their very different spectral resolutions, it is difficult to compare them all, as there are some effects which introduce some artificial scattering in the data. This is the case of the instrumental broadening affecting the FWHM. At a first approximation we considered that it was not necessary to account for it. Taking into account the typical spectral resolutions of our dataset –better than 3 Å in most cases– and the fact that for the majority of our spectra FWHM 11 Å(and generally Å), the instrumental broadening, a priori, can be considered negligible. Dachs et al. (1986) found a correlation between H parameters (FWHM, peak separation, EW) in Be stars. We fail to see these correlations when the entire set of spectra is used but they are present when we restrict the analysis to those spectra taken with the same instrument, see Fig. 3. There is, however, a large spread in the case of the V/R ratio. Most of the scatter in FWHM may be related to the larger uncertainties involved when the emission components are small and the line profile is separated.
Red spectra covering a larger wavelength range (such as that in Fig. 5) show also the He i 6678 Å line and sometimes the He i 7065 Å line. Like H, the He i 6678 Å line typically displays a shell profile, but the emission peaks are weaker than those of H, while the central absorption component is normally very deep. Variability in this line is also more frequent than in H. The V peak is generally dominant, but the two peaks can be of approximately equal intensities and sometimes so weak that they cannot be distinguished from the continuum. Given the apparent different behaviour of H and He i 6678Å lines, it is surprising to find that there is some degree of correlation between their parameters, as can be seen in Fig. 4, where EW of both lines from INT spectra in which both lines were visible are shown.


The upper Paschen series lines are always seen in absorption and no variability is obvious (see Fig. 5). The Paschen lines are much deeper and narrower than those observed in main-sequence OB stars by Andrillat et al. (1995) and rather resemble early B-type supergiant stars. However, it must be noted that some shell stars in the low-resolution catalogue of Andrillat et al. (1988) display -band spectra that share some characteristics with that of BD~$+53°$2790.
-band spectra are shown in Fig. 6. Unlike the OB components of several Be/X-ray binaries observed by Everall et al. (eve93 (1993); see also Everall eve95 (1995)), BD~$+53°$2790 shows no emission in He i 2.058 m (though the higher resolution spectrum suggests a weak shell profile). Br may have some emission component, but is certainly not in emission. The situation differs considerably from that seen in the -band spectrum of BD~$+53°$2790 presented by Clark et al. (1999), taken on 1996 October. There Br displays a clear shell profile with two emission peaks and He i 2.112 m is in absorption. This shows that the shell-like behaviour and variability extends into the IR.


3.2 Photometric evolution and colours
The UBVRI photometric values we obtain are , , , and . The photometric errors are typically 0.05 mag, derived from the estimated uncertainties in the zero-point calibration and colour correction. Table 1 lists our Strömgren uvby measurements.
measurements in the literature are scarce and consistent with being constant (see references in NR01). However, our more accurate set of measurements of the magnitude (or Strömgren ) show variability, with a difference between the most extreme values of mag (see Table 1), mag being also the standard deviation of all 7 measurements.
From our photometry, we find that the reddening-free parameter ()is . This value corresponds, according to the revised values for Be and shell stars calculated by Halbedel (1993), to a B1 star.
We have tried deriving the intrinsic parameters of BD $+53°$2790 from our Strömgren photometry by applying the iterative procedure of Shobbrook (1983) for de-reddening. The values obtained for the reddening from the different measurements agree quite well to (one standard deviation) and the colour averages to . This value corresponds to a B1V star according to the calibrations of Perry et al. (1987) and Popper (1980).
Our infrared photometry coverage extends for yr and is much more comprehensive than our optical photometry. The IR long-term light curve is shown in Fig. 7. Data have been binned so that every point represents the average of all the nights in a single run (excluding those with unacceptably large photometric errors).

As can be seen in Fig. 7, the range of variability is not very large, with extreme values differing by in all three bands. Variability seems to be relatively random, in the sense that there are no obvious long-term trends. The light curves for the three infrared magnitudes are rather similar in shape, suggesting that the three bands do not vary independently.
In spite of this, all colour-magnitude plots are dominated by scatter. Moreover, an analysis of the temporal behaviour shows that there is no obvious pattern in the evolution of the source on the and planes, with frequent jumps between very distant points and no tendency to remain in any particular region for any length of time.

The only plot in which a clear correlation stands out is the / diagram (see Fig. 8). In principle, one would be tempted to dismiss this correlation as the simple reflection of stronger variability in than in , since would necessarily be smaller for larger values of . However a linear regression of against also shows a clear correlation, We find , and a correlation coefficient of for . Suspecting, then, that linear correlation must be present in the / plot as well, we also performed a linear regression. In this case we found a very poor correlation.
Equally disappointing is the search for correlations between the EW of H and the color. Even though our measurements of these two quantities are not simultaneous, a look at their respective evolutions (Fig. 9) shows no clear correlation.

3.3 Periodicity searches
All the parameters of the H emission line are clearly variable: EW, FWHM, V/R ratio and peak separation. In the hope that the variation in any of these parameters could give us information about the physical processes causing them, we have searched the dataset for periodicities. The large variety of resolutions, CCD configurations and S/N ratios present in the data have hampered our attempts at a homogeneous and coherent analysis. We have made an effort, within the possibilities of the dataset, to use the same criteria to measure all parameters on all spectra. We have used several different algorithms (CLEAN, Scargle, PDM) in order to detect any obvious periodicities, but with no success. No sign of any significant periodicity has been found in any of the trials.
Likewise, we have explored possible periodicities in the infrared light curves. While the , and magnitudes seem to vary randomly, we find a striking apparent modulation of the colour. Figure 9 shows an obvious trend in the evolution of , with a suggestion that the variability (with an amplitude mag) may be (quasi-)periodic over a very long timescale, on the order of 5 y. Unfortunately, this timescale is too long compared to our coverage to allow any certainty.
We have also folded the data using the period detected in the analysis of the X-ray light curve of 4U~2206+54 (the presumably orbital 9.56-d period, see Corbet & Peele, 2001 and Ribó et al. 2005), without finding any significant periodic modulation.
4 Intensive monitoring during the summer of 2000

Considering the possibility that the lack of detectable periodicities in our dataset was due to the varying resolutions and irregular time coverage, during July 2000 we carried out more intensive spectroscopic monitoring of BD$ +53^∘ $2790. Observations were made from Skinakas (Crete) and Loiano (Italy). We collected a set of 2 to 5 spectra per night during two runs: from 17th to 20th July in Skinakas and from 26th to 31st July in Loiano. The instrumental configurations were identical to those described in Section 2.
We fear that one of our objectives, the study of possible orbital variations, may have been affected by an observational bias. The presumed orbital period of the source is 9.56 days, probably too close to the time lag (10 days) between the first observing night at Skinakas and the first observing night at Loiano. Therefore we have not been able to cover the whole orbital period. Indeed, the phases (in the 9.56 d cycle) at which the observations from Skinakas were taken, were almost coincident with the phases during the first four Loiano nights. For this reason, our coverage of the orbital period extends to only %, which is insufficient to effectively detect any sort of modulation of any parameters at the orbital period.
Again, we have measured all parameters of the H line, which are shown in Fig 10. Contrary to what we saw when considering the dataset for the 13 previous years, we find some degree of correlation between EW, FWHM and V, while V/R seems to vary independently. Since this correlation between the different line parameters seems natural, we attribute the lack of correlations within the larger dataset to the use of data of very uneven resolution and quality.
We observe obvious changes in the depth of the central absorption core in the H line, which is seen sometimes reaching below the continuum level, while in other occasions is above the continuum (see Fig 11). Similar behaviour had already been observed in 1986 (see Fig. 2, but no further examples are found in our data sample). Lines in the blue (3500–5500 Å) are much more stable, as is also the case when the longer term is considered. In this spectral range, the spectra resemble closely those obtained at other epochs, with weak emission components visible in He ii 4686Å and H.

5 Discussion
5.1 Reddening and distance to BD~$+53°$2790
The reddening to BD~$+53°$2790 can be estimated in several different ways. Photometrically, from our value of , using the correlation from Shobbrook (1983), we derive . An independent estimation can be made by using the standard relations between the strength of Diffuse Interstellar Bands (DIBs) in the spectra and reddening (Herbig 1975). Using all the spectra obtained from the Cassini telescope (for consistency), we derive from the Å DIB and from the Å DIB. All these values are consistent with each other, therefore we take the photometric value as representative of the reddening to BD~$+53°$2790.
From five measurements available in the literature (including the one presented in this work), we find . With the derived, this indicates an intrinsic colour , typical of an early-type star, confirming the validity of the reddening determination. As discussed in NR01, the value of the absorption column derived from all X-ray observations is one order of magnitude larger than what is expected from the interstellar reddening. This affirmation stands also when we consider the more accurate measurement of the absorption column (i.e., 1.010) from BeppoSax data (Torrejón et al, 2004; Masseti et al, 2004).
Averaging our 7 measurements of with the 5 measurements, we find a mean value for BD~$+53°$2790 of . Assuming a standard reddening law (), we find . If the star has the typical luminosity of an O9.5V star (, see Martins et al. martins05 (2005)), then the distance to BD~$+53°$2790 is kpc. This is closer than previous estimates (cf. NR01), because the absolute magnitudes of O-type stars have been lowered down in the most recent calibrations.
5.2 Why BD~$+53°$2790 is not a classical Be star
Since its identification with 4U 2206+54, BD~$+53°$2790 has always been considered a classical Be star, because of the presence of shell-like emission lines in the red part of its spectrum. However, the main observational characteristics of BD~$+53°$2790 differ considerably from those of a classical Be star:
-
•
The H emission line presents a permanent (at least stable during 15 years) VR asymmetry. Changes in the V/R ratio are not cyclical, as in classical Be stars undergoing V/R variability because of the presence of global one-armed oscillations (see Okazaki (2000)). Moreover, the asymmetry survives large changes in all the other parameters of the emission line and is also present when there is basically no emission, which in a classical Be star would correspond to a disc-less state. This behaviour is fundamentally different of that seen in Be/X-ray binaries, where discs undergo processes of dispersion and reformation during which they develop instabilities that lead to long-term quasi-cyclical V/R variability (e.g., Negueruela et al. 2001 and Reig et al. 2000).
-
•
In BD~$+53°$2790 we observe strong night-to-night variability in both the shape and intensity of the H emission line. These variations affect both the strength of the emission peaks and the depth of the central absorption component. If the emission line did arise from an extended quasi-Keplerian disc (as in Be stars), such variations would imply global structural changes of the disc on timescales of a few hours and/or major changes in the intrinsic luminosity of the O star. Such behaviour is unprecedented in a Be star, where the circumstellar disc is believed to evolve on viscous timescales, on the order of months (Lee et al. lee91 (1991); Porter porter99 (1997)).
-
•
Be stars display a clear correlation between the EW of H and the infrared excess and between the infrared magnitudes and infrared colours, which reflect the fact that emission lines and infrared excess are produced in an envelope that adds its emission to that of the star, e.g., Dachs & Wamsteker (1982). Such correlations are not readily detected in BD~$+53°$2790. The evolution of observables (both IR magnitudes and H line parameters) lacks any clear long-term trends. The star’s properties may be described to be highly variable on short timescales and very stable on longer timescales, without obvious long-term variations (except for, perhaps, the colour).
-
•
Photometrically, Be/X-ray systems are characterised by large variations in both magnitudes and to a lesser extent in colour (e.g, Negueruela et al. 2001; Clark et al. 1999 and Clark et al. 2001b), associated with the periods of structural changes in their circumstellar discs. In contrast, the magnitudes and colours of BD $+53°$2790 remain basically stable, with small random fluctuations, as is typical of isolated O-type stars.
As a matter of fact, the only High-Mass X-ray Binary presenting some similarities to BD~$+53°$2790 in its photometric behaviour is LS~5039/RX~J1826.2$-$1450. As BD~$+53°$2790, it displays little variability in and moderate variability in the infrared magnitudes, see Clark et al. (2001a). RX~J1826.2$-$1450 is believed to be, like 4U~2206+54, powered by accretion from the wind of a main-sequence O-type star; see McSwain & Gies (2002), Ribó et al (1999) and Reig et al. (2003).
5.3 What is BD~$+53°$2790?
We estimate that the most likely spectral classification of BD~$+53°$2790 is O9.5Vp. However some remarkable peculiarities have been noticed: while the blue spectrum of BD~$+53°$2790 suggests an 09.5 spectral type, there are a few metallic lines reminiscent of a later-type spectrum (see NR01); the UV lines support the main sequence luminosity classification, but the Paschen lines resemble those of a supergiant.
In order to obtain a measure of the rotational velocity of BD~$+53°$2790 we have created a grid of artificially rotationally broadened spectra from that of the standard O9V star 10 Lac. We have chosen 10 Lac because of its very low projected rotational velocity and because the spectrum of BD~$+53°$2790 is close to that of a O9V star. In Fig. 12 normalised profiles of a set of selected helium lines (namely, He i 4026, 4144, 4388, and 4471 Å) are shown together with the artificially broadened profile of 10~Lac, at 200 km s-1 and those rotational velocities producing upper and lower envelopes to the widths of the observed profiles of BD~$+53°$2790. The rotational velocity of BD~$+53°$2790 must be above 200 km s-1. For each line, the average of the rotational velocities yielding the upper and lower envelopes were taken as a representative measurement of the rotational velocity derived from that line. The results of these measurements are summarised in Table 3. We estimated the averaged rotational velocity of BD~$+53°$2790 to be 31570 km s-1.
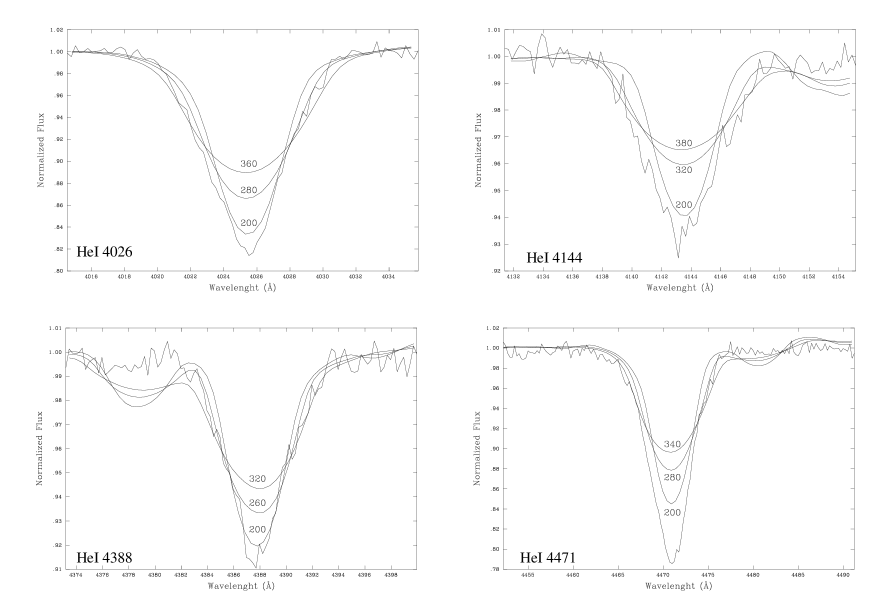
| Line | Rot. Vel. | Average |
| (Å) | (km s-1) | (km s-1) |
| He i4026 | 280 | 32040 |
| 360 | ||
| He i4144 | 320 | 35030 |
| 380 | ||
| He i4388 | 260 | 29030 |
| 320 | ||
| He i4471 | 260 | 30040 |
| 340 |
Comparison of the helium profiles with those rotationally broadened from 10~Lac shows that the observed helium profiles in BD~$+53°$2790 are stronger than what is expected for a normal O9.5V star. The strength of the He lines suggests the possibility that BD~$+53°$2790 may be related to the He-strong stars. These are a small group of stars, with spectral types clustering around B2 V, that show anomalously strong helium lines. A well known O-type star believed to be related to He-strong stars is Ori C, which is known to vary in spectral type from O6 to O7 (Donati et al. donati02 (2002), Smith & Fullerton smith05 (2005)). BD~$+53°$2790 could be the second representative of this class of objects among O-type stars. He-strong stars display a remarkable set of peculiarities: oblique dipolar magnetic fields, magnetically controlled winds, and chemical surface anomalies, among others. Usually these stars are distributed along the ZAMS (Pedersen & Thomsen, 1997; Walborn, 1982; Bohlender et al. 1987; Smith & Groote 2001).
A rich variety of phenomena have been observed in these objects: in the UV, they can show red shifted emission of the C iv and Si iv resonance lines (sometimes variable); in the optical bands they are characterized by periodically modulated H emission, high level Balmer lines appearing at certain rotational phases and periodically modulated variability in He lines, sometimes showing emission at He ii 4686 Å. They can also show photometric variability with eclipse-like light curves.
Except for the periodic modulation of the variations, BD~$+53°$2790 shares many of these peculiarities. In particular, together with the apparent high helium abundance, BD~$+53°$2790 shows variable H emission and He ii 4686 Å emission, the UV spectrum shows apparently prominent P-Cygni profiles at C iv and Si iv resonance lines (see NR01). In contrast a wind slower than expected is found (see Ribó et al. 2005), which can be an indication of some red-shifted excess of emission in these lines. In He-strong stars the wind is conducted along the magnetic field lines into a torus-like envelope located at the magnetic equator. This configuration can lead to the presence of double emission peaks in H, which resemble those seen in BD~$+53°$2790, but which usually show a modulation on the rotational period. The complexity and shape of the double peak will depend on the angle between magnetic and rotational axes and the line of sight to the observer (see Townsend et al. 2005).
A rotationally dominated circumstellar envelope is clearly present in BD~$+53°$2790, as indicated by the infrared magnitudes, the emission in Balmer and some helium lines and the correlations between H line parameters. However the structure of this circumstelar envelope clearly differs from those seen in Be stars. Following the analogy with He-strong stars, the existence of a circumstellar disk-like structure is also common to these type of objects also. The only difficulty to accept BD+53$^∘$2790 as a He-strong star is the apparent lack of rotational modulation of the emission lines parameters. Given the rotational velocities derived, we could expect a rotational period of a few days. In addition to the problems in the diverse origin of our data (see section LABEL:baddata), the sampling on time of our measurements is not adequate to find variations on time scales of a few days (modulated with the rotational period), thus we cannot discard yet the presence of rotational periodicity. The idea of a magnetically driven wind contributing to a dense disk-like structure is not strange even in the modelling of Be stars’ circumstellar envelopes. The wind compressed disk of Bjorkman & Cassinelli (bjorkman92 (1992)) was shown to be compatible with observations only if a magnetic field on the order of tens of Gauss was driving the wind from the polar caps onto the equatorial zone (Porter porter97 (1997)).
A careful inspection to the correlation seen in Fig. 4 between the He i 6678 and H EWs shows that there is a common component to the emission of both lines. H emission, then, will have at least two contributions: a P-Cygni like contribution (as seen in the 1992 spectra, see Fig. 2, where the double peak structure disappears and only the red peak survives) and an additional variable double peaked structure. The relative variation of both components may hide any periodic modulation present.
Therefore, we can conclude that this is a very peculiar O9.5V star where most likely a global strong magnetic field may be responsible for most of the behaviour seen so far.
6 Conclusion
We have presented the results of 14 years of spectroscopic and optical/infrared photometric monitoring of BD~$+53°$2790, the optical component of the Be/X-ray binary 4U 2206+54. The absence of any obvious long-term trends in the evolution of different parameters and fundamentally the absence of correlation between the EW of H and the infrared magnitudes and associated colours makes untenable a Be classification for the star. Based on a careful inspection to the source spectrum in the classification region and the peculiar behavior of the H emisson line, we conclude that the object is likely to be a single peculiar O-type star (O9.5Vp) and an early-type analogue to He-strong stars.
Acknowledgements.
We would like to thank the UK PATT and the Spanish CAT panel for supporting our long-term monitoring campaign. We are grateful to the INT service programme for additional optical observations. The 1.5-m TCS is operated by the Instituto de Astrofísica de Canarias at the Teide Observatory, Tenerife. The JKT and INT are operated on the island of La Palma by the Royal Greenwich Observatory in the Spanish Observatorio del Roque de Los Muchachos of the Instituto de Astrofísica de Canarias. The 1.5-m telescope at Mount Palomar is jointly owned by the California Institute of Technology and the Carnegie Institute of Washington. The G. D. Cassini telescope is operated at the Loiano Observatory by the Osservatorio Astronomico di Bologna. Skinakas Observatory is a collaborative project of the University of Crete, the Foundation for Research and Technology-Hellas and the Max-Planck-Institut für Extraterrestrische Physik. This research has made use of the Simbad database, operated at CDS, Strasbourg (France), and of the La Palma Data Archive. Special thanks to Dr. Eduard Zuiderwijk for his help with the archival data. We are very grateful to the many astronomers who have taken part in observations for this campaign. In particular, Chris Everall obtained and reduced the -band spectroscopy and Miguel Ángel Alcaide reduced most of the H spectra. P.B. acknowledges support by the Spanish Ministerio de Educación y Ciencia through grant ESP-2002-04124-C03-02. I.N. is a researcher of the programme Ramón y Cajal, funded by the Spanish Ministerio de Educación y Ciencia and the University of Alicante, with partial support from the Generalitat Valenciana and the European Regional Development Fund (ERDF/FEDER). This research is partially supported by the Spanish MEC through grants AYA2002-00814 and ESP-2002-04124-C03-03.References
- Andrillat et al. (1988) Andrillat, Y., Jaschek, M., & Jaschek, C. 1988, A&AS, 72, 129
- Andrillat et al. (1995) Andrillat, Y., Jaschek, M., & Jaschek, C. 1995, A&AS, 112, 475
- Balona & Crampton (1974) Balona, L., & Crampton, D. 1974, MNRAS, 166, 203
- (4) Bjorkman J.E., & Cassinelli J.E. 1992, In: Nonisotropic and Variable Outflows from Stars, San Francisco, ASP Conference Series, 22, 88
- Blay et al. (2005) Blay P., Ribó M., Negueruela, I., et al. 2005, A&A, 438, 963
- (6) Bohlender, D.A., Brown, D.N., Landstreet, J.D., & Thompson, I.B. 1987, ApJ, 323,325
- (7) Buscombe, W. 1969, MNRAS, 143, 1
- Clark et al. (1999) Clark, J.S., Lyuty, V.M., Zaitseva, G. V., et al. 1999, MNRAS, 302, 167
- Clark et al. (2001a) Clark, J.S., Reig, P., Goodwin, S.P., et al. 2001a, A&A, 376, 476
- Clark et al. (2001b) Clark, J.S., Tarasov, A.E., Okazaki, A.T., et al. 2001b, A&A, 380, 615
- Conti & Alschuler (1971) Conti, P. S & Alschuler, W. R 1971, ApJ, 170, 325
- Corbet & Peele (2001) Corbet, R.H.D., & Peele, A.G. 2001, ApJ 562, 936
- Dachs & Wamsteker (1982) Dachs, J., & Wamsteker, W. 1982, A&A, 107, 240
- Dachs et al. (1986) Dachs J., Hanuschik, R., Kaiser, D., Rohe, D. 1986, A&A, 159, 276
- (15) Donati, J.F., Babel, J., Harries, T.J., Howarth, I.D., Petit, P., & Semel, M. 2002, MNRAS, 333,55
- (16) Everall, C. 1995, Ph. D. Thesis, University of Southampton
- (17) Everall, C., Coe, M.J., Norton, A.J., et al. 1993, MNRAS, 262, 57
- Giacconi et al. (1972) Giacconi, R., Murray, S., Gursky, H., Kellogg, E., Schreier, E., & Tananbaum, H. 1972 ApJ., 178, 281
- (19) Halbedel, E. M. 1993, PASP, 105, 465
- Hanuschik et al. (1988) Hanuschik, R.W., Kozok, J.R., & Kaiser, D. 1988, A&A, 189, 147
- Herbig (1975) Herbig, G.H. 1975, ApJ, 196, 129
- (22) Howarth, I., Murray, J., Mills, D., & Berry, D.S. 1997, Starlink User Note 50.20, R.A.L.
- Landolt et al. (1992) Landolt, A. U. 1992, AJ, 104, 340
- (24) Lee, U., Saio, H., Osaki, Y. 1991, MNRAS, 250, 432
- (25) Manfroid, J. 1993, A&A, 271, 714
- (26) Martins, F., Schaerer, D., & Hillier, D. J. 2005, A&A, 436, 1049
- Masetti et al. (2004) Masetti, N., Dal Fiume, D., Amati, L., Del Sordo, S., Frontera, F., Orlandini, M., Palazzi, E. 2004, A&A, 423, 311
- Mathys (1988) Mathys, G. 1988, A&AS, 76, 427
- McSwain & Gies (2002) McSwain, M.V., & Gies, D.R. 2002, ApJ, 568, L27
- Negueruela et al. (2001) Negueruela, I., Okazaki, A.T., Fabregat, J, et al. 2001, A&A, 369, 117
- Negueruela and Reig (2001) Negueruela, I., & Reig, P. 2001, A&A, 371, 1056
- Okazaki (2000) Okazaki A.T., 2000a, In: Smith M., Henrichs H.F., Fabregat J. (eds.) IAU Colloq. 175, The Be Phenomenon in Early-Type Stars, San Francisco, ASP Conf. Series, 214, 409
- (33) Pedersen, H. & Thomsen, B. 1977, A&AS, 30, 11
- Perry et al. (1987) Perry, C.L., Olsen, D.H., & Crawford, D.J. 1987, PASP, 99, 1184
- Popper (1980) Popper, D.M. 1980, ARA&A, 18, 115
- (36) Porter, J.M. 1997 A&A, 324, 597
- (37) Porter, J.M. 1999 A&A, 348, 512
- Reig et al. (2000) Reig, P., Negueruela, I., Coe, M.J., et al. 2000, MNRAS, 317, 205
- Reig et al. (2003) Reig, P., Ribó, M., Paredes, J. M., & Martí, J. 2003, A&A, 405, 285
- Ribó et al. (1999) Ribó, M., Reig, P., Martí, J., & Paredes, J. M. 1999, A&A, 347, 518
- Ribó et al. (2005) Ribó M., et al. 2005, A&A, submitted
- Saraswat& Apparao (1992) Saraswat, P., & Apparao, K. M. V. 1992, ApJ, 401, 678
- Shobbrook (1983) Shobbrook, R.R. 1983, MNRAS, 205, 1215
- (44) Shortridge, K., Meyerdicks, H., Currie, M., et al. 1997, Starlink User Note 86.15, R.A.L
- (45) Smith, M. A. & Fullerton, A. W. 2005, PASP, 117, 13
- (46) Smith, M. A. & Groote, D. 2001, A&A, 372, 208
- Steiner et al. (1984) Steiner, J.E., Ferrara, A., Garcia, M., et al. 1984, ApJ, 280, 688
- Torrejón et al. (1997) Torrejón, J. M., Kreykenbohm, I., Orr, A., Titarchuk, L., Negueruela, I. 2004 A&A, 423, 301
- (49) Townsend, R.H.D. & Owocki, S.P. 2005, MNRAS, 357,251
- (50) Walborn, N.R. 1982, PASP, 94, 322
- Warwick et al. (1981) Warwick, R. S., Marshall, N., Fraser, G. W. et al. 1981 MNRAS, 197, 865
- Zuiderwijk et al. (1994) Zuiderwijk, E. J., Martin, R., Raimond, E., & van Diepen, G. N. J. 1994, PASP, 106, 515
| Date | Tel | Configuration | Detector | Range (Å) |
|---|---|---|---|---|
| Jul 17, 2000 | SKI | grating 1302 l/mm blazed at 5500Å | SITe | 5520 - 7560 |
| Jul 18, 2000 | SKI | grating 1302 l/mm blazed at 5500Å | SITe | 5520 - 7560 |
| Jul 19, 2000 | SKI | grating 1302 l/mm blazed at 5500Å | SITe | 5520 - 7560 |
| Jul 20, 2000 | SKI | grating 1302 l/mm blazed at 5500Å | SITe | 5520 - 7560 |
| Jul 21, 2000 | SKI | grating 1302 l/mm blazed at 4800Å | SITe | 3800 - 5700 |
| Jul 22, 2000 | SKI | grating 1302 l/mm blazed at 4800Å | SITe | 3800 - 5700 |
| Jul 25, 2000 | BOL | BFOSC + gr#6 | EEV | 3100 - 5300 |
| Jul 25, 2000 | BOL | BFOSC + gr#7 | EEV | 4200 - 6700 |
| Jul 25, 2000 | BOL | BFOSC + gr#8 | EEV | 6100 - 8200 |
| Jul 26, 2000 | BOL | BFOSC + gr#6 | EEV | 3100 - 5300 |
| Jul 26, 2000 | BOL | BFOSC + gr#7 | EEV | 4200 - 6700 |
| Jul 26, 2000 | BOL | BFOSC + gr#8 | EEV | 6100 - 8200 |
| Jul 27, 2000 | BOL | BFOSC + gr#6 | EEV | 3100 - 5300 |
| Jul 27, 2000 | BOL | BFOSC + gr#7 | EEV | 4200 - 6700 |
| Jul 27, 2000 | BOL | BFOSC + gr#8 | EEV | 6100 - 8200 |
| Jul 28, 2000 | BOL | BFOSC + gr#6 | EEV | 3100 - 5300 |
| Jul 28, 2000 | BOL | BFOSC + gr#7 | EEV | 4200 - 6700 |
| Jul 28, 2000 | BOL | BFOSC + gr#8 | EEV | 6100 - 8200 |
| Jul 29, 2000 | BOL | BFOSC + gr#6 | EEV | 3100 - 5300 |
| Jul 29, 2000 | BOL | BFOSC + gr#8 | EEV | 6100 - 8200 |
| Jul 29, 2000 | BOL | BFOSC + gr#9+#10 | EEV | 3750 - 8000 |
| Jul 30, 2000 | BOL | BFOSC + gr#8 | EEV | 6100 - 8200 |
| Jul 30, 2000 | BOL | BFOSC + gr#9+#10 | EEV | 3750 - 8000 |
| Oct 05, 2000 | SKI | grating 1302 l/mm blazed at 5500Å | SITe | 5520 - 7560 |
| Oct 16, 2000 | SKI | grating 1302 l/mm blazed at 5500Å | SITe | 5520 - 7560 |
| Oct 17, 2000 | SKI | grating 1302 l/mm blazed at 4800Å | SITe | 3800 - 5700 |
[x]l c c c c c l Log of spectroscopic observations. Some representative spectra are displayed in Fig. 2 (marked with ’*’)
Date Tel Configuration Detector Range EW of H
(Å) (Å)
\endfirstheadTable Multiwavelength monitoring of BD~$+53°$2790, the optical counterpart to 4U~2206+54: Continued.
Date Tel Configuration Detector Range EW of H
(Å) (Å)
\endhead\endlastfootContinued… \endfootMay 28, 1986(*) INT IDS + 500 mm GEC1 6450 6830
Jul 26, 1986(*) INT IDS + 500 mm GEC1 6495 6695
Aug 03, 1986 INT IDS + 235 mm IPCS 6010 7020
Aug 04, 1986 INT IDS + 235 mm IPCS 6010 7020
Sep 07, 1986 INT IDS + 235 mm GEC1 4000 8000
Oct 09, 1986(*) INT IDS + 500 mm GEC1 6465 6665
Dec 24, 1986(*) INT IDS + 500 mm GEC1 6250 6875
Jun 12, 1987 INT IDS + 235 mm GEC1 6330 6770
Jun 20, 1987 INT IDS + 235 mm GEC1 6080 6900
Aug 13, 1987(*) INT IDS + 500 mm GEC1 6375 6765
Aug 28, 1987 INT IDS + 235 mm GEC1 6340 6770
Sep 08, 1987 INT IDS + 500 mm GEC1 6340 6730
May 19, 1988 INT IDS + 500 mm IPCS 6240 6720
Aug 02, 1988(*) INT IDS + 235 mm GEC4 6230 6860
Sep 26, 1988 INT IDS + 500 mm GEC4 6455 6655
Oct 12, 1988 INT IDS + 500 mm GEC4 6325 6950
Jun 02, 1989 INT IDS + 235 mm IPCS 6230 6875
Jun 11, 1989 INT IDS + 235 mm IPCS 5970 7010
Jul 31, 1989(*) INT IDS + 235 mm IPCS 6205 6870
Jul 24, 1990 INT IDS + 235 mm GEC6 6350 6780
Sep 02, 1990 INT IDS + 235 mm GEC6 6345 6775
Dec 27, 1990 INT IDS + 500 mm GEC6 6470 6670
Aug 28, 1991(*) INT IDS + 500 mm GEC6 6480 6680
May 18, 1992(*) PAL f/8.75 Cass CCD9 6255 6938
May 19, 1992 PAL f/8.75 Cass CCD9 6522 6663
Aug 16, 1992(*) PAL f/8.75 Cass CCD9 6255 6930
Aug 17, 1992 PAL f/8.75 Cass CCD9 6255 6930
Aug 18, 1992 PAL f/8.75 Cass CCD9 6255 6930
Sep 23, 1993(*) PAL f/8.75 Cass CCD9 6280 6960
Dec 05, 1993 PAL f/8.75 Cass CCD9 6259 6936
Dec 06, 1993 PAL f/8.75 Cass CCD9 4300 5000
Dec 07, 1993 PAL f/8.75 Cass CCD9 6260 6940
Mar 26, 1994 JKT RBS EEV7 5700 6710
Mar 27, 1994 JKT RBS EEV7 5700 6710
Jun 25, 1994 JKT RBS EEV7 4200 5200
Jun 26, 1994 JKT RBS EEV7 6070 7040
Jun 27, 1994 JKT RBS EEV7 4200 5200
Sep 16, 1994(*) JKT RBS EEV7 5825 6890
Sep 16, 1994 JKT RBS EEV7 8100 9100
Sep 17, 1994 JKT RBS EEV7 3900 4950
Jul 11, 1995 INT IDS + 235 mm TEK3 4080 4940
Jul 12, 1995(*) INT IDS + 235 mm TEK3 6430 7286
Aug 04, 1995 JKT RBS TEK4 6360 7265
Aug 04, 1995 JKT RBS TEK4 8200 9000
Aug 05, 1995 JKT RBS TEK4 4100 5050
Aug 06, 1995 JKT RBS TEK4 6420 6755
Aug 07, 1995 JKT RBS TEK4 4000 4450
Sep 22, 1995 CRAO Coude EEV1511 4400 4950
Nov 29, 1995 JKT RBS TEK4 6100 6900
Jun 30, 1997 CRAO Coude EEV1511 4200 5100
Oct 26, 1997 JKT RBS TEK4 5904 6818
Oct 27, 1997 JKT RBS TEK4 8200 9000
Oct 28, 1997(*) JKT RBS TEK4 6380 6720
Aug 03, 1998 INT IDS + 235 mm EEV42 3700 5050
Aug 04, 1998(*) INT IDS + 235 mm EEV42 5800 7100
Aug 31, 1998 CRAO Coude EEV1511 6530 6600
Aug 31, 1998 CRAO Coude EEV1511 6645 6620
Jul 26, 1999 SKI 1201 line mm-1 grating ISA SITe CCD 5520 7560
Aug 17, 1999(*) BOL BFOSC + gr#9+#12 Loral 5300 9000
Aug 17, 1999 BOL BFOSC + gr#7 Loral 4200 6700
Aug 22, 1999 BOL BFOSC + gr#8 Loral 6100 8200
Aug 22, 1999 BOL BFOSC + gr#7 Loral 4200 6700
\LT@array[x]l c c c c c l Observational details, IR photometry.
Date MJD J H K L′ Telescope
\endfirstheadTable Multiwavelength monitoring of BD~$+53°$2790, the optical counterpart to 4U~2206+54: Continued.
Date MJD J H K L′ Telescope
\endhead\endlastfootContinued… \endfoot
Sep 06, 1987 47044.5 9.370.03 9.260.03 9.090.03 9.00.4 TCS
Sep 11, 1987 47049.5 9.700.04 9.480.04 9.280.04 TCS
Nov 24, 1987 47123.5 9.160.03 9.080.03 8.920.03 8.710.06 UKIRT
Dec 28, 1987 47157.5 9.260.03 9.160.03 9.060.03 TCS
Jan 01, 1988 47161.5 9.280.04 9.100.04 8.990.04 8.80.4 TCS
Jan 03, 1988 47163.5 9.240.03 9.080.03 8.970.03 8.80.3 TCS
Jun 23, 1988 47335.5 9.280.04 9.170.04 9.010.04 TCS
Jun 24, 1988 47336.5 9.250.03 9.150.03 8.980.03 TCS
Jun 28, 1988 47340.5 9.160.04 9.110.04 9.000.04 TCS
Apr 14, 1991 48360.5 9.250.02 9.120.03 9.050.02 TCS
Apr 17, 1991 48363.5 9.260.06 9.120.03 9.030.02 TCS
Aug 23, 1991 48491.5 9.220.03 9.080.02 9.010.02 TCS
Aug 24, 1991 48492.5 9.160.09 9.040.05 9.000.05 TCS
Aug 25, 1991 48493.5 9.180.04 9.050.03 8.950.03 TCS
Aug 27, 1991 48495.5 9.170.03 9.060.02 9.000.03 TCS
Aug 28, 1991 48496.5 9.190.04 9.050.03 8.980.05 TCS
Nov 29, 1991 48589.5 9.300.10 9.100.10 9.000.10 TCS
Dec 01, 1991 48591.5 9.240.05 9.080.04 9.010.04 TCS
Jul 20, 1992 48823.5 9.220.03 9.110.03 8.980.05 TCS
Aug 04, 1992 48838.5 9.330.09 9.090.04 8.930.05 TCS
Aug 21, 1992 48855.5 9.290.04 9.070.03 9.030.06 TCS
Aug 21, 1992 48855.5 9.250.05 9.070.03 8.940.06 TCS
Aug 22, 1992 48856.5 9.140.06 9.040.04 9.070.04 TCS
Aug 23, 1992 48857.5 9.290.07 9.160.09 9.110.06 TCS
Jan 12, 1993 48999.5 9.200.03 9.070.01 8.980.02 TCS
Jun 22, 1993 49160.5 9.230.01 9.170.01 9.090.01 8.910.03 UKIRT
Jun 30, 1993 49169.5 9.270.03 9.140.02 9.020.02 8.90.3 UKIRT
Jul 06, 1993 49175.5 9.260.02 9.140.03 9.030.02 8.90.2 UKIRT
Jul 07, 1993 49176.5 9.260.03 9.150.02 9.050.03 UKIRT
Dec 20, 1993 49341.5 9.110.01 9.110.01 8.950.02 TCS
Dec 20, 1993 49341.5 9.110.01 9.080.01 8.930.01 TCS
Dec 20, 1993 49341.5 9.180.03 9.060.01 8.990.06 TCS
Dec 21, 1993 49342.5 9.260.02 9.180.01 9.090.03 TCS
Dec 21, 1993 49342.5 9.270.03 9.130.01 9.130.01 TCS
Jun 08, 1994 49511.5 9.160.02 9.160.01 9.010.01 TCS
Jun 09, 1994 49512.5 9.280.01 9.130.02 9.060.03 TCS
Jun 10, 1994 49513.5 9.160.03 9.070.01 9.040.03 TCS
Jun 11, 1994 49514.5 9.240.06 9.280.04 9.170.05 TCS
Jun 21, 1994 49524.5 9.220.01 9.120.01 9.030.01 TCS
Jun 26, 1994 49529.5 9.220.02 9.140.01 9.060.03 TCS
Jun 28, 1994 49531.5 9.220.01 9.150.01 9.030.01 TCS
Jun 30, 1994 49533.5 9.240.01 9.090.02 9.080.02 TCS
Jul 01, 1994 49534.5 9.170.01 9.120.01 8.990.00 TCS
Jul 02, 1994 49535.5 9.260.02 9.200.01 9.090.01 TCS
Jul 03, 1994 49536.5 9.270.02 9.170.01 9.120.01 TCS
Nov 05, 1994 49661.5 9.160.01 9.090.01 9.060.01 TCS
Nov 06, 1994 49662.5 9.010.01 8.940.01 8.900.01 TCS
Nov 07, 1994 49663.5 9.280.02 9.210.01 9.140.02 TCS
Nov 08, 1994 49664.5 9.290.02 9.180.01 9.080.00 TCS
Nov 09, 1994 49665.5 9.210.01 9.110.01 9.080.01 TCS
Jan 02, 1995 49719.5 9.230.01 9.150.01 9.030.01 TCS
Jan 03, 1995 49720.5 9.120.01 9.070.01 9.000.01 TCS
Jan 05, 1995 49722.5 9.140.02 9.090.01 8.990.01 TCS
Apr 24, 1995 49831.5 9.160.01 9.070.01 9.020.02 TCS
Apr 25, 1995 49832.5 9.210.01 9.120.01 9.070.00 TCS
Apr 26, 1995 49833.5 9.250.01 9.130.01 9.030.01 TCS
Apr 28, 1995 49835.5 9.230.01 9.140.01 9.050.01 TCS
Apr 29, 1995 49836.5 9.200.01 9.080.01 9.040.01 TCS
Jul 28, 1995 49926.5 9.220.02 9.120.01 9.090.15 TCS
Jul 28, 1995 49926.5 9.230.01 9.040.01 9.600.13 TCS
Jul 29, 1995 49927.5 9.180.01 9.060.01 8.940.06 TCS
Jul 29, 1995 49927.5 9.190.01 9.040.01 9.090.11 TCS
Jul 31, 1995 49929.5 9.270.01 9.100.01 8.950.01 TCS
Oct 11, 1995 50001.5 9.360.01 9.170.01 9.000.00 TCS
Oct 14, 1995 50004.5 9.150.01 9.030.01 8.900.01 TCS
Jul 27, 1996 50291.5 9.400.01 9.250.01 9.070.00 TCS
Jul 28, 1996 50292.5 9.140.01 9.030.01 8.920.01 TCS
Jul 16, 1997 50645.5 9.200.01 9.090.01 8.980.01 TCS
Jul 17, 1997 50646.5 9.180.01 9.060.01 8.960.01 TCS
Jul 19, 1997 50648.5 9.170.01 9.070.01 8.990.00 TCS
Jun 15, 1998 50979.5 9.160.01 9.090.01 8.980.01 TCS
Jun 16, 1998 50980.5 9.120.01 9.070.01 8.980.01 TCS
Jun 17, 1998 50981.5 9.190.01 9.100.01 8.990.00 TCS
Oct 27, 1998 51113.5 9.290.01 9.170.01 9.130.00 TCS
Jul 26, 1999 51385.5 9.230.02 9.120.02 9.090.02 TCS
Jul 28, 1999 51387.5 9.200.02 9.130.02 9.050.02 TCS
Jul 31, 1999 51390.5 9.220.02 9.130.02 9.060.02 TCS
Oct 02, 1999 51453.5 9.180.02 9.080.02 8.980.02 TCS
Oct 04, 1999 51455.5 9.200.02 9.100.02 9.030.02 TCS
Oct 05, 1999 51456.5 9.200.02 9.130.01 9.020.02 TCS
Jan 15, 2001 51924.5 9.200.02 9.080.02 8.960.02 TCS