Large-scale magnetized outflows from the Virgo Cluster spiral NGC 4569
Using the Effelsberg radio telescope at 4.85 GHz and 8.35 GHz we discovered large symmetric lobes of polarized radio emission around the strongly Hi deficient Virgo cluster spiral galaxy NGC 4569. These lobes extend up to 24 kpc from the galactic disk. Our observations were complemented by 1.4 GHz continuum emission from existing Hi observations. This is the first time that such huge radio continuum lobes are observed in a cluster spiral galaxy. The eastern lobe seems detached and has a flat spectrum typical for in-situ cosmic ray electron acceleration. The western lobe is diffuse and possesses vertical magnetic fields over its whole volume. The lobes are not powered by an AGN, but probably by a nuclear starburst producing supernovae which occurred Myr ago. Since the radio lobes are symmetric, they resist ram pressure due to the galaxy’s rapid motion within the intracluster medium.
Key Words.:
Galaxies: individual: NGC 4569, IC 3583 – Galaxies: magnetic fields – Radio continuum: galaxies1 Introduction
NGC 4569 is a bright spiral galaxy (Sb) whose projected angular distance to the Virgo Cluster center (M87) is only Mpc111We use a distance to the Virgo cluster of Mpc.. Because of it brightness and large diameter ( kpc) Stauffer et al. (stauffer (1986)) have questioned its cluster membership. NGC 4569 has about one tenth the Hi content of a field galaxy of the same morphological type and the same size (Giovanelli & Haynes giovanelli (1983)). It shows a strongly truncated Hi disk (Cayatte et al. cayat1 (1990)), most probably a signature of strong stripping by the intracluster medium which pervades the Virgo cluster (Cayatte et al. cayat2 (1994)). Tschöke et al. (tschoke (2001)) did not find any soft X-ray emission (0.1–0.4 keV) from the northern half of the disk, whereas it is pronounced in the southern disk (cf. Fig 1). These findings are consistent with a ram pressure scenario where the galaxy is moving to the north-east through the intracluster medium. The H emission distribution is, as the Hi, sharply truncated at 30% of the optical radius (Koopmann et al. koopmann (2001)). In addition, an anomalous Hi and H arm is detected to the west of the galactic disk. Simulated Hi gas distributions and velocity fields of a more edge-on ram pressure stripping event (the inclination angle between the disk and the orbital plane is ), where the maximum ram pressure occurred Myr ago, are consistent with the Hi observations (Vollmer et al. vollm2 (2004)).
Tschöke et al. (tschoke (2001)) discovered a diffuse extraplanar region of X-ray and H emission to the west of the galactic disk. This was the first evidence of a direct connection between the hot X-ray gas and the H emission at scales of 10 kpc. This ionized gas is flowing out from the disk at a velocity of 120 km s-1 (Bomans et al. bomans05 (2005)). The most probable source of this outflow is a central starburst (Barth & Shields barth00 (2000), Tschöke et al. tschoke (2001)). Present-day AGN activity is ruled out due to the lack of a compact point source in the ASCA hard band (Tschöke et al. tschoke (2001)), a missing radio continuum point source (Neff & Hutchings neff (1992), Hummel et al. hummel (1987)), and spectral synthesis analysis (Barth & Shields barth00 (2000)). Gabel & Bruhweiler (gabel (2002)) dated the nuclear starburst in the inner pc to Myr based on optical and UV HST spectra. In addition, Keel (keel (1996)) found a more extended ( pc) population of A-type supergiants whose age is greater than Myr. Thus the nucleus of NGC 4569 contains at least two distinct young stellar populations: a very young UV core ( Myr) and a spatially more extended region dominated by A supergiants.
In this work we use radio polarimetry to study the gas outflows from NGC 4569. Total power emission and, first of all, polarized radio continuum emission represent a very sensitive tracer of flows of diffuse magnetized gas, often unnoticed in the Hi and H lines or in X-rays (Beck et al. beck99 (1999), Soida et al. soi4414 (2002)). While the polarization allows to study the magnetic field in the plane of the sky, the Faraday rotation measures the sign and strength of the magnetic fields along the line-of-sight. The knowledge of the spectral index variations across radio continuum structures allows to trace the history of relativistic electron population transported with the gas and magnetic fields. In the absence of an in-situ acceleration mechanism the relativistic electrons lose their energy via synchrotron emission. Since electrons with higher energies lose their energy more rapidly, the radio spectrum steepens with time (electron aging). To obtain maps of Faraday rotation measures and spectral index we performed observations at two frequencies: 4.85 GHz and 8.35 GHz. Additionally we used the Hi continuum at 1.4 GHz obtained by Vollmer et al. (vollm2 (2004)). The observations and the data reduction are presented in Sect. 2. The results are shown in Sect. 3 and discussed in Sect. 4. Finally, we give our conclusions in Sect. 5.
2 Observations and data reduction
Observations at 8.35 GHz and with 1.1 GHz receiver bandwith were made using the single-horn receiver in the secondary focus of the 100-m Effelsberg radio telescope222The 100-m telescope at Effelsberg is operated by the Max-Planck-Institut für Radioastronomie (MPIfR) on behalf of the Max-Planck-Gesellschaft.. The galaxy has been observed by making the maps (called coverages), scanned alternatively in R.A. and Dec. A total of 22 coverages was obtained. Four data channels were recorded. The first two channels contain total power signals. The correlations of the left- and right-handed circular polarization signals (giving Stokes Q and U) are recorded in the other two channels. At 4.85 GHz we used the two-horn system in the secondary focus of the Effelsberg telescope with the receiver of 0.5 GHz bandwith. Four data channels (two Stokes I as well as Q and U – see above) were recorded for each horn. We obtained 10 azimuth-elevation coverages of NGC 4569.
The telescope pointing was checked at time intervals of about 2 hours by making cross-scans of nearby strong point sources. The flux density scale was calibrated by mapping the highly polarized source 3C286 and computing its total power flux densities of 4.47 Jy at 8.35 GHz and 7.44 Jy at 4.85 GHz using the formulae of Baars et al. (baars (1977)). The same calibration factors were used for total power and polarized intensity, which yields a mean degree of polarization of 3C286 of 11% at 8.35 GHz and 10.5% at 4.85 GHz, in agreement with published values (Tabara & Inoue tabara (1980)).
The data reduction was performed using the NOD2 data reduction package (Haslam haslam (1974)). At 8.35 GHz all the total power coverages were combined into the final Stokes I map using the spatial frequency weighting method (Emerson & Gräve emgrav (1988)). At 4.85 GHz we combined the total power information from both horns, using the ”software beam-switching” technique (Morsi & Reich morsi (1986)). This was followed by a restoration of total intensities (Emerson et al. emerson (1979)), map transformation to R.A./Dec. coordinates and spatial frequency-weighted combination leading to the final Stokes I map.
Because of azimuthal mounting of the radio telescope the Q and U data at both frequencies were corrected for the rotation of the telescope reference frame of polarization with respect to the sky. At 8.35 GHz the distributions of Stokes parameters were combined into final Q and U maps using the same technique as for total power data. At 4.85 GHz the Stokes U and Q data for each coverage from both horns were averaged, then rotated to the R.A./Dec. frame and combined into final Q and U maps. A digital filtering process, which removes spatial frequencies corresponding to noisy structures smaller than the telescope beamwidth, was applied to final maps of all the Stokes parameters at both frequencies. The Q and U maps were finally converted into maps of polarized intensity, accounted for the ”positive noise bias” in the way described by Wardle & Kronberg (wardle (1974)). We also computed the distributions of apparent (i.e. uncorrected for Faraday rotation – small in our case) polarization B-vectors, defined as .
Instrumental polarization of the Effelsberg radio telescope forms specific ”butterfly patterns” in Q and U maps at the level of about 1% of an unpolarized signal (see Klein et al. klein (1982) for examples). They yield an almost axisymmetric structure in polarized intensity and in orientation of polarization vectors, constant in the reference frame of the telescope. Corrections for the azimuthal mounting makes the vectors of instrumental polarization rotated by the parallactic angle. In case of observations at a wide range of parallactic angles (which is our case) the superposition of spurious polarization patterns with various angles reduces the influence of instrumental polarization by factor of several. With the unpolarized intensities discussed in further Sections any instrumental polarization is in our case well below the noise.
The r.m.s. noise levels in total and polarized intensity at 8.35 GHz are 0.25 mJy/b.a. and 0.045 mJy/b.a., respectively. At 4.85 GHz the corresponding noise levels are 0.4 mJy/b.a. in total intensity and 0.09 mJy/b.a. in polarized intensity.
At 1.4 GHz we used the continuum residuals after subtracting the Hi line signal from the observations by Vollmer et al. (vollm2 (2004)). Because of a low sensitivity (bandwidth of only 3 MHz) a convolution to the beamwidth of was applied to show the low-surface brightness structure. No polarization information was recorded at this frequency. The r.m.s. noise level in this map is 0.3 mJy/b.a.
3 Results
3.1 The global distribution of radio emission at 4.85 GHz
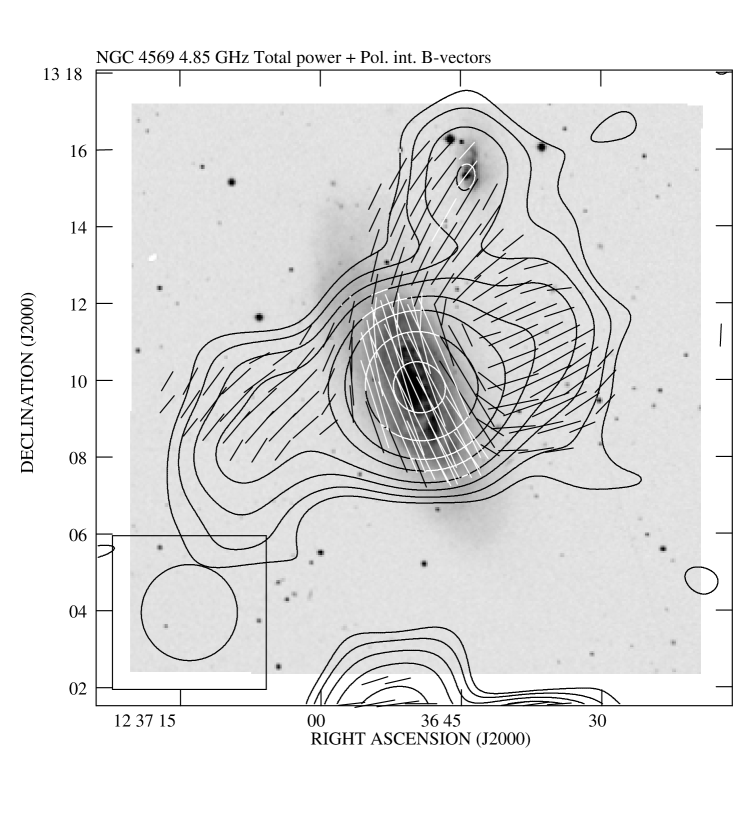
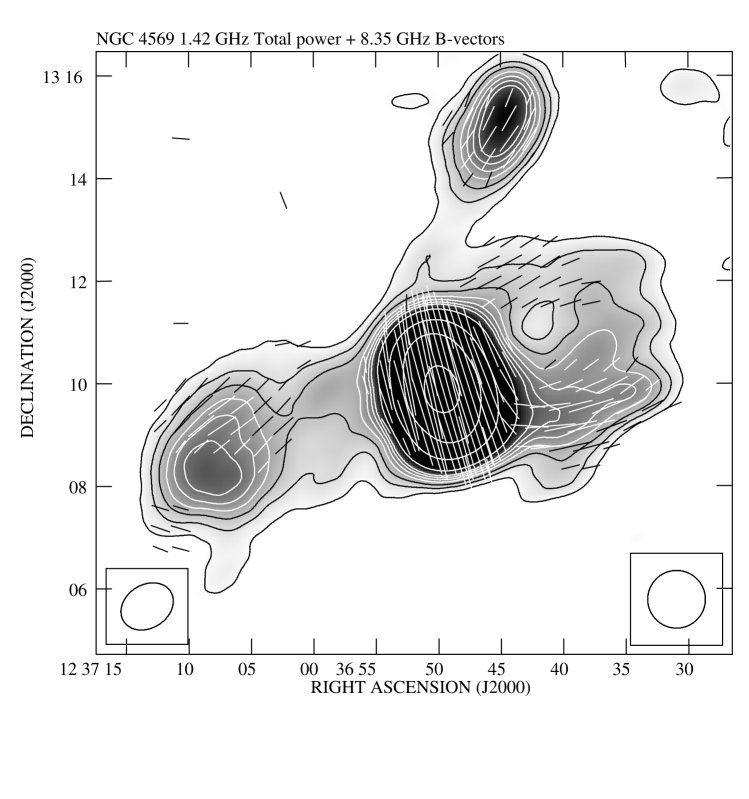
In contrast to the X-ray emission (Tschöke et al. tschoke (2001)) the total power brightness at 4.85 GHz shows large extensions on both sides of the galactic disk (Fig. 1). These large structures were totally unexpected. In the eastern lobe the radio surface brightness initially decreases shortly with distance up to about 6′( kpc) and then quickly drops. The western lobe is coincident with the X-ray emission and shows a more gradual decrease in surface brightness. Its extent is smaller than the eastern lobe (4′ kpc). At the position of the dwarf galaxy IC 3583 bright total power emission is seen.
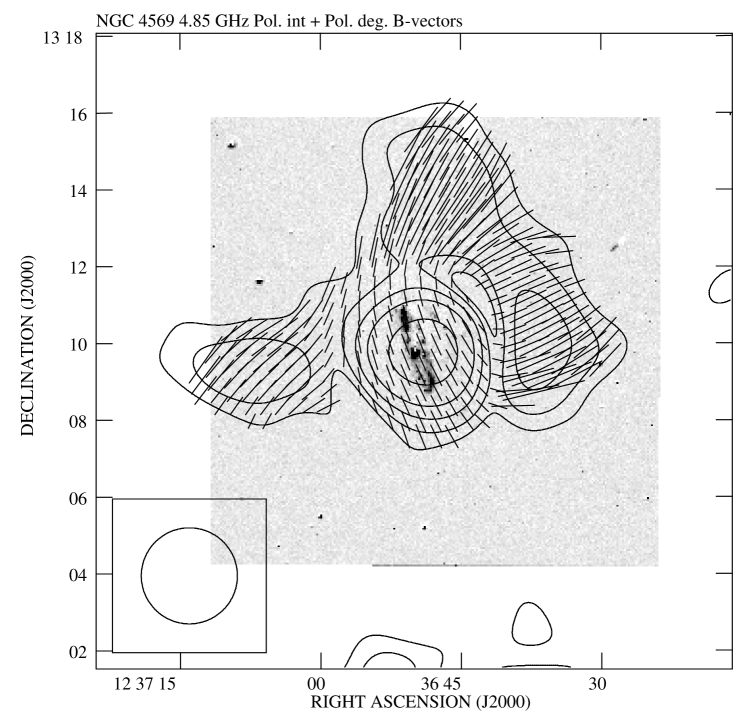
The disk of NGC 4569 and both lobes show significant polarization at 4.85 GHz (Fig. 1, 2). In the disk the B-vectors (i.e. E-vectors rotated by 90°) are parallel to the disk plane, but in the extended radio structures the B-vectors are mostly perpendicular to the disk. The mean polarization degree in the disk is 5% increasing to 15% in the extraplanar radio-emitting regions. The radio emission from IC 3583 is polarized as well, with a degree of polarization of about 12%. The B-vectors are oriented towards NGC 4569.
The polarized intensity in the eastern lobe forms a structure elongated perpendicularly to the disk, only barely resolved along its minor axis (Fig. 2). In contrast, the polarized emission on the western side extends smoothly along the whole disk edge. Even taking into account the beam-smeared contribution from IC 3583 leaves the polarization considerably more extended along the disk on the western than on the eastern disk side.
3.2 Details of the radio structure at 8.35 GHz and 1.4 GHz
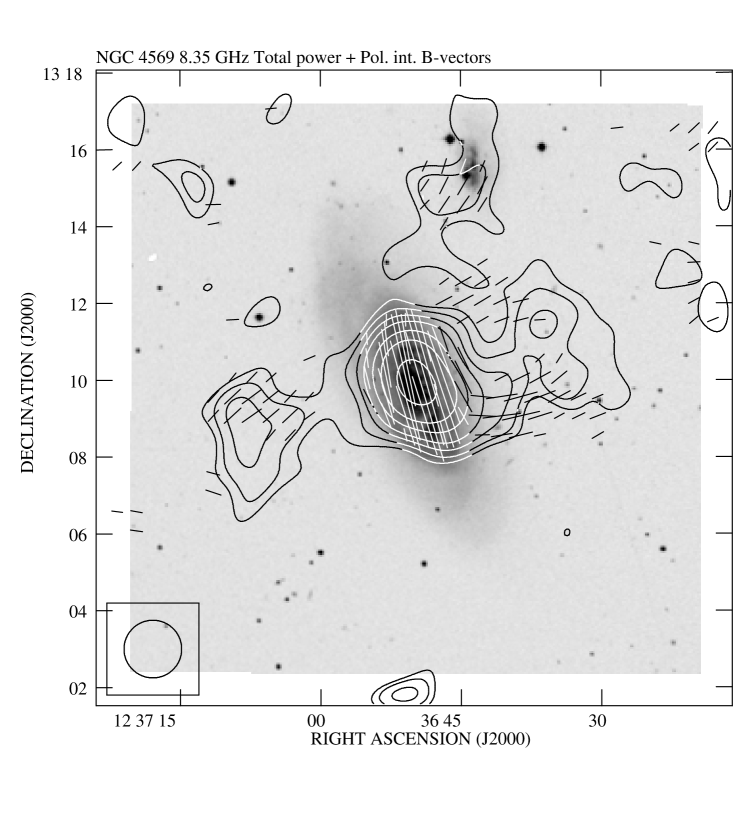
Our maps at 8.35 GHz with an angular resolution of 15 show the details of the total power and polarization structure of NGC 4569 (Fig. 3). The eastern lobe appears to be a detached region with some hints of a radio bridge connecting it to the disk. Only its northern part is polarized by some 10% with B-vectors almost perpendicular to the disk. The western lobe has a similar shape in total power. However, it is somewhat weaker at 8.35 GHz than the eastern region. On this image IC 3583 is separated from NGC 4569.
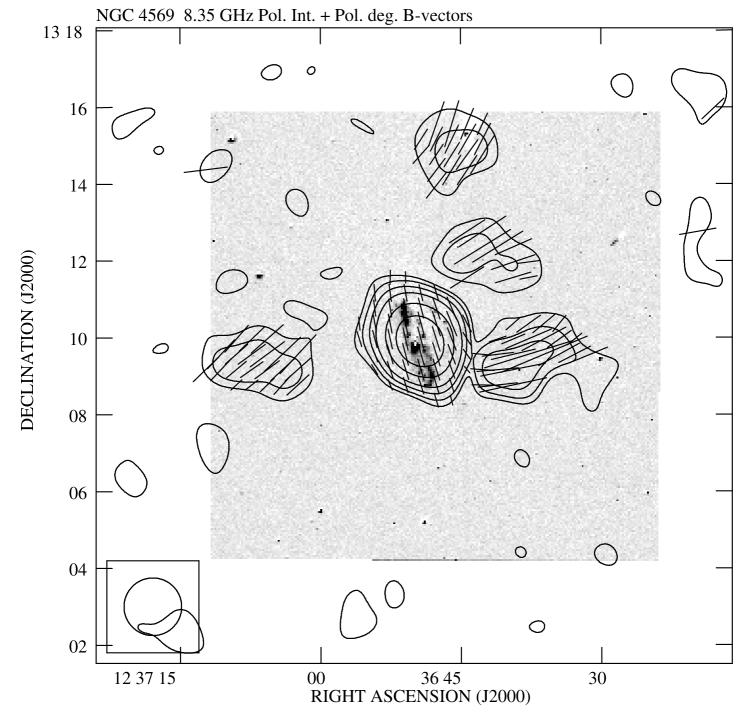
Our observations at 8.35 GHz show that the polarized emission on the western and NW disk side is concentrated in three separated features (Fig. 4): the most northern polarized peak is associated with IC 3583 and the ridge of polarized emission seen at 4.85 GHz west of the disk appears to be composed of two regions at the distance of about 3′ from the centre of NGC 4569. The fact that they apparently coincide with regions showing little total power emission is due to a five times higher noise level in total power channels (due to confusion with background sources and an unpolarized atmospheric noise). We can thus detect significant polarization even where the total power signal is weak and very noisy. Both polarization peaks west of the disk show B-vectors perpendicular to the disk plane.
The map at 1.4 GHz made from the line-free channels of the Hi observations by Vollmer et al. (vollm2 (2004)) has the highest angular resolution of our data, but contains no polarization channels. The eastern lobe seems again to be a detached structure, a thin radio bridge connecting it to the disk of NGC 4569 is also confirmed (Fig. 5). The western extension has a more complex structure and seems to be connected to the disk. In its southern part a relatively narrow ridge of total power emission extends away from the disk. It coincides roughly with the southern polarized extension seen west of the disk at 8.35 GHz (Fig. 4). Bright radio emission from IC 3583, which might be connected to that of NGC 4569 via another putative faint radio bridge, is also visible in Fig. 1 and 3. The possible interactions between the galaxies has already been discussed by Tschöke et al. (tschoke (2001)) mentioning the faint southern H spur, seen in the HNII image of IC 3583, pointing towards NGC 4569. This is confirmed by a new Fabry Perot H image and velocity field obtained for these galaxies (Chemin et al. chemin (2005)).
4 Discussion
4.1 Spectral index map
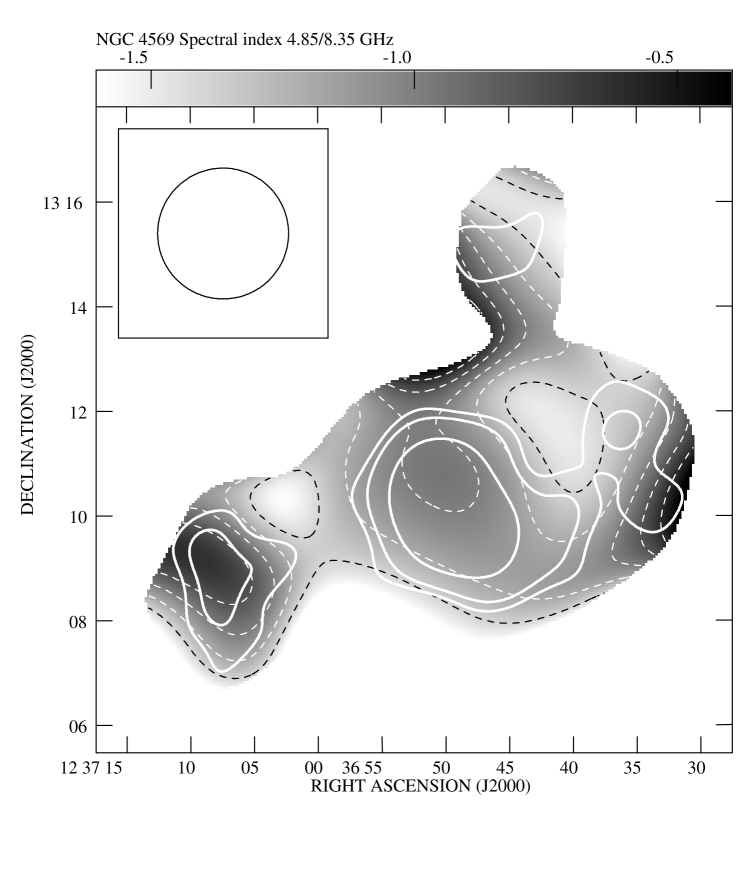
Our results clearly indicate the presence of an unexpected bipolar outflow from the inner disk of NGC 4569. To determine the history of relativistic electrons in the extended lobes we computed the distribution of the spectral index () between 8.35 GHz and 4.85 GHz over the whole source structure (Fig. 6). The total power maps at both frequencies were convolved to a common beamwidth of 25. The disk has a rather steep spectrum with a slope of about . The diffuse western lobe has an even steeper spectrum with a slope steeper than . The steepening of the spectral index is due to the energy loss of the relativistic electrons via synchrotron emission. Since electrons with higher energies lose their energy more rapidly, the spectrum steepens if no re-acceleration of the electrons takes place. Thus the observed steepening of the spectral index in the western lobe is due to the aging of the relativistic electrons. Apparent flattenings at the most extreme western edge and at the northern disk boundary are found in regions of a very weak signal and may be artifacts of local background variations (a deviation of 1.5 r.m.s value in the 8.35 GHz map may explain the observed flattening). Acceleration of the cosmic rays in the southern part of the western lobe, with slightly flatter spectral index, cannot be excluded, but high resolution radio data would be needed to clarify this.
On the other hand, the region of flat spectrum () in the eastern lobe is certainly real. The slope of about is only slightly steeper than the injection spectrum of relativistic electrons in a strong non-magnetic shock in a non-relativistic gas with compression ratio of 4 (Beck & Krause beck05 (2005)). Since no tracers of ionized gas are found in the existing H data in this region, an increased thermal fraction is unlikely, thus in-situ electron acceleration in a large-scale shock must take place.
At 8.35 GHz only 70% of the total flux density comes from the disk, the remaining 30% being emitted by the extended structures. Similar fractions are found at 1.49 GHz. Thus, a substantial amount of magnetic and cosmic ray energy is expelled from the galaxy to the intergalactic space. Such vertical nuclear outflows are known to exist in some disk galaxies with strong nuclear starbursts or AGN activity, like M82 (Reuter et al. reuter (1994)), the Circinus Galaxy (Elmouttie et al. circinus (1998)) or NGC 4258 (Krause et al. krause (1996)). All these mentioned objects have extremely powerful central sources, dominating their radio emission. In NGC 4569 the data at 1.49 GHz processed with the highest possible resolution (beamwidth of 37″ 20″= 3 kpc 1.6 kpc) show that the unresolved central source comprises no more than 15 mJy, thus only some 10% of the total flux density. High resolution 6 cm and 20 cm data revealed a flux density of 1.5 mJy at 6 cm and 10 mJy at 20 cm in the inner pc (Neff & Hutchings neff (1992), Hummel et al. hummel (1987)). According to Gabel & Bruhweiler (gabel (2002)) half of the flux density at 6 cm is due to thermal electrons. They suggest that the rest of the flux density is due to 100-200 supernova remnants.
The eastern lobe has some characteristics of a hot spot at the terminal point of the jet expelled from a possible AGN in the centre of NGC 4569: is this evidence for a local cosmic ray acceleration and a possible connection (jet) to the disk. The available data exclude the existence of a present-day AGN in the center of NGC 4569 (see e.g. Barth & Shields barth00 (2000) or Gabel & Bruhweiler 2002). Instead, NGC 4569 harbors a low-ionization nuclear emission-line region (LINER). Thus its nucleus shows a very low activity. Furthermore, the western lobe does not resemble the classical AGN-expelled structure. It is a diffuse feature attached to the disk with vertical magnetic fields emerging from almost the whole inner disk. The possibility of an earlier AGN activity is discussed in the next section.
4.2 A galactic wind in a ram pressure wind
In this section we discuss various possible origins of the observed radio-bubbles in NGC 4569. We start with geometrical aspects of the radio emission and an AGN scenario. We then analyse time scales for galactic outflows and galactic superwinds. For galactic superwinds we estimate energy needed to blow-up radio lobes and confront it with star formation in the disk and with two episodes of nuclear starburst. Finally we discuss the influence of cluster environments on the development of a ridge of radio continuum emission in the southern part of the western lobe.
4.2.1 The radio geometry
A very surprising aspect of the radio lobes is their relative symmetry. NGC 4569 is moving rapidly within the hot intracluster medium. According to Vollmer et al. (vollm2 (2004)) the galaxy has passed the cluster core Myr ago and the current ram pressure is about g cm-1s-2. Moreover, the galaxy is moving to the north-east. If the observed radio lobes were due to an AGN, one would expect the formation of a head-tail radio galaxy, because AGN jets are very vulnerable against forces perpendicular to the outflow direction, which is the case for a ram pressure wind. In contrast, in a galactic outflow/superwind a pressure driven bubble is created which expands in all directions and is thus much more stable against forces parallel to the galactic disk. We therefore suggest that the radio lobes are not due to an AGN (even now extinct), but due to a starburst-induced galactic outflow/superwind.
4.2.2 Galactic outflows
We cannot yet determine reliably if the material in the flow leaves the potential of NGC 4569 (which is the defining property of a galactic wind) or if some or most of the material returns to the disk of NGC 4569 (which is typical for a galactic outflow). The radial velocity of the H emitting gas cone at a radius of 4 kpc is measured to be about 100 km s-1 (Bomans et al. bomans05 (2005)). The derived time needed to blow-up our radio lobe ( kpc in size) is then about Myr, which is too long a life-time for the synchrotron electrons which do not show gradual spectral steepening. On the other hand it is possible that the magnetic field and cosmic rays are connected to a much hotter phase of the gas forming a superwind-like flow at considerably higher velocity.
4.2.3 Superwinds
Typical outflow velocities of galactic superwinds are km s-1 (Heckman et al. heckman (2003)). So Myr are needed to develop the observed spatial extent of the radio lobes. In order to balance ram pressure, the inner pressure of the lobes has to be greater or equal to the external ram pressure . Assuming the minimum energy condition we computed the total pressure of cosmic rays and magnetic fields in the lobes. A mean value inside regions delineated by the level of 1.2 mJy/b.a. at 4.85 GHz is dyn cm-2. It rises to dyn cm-2 when brighter parts of lobes inside the level of 4 mJy/b.a. are considered. Similar values are obtained when pressure balance conditions are assumed. These values are comparable in range to the ram pressure (see Sect. 4.2.1). The joint magnetic and cosmic-ray energy density is also of order of 1.5 – erg cm-3, again similar to the kinetic energy density of the wind. The outflows have thus a good chance to overcome the ambient gas pressure while the intergalactic wind can still deform the extended lobes (Sect. 4.2.5).
To estimate the total energy requirements we assume a cone-like geometry for the outflow with a height of 25 kpc and a diameter of 15 kpc, the total volume occupied by the outflow is thus cm3. The minimum energy needed to overcome the external ram pressure within this region then is erg. With a typical supernova II total kinetic energy input erg we find that the total number of supernovae driving the outflow is . The mass ejected by the wind-type flow is , where is the mean gas density within the lobes. Assuming a mean outflow velocity of km s-1 the mean density is g cm-3 and the ejected mass is M M⊙. The fraction between the gravitational and the kinetic energy density is , where we assumed a symmetric dark matter halo and a constant rotation velocity of km s-1. Thus, a sufficiently strong superwind-type flow can easily overcome the gravitational potential of the galaxy and resist ram pressure.
4.2.4 Disk star formation and the central starbursts
Is the star formation activity of NGC 4569 strong enough to explain such powerful wind-type flows? The disk of NGC 4569 is weakly forming stars. Due to the small star formation rate the arm-interarm contrast in the disk is low and the galaxy is classified as anemic by van den Bergh (vdB (1976)). Thus the star forming H disk (e.g. Koopmann et al. koopmann (2001)) of NGC 4569, truncated by the recent ram pressure stripping event, cannot provide the necessary energy input to drive the observed radio lobes.
We are thus left with central starbursts. IUE ultraviolet and optical ground-based spectra of the nucleus of NGC 4254 of various dispersions were studied by Keel (keel (1996)). Narrow Balmer absorption lines and the overall shape of optical spectrum indicates that the optical light is dominated by a young starburst particularly rich in A-type supergiants. UV light is more peculiar and could not be modelled by the UV light from a dominant population of A supergiants. It was interpreted as an AGN or an additional unusually compact and extraordinary luminous central-star cluster. This last possibility was confirmed in the detailed study of HST/FOC UV data by Gabel & Bruhweiler (gabel (2002)). Their spectral synthesis and photoionization analyses imply that this central starburst is very recent ( Myr old) and consist of about O and B stars packed in a region of pc in size. They also pointed out that the population of A supergiants discerned by Keel (keel (1996)) must be older ( Myr) and by a factor of 10 more extended than the UV-bright core. This may mean that its content of OB stars (hence supernova progenitors) could be in the past considerably greater than .
The central present day starburst is clearly too young ( Myr) to be responsible for huge observed radio lobes (timescale of Myr). Also the number of OB stars generated by the recent starburst is less than the minimum number of supernovae II () needed to drive the observed radio structures. In contrast to that the timescale of the second, older starburst ( Myr), seen now as an abundant population of A-type supergiants matches the timescale of the observed outflow. This makes this old starburst (possessing at the past time also enough OB stars) better candidate to drive the observed radio lobes. However, a further detailed modelling of A supergiant-dominated population is needed to explain together with the OB dominated compact starburst the both UV and optical spectra and to constrain the starburst geometry, age and energetics, and to model the radio lobes formation. A detailed stellar population synthesis modeling of a past starburst which would match the present-day A-star content and produce enough OB stars at the time of its youth is required to state whether such an event is sufficient to energize the observed lobes.
4.2.5 Radio ridge and ram pressure stripping
The horizontal ridge of radio continuum emission visible at 1.49 GHz in the southern part of the western lobe of NGC 4569 (Fig. 5) coincides with a spot of polarized emission (Fig. 4) parallel to this structure. The western side of the galactic disk is the side closest to the Virgo Cluster centre. In the ram pressure scenario of Vollmer et al. (vollm2 (2004)) NGC 4569 is moving within the Virgo intracluster medium to the north-east. Consequently, the ISM of NGC 4569 is pushed by ram pressure to the south-west (last frame of Fig. 6 of Vollmer et al. vollm2 (2004)). Thus, ram pressure is not directly responsible for the horizontal ridge of radio continuum emission.
We suspect the horizontal ridge of radio continuum emission to be outflowing gas of the galactic superwind colliding with the part of the stripped ISM of NGC 4569 which is still close to the galaxy. If this gas is atomic its surface density must be smaller than cm-2, because it was not detected in the VLA data of Vollmer et al. (vollm2 (2004)). On the other hand, if this putative south-western Hi plume is more extended than 20-30 kpc, its Hi mass cannot exceed several M⊙, because it would have been detected with the Effelsberg 100-m telescope. The collision of outflowing and stripped gas leads to compression of the outflowing gas and the magnetic field contained in it, giving rise to the observed horizontal ridge of enhanced total power and polarized radio continuum emission. In addition, we expect that a shock is formed when the wind is hitting the relatively dense stripped ISM of NGC 4569. The observed flattening of the spectral index in the south-western part of the western radio lobe might then be due to in-situ particle acceleration in this large-scale shock.
The flat spectral index of the eastern lobe and the implied in-situ acceleration of relativistic electrons there might be due to a large-scale shock driven by the direct impact of ram pressure on this lobe, whereas the western lobe is protected from a direct impact of ram pressure by the stripped ISM of NGC 4569. This shielding might also be partly responsible for the different aspects of the two radio lobes. High resolution radio continuum observations are needed to confirm and resolve the distribution of the spectral index in the radio lobes. If our scenario is correct we would expect a flatter spectral index in the direction of the ram pressure wind, i.e. to the north-east in the eastern lobe.
Of course, our scenario has caveats: (i) why is the stripped and partly re-accreting gas seen in Fig. 6 of Vollmer et al. (vollm2 (2004)) located more to the west of the galaxy center than to the south-west? (ii) Can such gas, if it exists, efficiently shield/protect the galactic wind-like flows? Of what type is the stellar population, its age and extent responsible for radio lobes? More sensitive multi-frequency radio polarization and optical observations of NGC 4569 with high spatial resolution would greatly help to establish a detailed scenario of these peculiar gas outflows.
5 Conclusions
Using the Effelsberg radio telescope working at 4.85 GHz and 8.35 GHz we discovered large scale outflows in the strongly stripped Virgo spiral galaxy NGC 4569. We found that:
-
-
NGC 4569 possesses large radio lobes extending up to 24 kpc from the disk, which is unusual for normal spirals and even more unusual for cluster spirals.
-
-
The lobes emit as much as 30% of the total flux density at 8.35 GHz.
-
-
The eastern lobe shows signatures of in-situ shock-driven cosmic ray acceleration.
-
-
The western lobe looks like a diffuse halo with vertical magnetic fields spread over the whole disk.
-
-
Using the continuum channels at 1.4 GHz from the Hi observations we suggest that its southern part shows effects of gas and magnetic field compression by the ambient intracluster medium.
The radio structure of NGC 4569 differs in many respects from that of normal spiral galaxies: the radio lobes with scales of tens of kiloparsecs are very rare phenomena in field spiral galaxies and have not yet been observed in a cluster spiral galaxy. The extraplanar western ridge of unpolarized and polarized radio continuum emission is also a peculiar feature, which is most probably due to the cluster environment.
The available data exclude present-day and past AGN activity in the core of NGC 4569. We exclude that the observed radio lobes are due to an extinct AGN, because NGC 4569 undergoes relatively strong ram pressure effects (Vollmer et al. vollm2 (2004)) which would lead to a head-tail galaxy. Instead, we propose that the observed radio lobes are due to a galactic superwind-like flows, induced by a starburst lasting several Myr. Such an event, which requires supernovae explosions and erg total input energy, is consistent with a stellar population dominated by a large number of A supergiants in the central region of the galaxy (Keel 1996). This is supported by estimates of the combined magnetic and cosmic-ray pressure inside the lobes from our radio data.
Our observations give the first evidence that galactic superwind-like flows can occur even in a spiral galaxy located near the cluster center (projected distance Mpc.) They can expand to distances of several 10 kpc and might finally escape the galaxy’s gravitational potential and enrich the intracluster medium with gas, dust and magnetic fields. In addition to magnetic fields expelled from galaxies during their interactions (Chyży & Beck chyzy04 (2004)) objects like NGC 4569 may constitute an important source of intergalactic/intracluster magnetic fields, thereby relaxing the seed field problem in the dynamo theories (e.q. Widrow widrow02 (2002)).
Despite this first evidence, we are far from fully understanding the nature of the giant outflows in NGC 4569. High resolution, high sensitivity, multi-frequency radio continuum observations including polarization will greatly help to test our tentative scenario. The polarized radio emission detected from IC 3583 and the existence of a radio bridge connecting IC 3583 and NGC 4569 suggest a possible interaction between the two objects which will have to be addressed, too.
Acknowledgements.
The authors wish to express their thanks to the colleagues from the Max-Planck-Institut für Radioastronomie (MPIfR) in Bonn for their valuable discussions during this work. KCh, MS, and MU are indebted to Professor Richard Wielebinski from the MPIfR for the invitations to stay at this institute, where substantial parts of this work were done. This work was supported by a grant from the Polish Research Committee (KBN), 0249/P03/2001/21. DJB acknowledges the SFB 591 ‘Universal Beheavior of non-equilibrium plasmas’. We have made use of the LEDA and GOLDMine databases.References
- (1) Baars, J. W. M., Genzel, R., Pauliny-Toth, I. I. K., & Witzel, A. 1977, A&A, 61, 99
- (2) Barth, A. J., & Shields, J. C. 2000, PASP, 112, 753
- (3) Beck, R., Ehle, M., Shoutenkov, V., Shukurov, A., & Sokoloff, D. 1999, Nature, 397, 324
- (4) Beck, R., & Krause, M. 2005, Astr. Nachr., in press
- (5) Bomans, D. J., Hensler, G., Tschöke, D., Boselli, A., & Napiwotzki, R. 2005, A&A, submitted
- (6) Cayatte, V., van Gorkom, J. H., Balkowski, C., & Kotanyi, C. 1990, AJ, 100, 604
- (7) Cayatte, V., Kotanyi, C., Balkowski, C., & van Gorkom, J. H. 1994, AJ, 107, 1003
- (8) Chemin L., et al. 2005, A&A, submitted
- (9) Chyży, K.T., & Beck, R. 2004, A&A, 417, 541
- (10) Elmouttie, M., Haynes, R. F., Jones, K. L., Sadle, E. M., & Ehle, M. 1998, MNRAS, 297, 1202
- (11) Emerson, D. T., Klein, U., & Haslam, C. G. T. 1979, A&A, 76, 92
- (12) Emerson, D. T., & Gräve, R. 1988, A&A, 190, 353
- (13) Gabel, J.R., & Bruhweiler, F.C. 2002, AJ, 124, 737
- (14) Gavazzi, G., Bodelli, A., Donati, A., Franzetti, P., & Scodeggio, M, 2003, AJ, 400, 451
- (15) Giovanelli, R., & Haynes, M.P. 1983, AJ, 88, 881
- (16) Haslam, C. G. T. 1974, A&AS, 15, 333
- (17) Heckman, T.M. 2003, RMxAC, 17, 47
- (18) Hummel, E., van der Hulst, J.M., Keel, W.C., & Kennicutt, R.C., Jr. 1987, A&AS, 70, 517
- (19) Keel, W.C. 1996, PASP, 108, 917
- (20) Klein U., Beck R., Buczilowski U.R., & Wielebinski R., 1982, A&A 108, 176
- (21) Koopmann, R.A., Kenney, J.D.P., & Young, J. 2001, ApJS, 135, 125
- (22) Krause, M., & Löhr, A. 2004, A&A, 420, 115
- (23) Morsi, H. W., & Reich, W. 1986, A&A, 163, 313
- (24) Neff, S. G., & Hutchings, J. B 1992, AJ, 103, 1746
- (25) Reuter, H.-P., Klein, U., Lesch, H., Wielebinski, R., & Kronberg, P. P. 1994, A&A, 282, 724
- (26) Soida, M., Beck, R., Urbanik, M., & Braine J. 2002, A&A, 394, 47
- (27) Stauffer, J.R., Kenney, J.D., & Young, J.S. 1986, AJ, 91, 1286
- (28) Tabara, H., & Inoue, M. 1980, A&AS, 39, 379
- (29) Tschöke, D., Bomans, D. J., Hensler, G., & Junkes, N. 2001, A&A 380, 40
- (30) van den Bergh, S. 1976, ApJ, 206, 883
- (31) Vollmer, B., Cayatte, V., Balkowski, C., & Duschl, W. J. 2001, ApJ, 561, 708
- (32) Vollmer, B., Balkowski, C., Cayatte, V., van Driel, W., & Huchtmeier, W. 2004, A&A 419, 35
- (33) Wardle J.F.C., & Kronberg P.P., 1974, ApJ 194, 249
- (34) Widrow, L. 2002, Rev. Mod. Phys., 74, 775