A DLA in a dark gamma-ray burst: the environment of GRB 050401111Based in part on observations made at the European Southern Observatory, Paranal, Chile under program 075.D-0270, with the Nordic Optical Telescope, operated on the island of La Palma jointly by Denmark, Finland, Iceland, Norway, and Sweden, in the Spanish Observatorio del Roque de los Muchachos of the Instituto de Astrofisica de Canarias, with the Wide Field Camera (WFCAM) on the United Kingdom Infrared Telescope, which is operated by the Joint Astronomy Centre on behalf of the U.K. Particle Physics and Astronomy Research Council, and on data collected at the Subaru Telescope, which is operated by the National Astronomical Observatory of Japan.
Abstract
The optical afterglow spectrum of GRB 050401 (at ) shows the presence of a damped Ly absorber (DLA), with . This is the highest column density ever observed in a DLA, and is about five times larger than the strongest DLA detected so far in any QSO spectrum. From the optical spectrum, we also find a very large Zn column density, allowing us to infer an abundance of [Zn/H. These large columns are supported by the early X-ray spectrum from Swift-XRT which shows a column density (in excess of Galactic) of assuming solar abundances (at ). The comparison of this X-ray column density, which is dominated by absorption due to -chain elements, and the H I column density derived from the Ly absorption line, allows us to derive a metallicity for the absorbing matter of [/H. The optical spectrum is also substantially reddened and can be well reproduced with a power-law with SMC extinction, where A. But the total optical extinction can also be constrained in a way which is independent of the shape of the extinction curve: from the optical-to-X-ray spectral energy distribution we find, . However, even this upper limit, independent of the shape of the extinction curve, is still well below the dust column that is inferred from the X-ray column density, i.e. A. This discrepancy might be explained by a small dust content with high metallicity (low dust-to-metals ratio). ‘Grey’ extinction cannot explain the discrepancy since we are comparing the metallicity to a measurement of the total extinction (without reference to the reddening). Little dust with high metallicity may be produced by sublimation of dust grains or may naturally exist in systems younger than a few hundred Myr. From these results it is clear that dust extinction properties in GRBs derived from comparisons of optical reddening and metallicity are unreliable.
1 Introduction
The largest H I column density absorption line systems [H I cm-2], known as damped Ly absorbers (DLAs), were first observed in QSO spectra, and originate in the H I regions of intervening galaxies (see Wolfe, Gawiser, & Prochaska 2005, for a recent review). Because background QSOs probe random sightlines through intervening galaxies, QSO-DLA systems can in principle be used as an unbiased tracer of the neutral gas at high redshift, gas that provides the fuel for star formation at these epochs (Lanzetta, Wolfe, & Turnshek 1995; Wolfe et al. 1995), though complications regarding a bias against dusty lines of sight may possibly exist (Vladilo & Péroux 2005; Akerman et al. 2005).
Typically, metallicities are low in QSO-DLAs compared to solar metallicity, ( at ) with a large scatter (Kulkarni & Fall 2002; Prochaska et al. 2003).
DLAs are also common in long duration -ray burst (GRB) afterglow spectra (Jensen et al. 2001; Hjorth et al. 2003a; Jakobsson et al. 2004b; Vreeswijk et al. 2004), typically with much higher column densities than observed in QSO-DLAs (Vreeswijk et al. 2004). It seems highly plausible, given that long-duration GRBs are known to have massive star progenitors (Stanek et al. 2003; Hjorth et al. 2003b), that the extremely large neutral hydrogen column densities observed in many GRB-DLAs are related to the GRBs’ star-forming regions (e.g. Bloom, Kulkarni, & Djorgovski 2002). This means that while the highest redshift absorption system in an afterglow spectrum belongs to the GRB host, and is therefore unlikely to be useful as a random probe of intervening matter, it can instead provide rich information on the sites of active star-formation in the high-redshift universe (the mean and median redshifts of recent samples of GRBs are now very high, around , and the first GRB at has recently been found; Jakobsson et al. 2006; Kawai et al. 2006; Tagliaferri et al. 2005; Price et al. 2005; Haislip et al. 2006; Watson et al. 2006). At the same time, afterglow spectra can still be used as random probes for intervening absorbers at lower redshifts in the same way as QSOs. The largest Ly absorption columns in DLAs are found in GRB afterglows: GRB 030323 with (Vreeswijk et al. 2004) and more recently in the afterglow of GRB 050730 (Starling et al. 2005; Chen et al. 2005).
Further data on the birth matrix of GRBs are provided by studies of the afterglow’s optical extinction and soft X-ray absorption. The optical studies provide an opportunity to constrain the extinction law for star-forming galaxies at high redshift, though the work may be complicated by the possibility of destruction of dust grains by the GRB. Indeed it has been proposed that GRB afterglows are subject to a ‘flat’ or ‘grey’ extinction law due to a change in the grain size distribution caused by the sublimation and breaking of dust grains (Waxman & Draine 2000; Fruchter, Krolik, & Rhoads 2001; Perna, Lazzati, & Fiore 2003), i.e. where there is evidence for little spectral reddening but where the presence of a significant dust column is inferred. Proposed evidence for this includes large metal column densities observed in afterglows which exhibit little curvature in their optical afterglow spectra. The metal column densities are derived either from optical absorption lines (where dust depletion effects have also been observed, Savaglio, Fall, & Fiore 2003; Savaglio & Fall 2004), or from the soft X-ray absorption (Stratta et al. 2005, 2004), where the most important contribution comes from oxygen K-shell absorption. This apparent discrepancy between the metal column density and the optical reddening was first observed in a careful and seminal paper by Galama & Wijers (2001), using very low quality X-ray spectra from BeppoSAX.
The only alternative to a flat extinction law appears to be a non-universal dust-to-metals ratio. This would explain a high metal column density with little spectral reddening without reference to non-standard extinction laws, since there is simply less dust. A low dust-to-metals ratio appears a very natural possibility for GRB host galaxies, given their high redshifts (Jakobsson et al. 2006) and very young stellar populations (typically less than two hundred Myr, Le Floc’h et al. 2003; Christensen et al. 2004; Gorosabel et al. 2003, 2005). This is because metal enrichment of the interstellar medium depends on supernovae (SNe) which have short lifetimes, while the overwhelming mass of dust (at least in the current epoch) is not produced by SNe, but by asymptotic giant branch (AGB) stars (Andersen, Höfner, & Gautschy-Loidl 2003) that have lifetimes of at least one hundred Myr before even the most massive stars begin to produce quantities of dust (Ferrarotti & Gail 2005).
To distinguish between these possibilities, we require a direct measure of the hydrogen Ly, soft X-ray, and optical metal absorptions in a single GRB afterglow, observations that have been elusive because of the conflicting requirements of a relatively low redshift for an accurate determination of the intrinsic soft X-ray absorption, and high redshift to move hydrogen Ly to observable wavelengths.
In this paper we present X-ray and optical observations of GRB 050401 (§ 2), the resulting spectra and lightcurves (§ 3), and the implications of these observations (§ 4).
A cosmology with , and km s-1 Mpc-1 is assumed throughout. Error ranges quoted are 68% confidence intervals for one parameter of interest, unless otherwise indicated.
| Date (UT) | Telescope | Mag | Time since trigger (ks) |
| R-band | |||
| April 1.9880 | MAO | 22.7(2) | 33.75 |
| April 2.0720 | TNG | 23.0(1) | 41.01 |
| April 2.2100 | VLT | 23.27(9) | 52.93 |
| April 2.2243 | NOT | 23.0(2) | 54.16 |
| April 2.2563 | VLT | 23.31(8) | 56.93 |
| April 2.3004 | VLT | 23.44(8) | 60.74 |
| April 2.3183 | D1.5 | 23.5(2) | 62.29 |
| April 2.3438 | VLT | 23.5(9) | 64.49 |
| April 3.2414 | NOT | 23.9(2) | 142.0 |
| April 8.2116 | NOT | 25.3(4) | 571.5 |
| April 14.5947 | Subaru | 26.0(1) | 1123 |
| J-band | |||
| April 1.6402 | UKIRT | 18.6(2) | 3.698 |
| H-band | |||
| April 1.6346 | UKIRT | 17.9(1) | 3.214 |
| April 1.6457 | UKIRT | 18.1(2) | 4.173 |
| April 1.6513 | UKIRT | 18.0(1) | 4.657 |
| April 2.3521 | CTIO | 20.3(1) | 65.21 |
| K-band | |||
| April 1.6242 | UKIRT | 16.88(8) | 2.316 |
| April 1.6284 | UKIRT | 17.2(1) | 2.678 |
| April 14.2742 | VLT | 1095 |
2 Observations and data reduction
On 1 April 2005 at 14:20:15 UT Swift’s Burst Alert Telescope (BAT) triggered on a multi-peaked burst with a duration of s (Barbier et al. 2005; Sakamoto et al. 2005). A rapid autonomous slew of the satellite resulted in the X-Ray Telescope (XRT) being on source within about two minutes and a bright, fading source was discovered in the BAT error-circle (Angelini et al. 2005). XRT revisited the source again on 6, 7 and 8 April. We acquired the XRT data from the archive and used the level 2 events files to construct the lightcurves and spectra, using a 40 pixel wide source extraction box for the Windowed Timing (WT) mode data with a background region box 4′ away. A 12 pixel radius circle was used to extract the source counts in Photon Counting (PC) mode; an annulus around the source region was used to extract a background in this case. Data in PC mode with a source count rate above 0.4 counts s-1 are likely to be affected by pile-up and were not used, as good statistics on the bright afterglow were available from the WT mode data. HEASOFT 6.0 was used to analyse and reduce the data with the latest calibration files. Ancillary response files were produced with xrtmkarf using ‘inarffile=CALDB’, but the fit to the data at energies close to 0.5 keV was poor. Running xrtmkarf with ‘inarffile=NONE’ produces an ancillary response file without using a modified on-axis ancillary reponse as input, instead using the mirror on-axis effective area and the filter transmission file directly. The ancillary response produced in this way improved the fit at low energies, though the results presented here are not strongly dependent on the choice of response file, in particular a very large excess column density is detected regardless of which ancillary response is used.
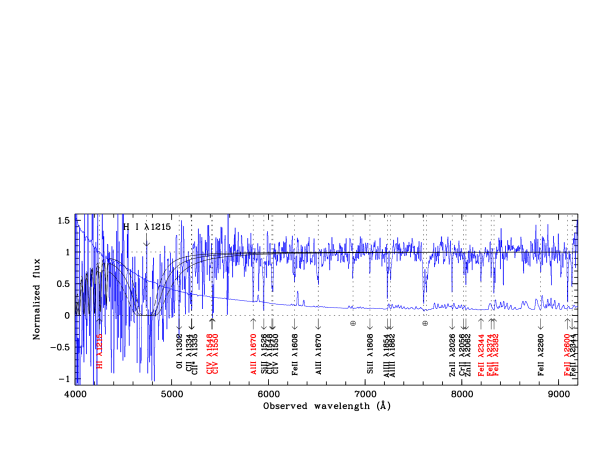
Optical and near-IR observations of the optical afterglow of GRB 050401 (McNaught & Price 2005) were secured at several telescopes (see Table 1). Starting at 5:16 UT on April 2, 2005 (14.9 hours after the burst trigger), 8 spectra of 1450 s each were acquired with the FOcal Reducer/low dispersion Spectrograph 2 (FORS2) instrument on Antu of the Very Large Telescope (VLT) at Cerro Paranal in Chile, using the grism 300V and order sorting filter GG375, and a slit width of 1″. This setting results in a binned pixel scale of 3.24 Å, and a FWHM resolution of 9.5 Å at 4000 Å and 11 Å at 9000 Å. After cosmic ray removal using the van Dokkum (2001) algorithm, the spectra were reduced in the standard fashion, using IRAF. As the night was photometric, the GRB afterglow spectra were flux calibrated using the spectrophotometric standard star G13831. Finally, the spectra were corrected for the Galactic foreground extinction estimate of E(BV) mag of Schlegel, Finkbeiner, & Davis (1998). The resulting normalized spectrum and its 1 error spectrum are shown in Fig. 1.

3 Results
3.1 The X-ray afterglow
The WT-mode spectrum (Fig. 2) was fit with a power-law with fixed Galactic absorption ( cm-2, using the nh ftool, Dickey & Lockman 1990). The fit using this model was poor (), leaving large negative residuals at low energies, and so an extra parameter, additional absorption at (the redshift of the burst—see below), was added to the fit. This improved the fit significantly (), and gave best-fit values of photon spectral index and equivalent hydrogen column density cm-2 (). Using the ancillary response file created with ‘xrtmkarf inarffile=CALDB’, the best-fit values were similar— and cm-2. The absorbing column density is fit using the absorption cross-sections of Morrison & McCammon (1983), which assumes solar abundances. Splitting the WT-mode data in three equal duration bins revealed no significant change in the spectrum (absorbing column or spectral slope). Also the PC-mode data, obtained several hours after the burst, are consistent with the same absorbing column and slope (Fig. 2). An analysis of the first minute and the first five minutes of WT-mode data revealed no variation in the absorbing column density greater than the level. The absolute systematic uncertainty in the flux normalisation of the spectrum is small, of the order of a few percent.

The level of the Galactic foreground absorption may be uncertain up to % (Dickey & Lockman 1990). Including this uncertainty leads to a more conservative error estimate of cm-2 for the equivalent hydrogen column density.
Although the X-ray column density is usually expressed in terms of the equivalent hydrogen column density, this assumes solar abundances; the soft X-ray absorption is in fact a direct measure of the total metal column density in the solid and gas phases. The biggest contribution to the absorption comes from the oxygen K-shell absorption edges, with O I at 0.52 keV. There is also a significant contribution from other -chain elements. For instance, at the oxygen and other -elements are responsible for two-thirds of the absorption in a typical X-ray CCD spectrum (e.g. Swift-XRT) assuming solar abundances. The X-ray column density is therefore effectively a measure of the -element column (see also Morrison & McCammon 1983; Galama & Wijers 2001; Turnshek et al. 2003). It is very often impossible to determine the ionisation state of the X-ray absorber due to 1) Galactic absorption, 2) the fact that at moderate redshifts the oxygen edge is usually shifted out of the bandpass of most X-ray detectors, and 3) the low resolution of CCD X-ray spectra. This, combined with the fact that the difference in the measured absorbing column density is expected to be small between neutral and moderate ionisation states means that column density measures from soft X-rays are given for a neutral column. The fact that we do not know the ionisation state of the X-ray absorber leads, at worst, to a fairly small underestimate of the metal column. In this case there is evidence of a very large, neutral column density from the optical spectrum (see below), which makes it plausible to assume that the fraction of fully ionized gas is negligible.
The 0.2–10.0 keV lightcurve (Fig. 3) is not well fit by a single power-law () but a broken power-law improves the fit significantly () with a break at s, from a decay index to . There is no significant change in the spectrum from one side of the break to the other, although the spectrum on the late side of the break has low number counts and is not as well-constrained as the early spectrum.

3.2 Optical Photometry and Spectroscopy
The optical lightcurve (Fig. 3) is well fit with a single power-law () with optical decay index . This fit is consistent with data from less than a minute (the burst was observed very rapidly by ROTSE-IIIa, Rykoff et al. 2005) to nearly two weeks post-burst. Such a uniform decay is unusual for optical afterglows that typically display one or more breaks in this time interval. Furthermore, this optical decay slope is significantly different from both X-ray decay slopes. The uniformity of the decay, however, and the similarity with the H-band decay () means that we can have confidence in the correction of the optical/NIR data to an epoch common to the X-ray observations. This confidence is important in order to reconstruct the spectral energy distribution (SED) of the afterglow correctly.
A striking feature in the Galactic-extinction-corrected, flux-calibrated optical spectrum is that it is very red compared to typical optical afterglow spectra (Fig. 4). The best-fit spectral index () is (fitting the spectral range 5800–9000Å). This fact, coupled with an optical-to-X-ray spectral index () of 0.2, strongly suggests that the optical spectrum is reddened by dust. SMC, LMC and Galactic extinction laws (Pei 1992) were fit to the optical spectrum assuming an underlying power-law continuum with the normalisation, the underlying power-law and the extinction as free parameters. As with all GRB afterglows studied to date (but see Vreeswijk et al. 2005), the lack of a 2174 Å bump in the spectrum means that of these three, the SMC extinction law provides the best fit (e.g. Vreeswijk et al. 2004; Jakobsson et al. 2003; Savaglio & Fall 2004), yielding an intrinsic power-law spectral index, and . We do not of course constrain the shape of the extinction curve very well, so that this measure is heavily dependent on the SMC curve.
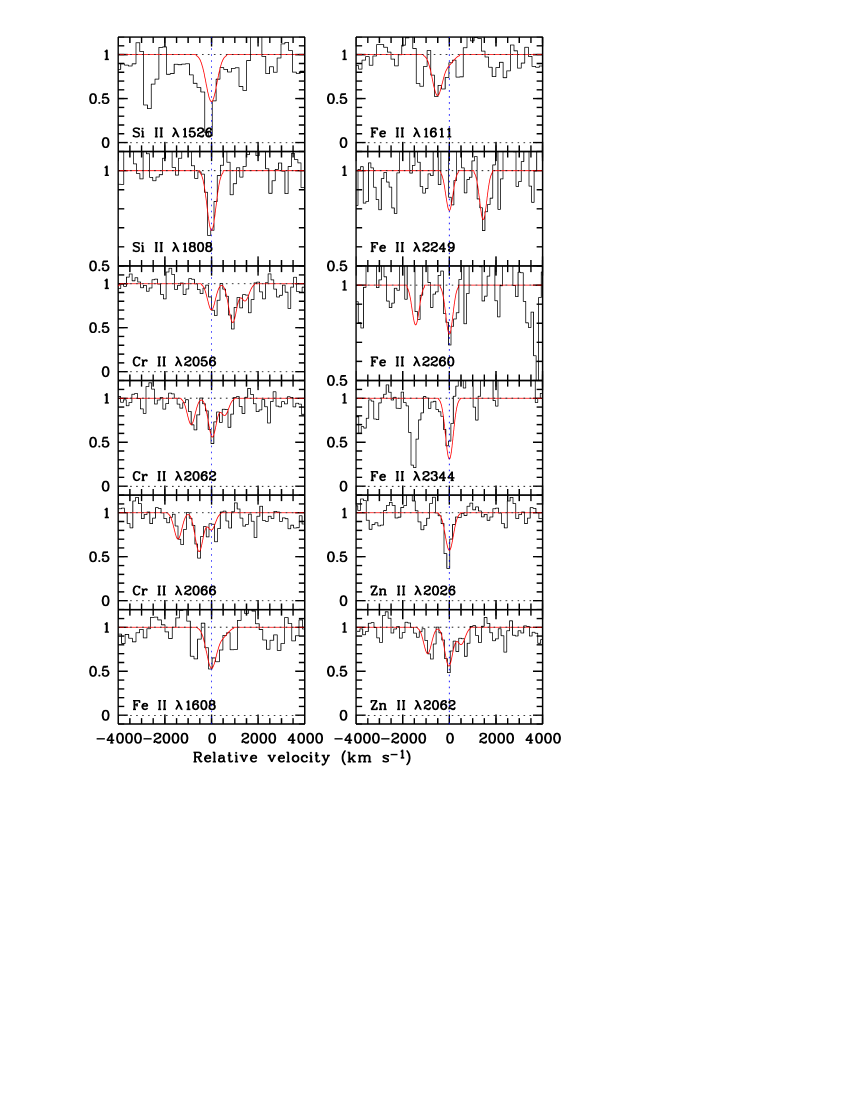
We used this best-fit reddened power law and its extrapolation at wavelengths shorter than 5800 Å to normalise the optical spectrum. A striking feature in the spectrum is the very large absorption edge blueward of about 5400 Å (see Fig. 1, upper panel). Given the detection of two metal absorption line systems in the spectrum with redshifts of and (see Table 2) we interpret the observed very large absorption trough as the signature of a very strong H I Ly absorber at . The correctness of this identification is based on the observation of the red damped wing of the Ly line all the way from 4800 to 5300 Å (see Fig. 1, lower panel). Fitting a damped Ly profile to this damped wing yields a neutral hydrogen column density of H i. We adopt a conservative error of 0.3 dex which takes into account the main source of uncertainty which is related to the continuum placement, not to the RMS error from fitting the Voigt profile. The measurement of the rest-frame equivalent width on the red-half side of the line (removing the contributions of narrow absorption lines), Å, independently confirms the fit result. This makes this system the largest DLA ever observed, larger even than that observed in GRB 050730 (Starling et al. 2005; Chen et al. 2005) and GRB 030323 (Vreeswijk et al. 2004), and a factor of five larger than observed in any QSO-DLA111See [http://www.ucolick.org/ xavier/SDSSDLA/tab_allfit.html]http://www.ucolick.org/~xavier/SDSSDLA/tab_allfit.html . Given the very large H I column density, we checked for the presence of H2 absorption lines at the GRB redshift. In Fig. 1 (lower panel), we display a model of the Lyman-band lines of H2 from the and 1 rotational levels, assuming in both J. This would correspond to a molecular fraction of with H i. However, we cannot claim a detection given the poor quality of the afterglow spectrum bluewards of 4500 Å. Among the observed metal absorption lines, the Zn II doublet at is unambiguously identified. The observed equivalent width of the Zn II 2026 line is Å. Since this line may be saturated, the corresponding Zn metallicity, [Zn/H], derived from the optically thin limit approximation, should be considered as a lower limit. We tentatively performed simultaneous Voigt-profile fitting of the Zn II doublet lines together with carefully selected, weaker and unblended lines from Cr II, Si II and Fe II (see Fig. 5). Assuming a single component and the same (turbulent) broadening parameter value for all ions, we find a best-fit redshift of and broadening parameter km s-1. The best-fit column densities are given in Table 3. Including the Mg I line in the fitting process does not change the Zn II column density, indicating as observed in other GRB afterglows (e.g. Savaglio & Fall 2004) that the contamination of the corresponding Zn II line by Mg I is negligible. With a Zn II column density of cm-2, GRB 050401 also has the highest column density Zn II absorber ever recorded in a DLA system—compare to cm-2 in the previous record holder, GRB 990123 (Savaglio et al. 2003), or cm-2 in QSO 1850+40 (Prochaska & Wolfe 1998), the highest value so far detected in a QSO-DLA. For GRB 050401 we find [Zn/H] (taking into account the 0.3 dex uncertainty on the determination of ). This metallicity is comparable to the few previous measurements for GRBs at similar redshifts, but much higher than those of the strongest (H I) GRB-DLAs observed to date (e.g. Savaglio et al. 2003; Vreeswijk et al. 2004; Prochaska et al. 2004; Starling et al. 2005; Chen et al. 2005). This optically determined metallicity is lower than the metallicity obtained from the X-ray column density. The best-fit equivalent hydrogen column density found from the X-ray data is for a Solar metallicity model, which implies a metallicity lower than Solar ([X/H) when compared to the neutral hydrogen column density, H i, determined above. This is discussed below in § 4.
| Observed | Observed | Probable |
|---|---|---|
| Wavelength (Å) | Equivalent Width (Å) | ID |
| 5074.4 | O I 1302; | |
| 5178.3 | ||
| 5194.7 | ||
| 5206.0 | C II 1334, C II* 1335; | |
| 5318.2 | ||
| 5422.2 | C IV 1548; | |
| 5431.9 | C IV 1550; Si IV 1393; | |
| 5841.5 | Al II 1670; | |
| 5900.0 | ||
| 5950.4 | Si II 1526; | |
| 6036.5 | C IV 1548; | |
| 6044.6 | C IV 1550; | |
| 6273.9 | Fe II 1608; | |
| 6559.9 | ||
| 6507.9 | ||
| 6517.6 | Al II 1670; | |
| 7049.0 | Si II 1808; | |
| 7229.5 | Al III 1854; | |
| 7262.0 | Al III 1862; | |
| 7899.2 | Zn II 2026; | |
| 8022.6 | Cr II 2056; | |
| 8042.2 | Zn II 2062, Cr II 2062; | |
| 8061.6 | Cr II 2066; | |
| 8197.9 | Fe II 2344; | |
| 8303.8 | Fe II 2374; | |
| 8331.5 | Fe II 2382; | |
| 8815.8 | Fe II 2260; | |
| 9023.8 | ||
| 9093.7 | Fe II 2600; | |
| 9137.6 | Fe II 2344; |
| Central (Å) | ID | [X/H] | [X/Zn] | |
|---|---|---|---|---|
| Wavelength | (cm-2) | |||
| 7049.8(6) | 16.5(4) | Si II 1808 | (5) | (5) |
| 7900.3(7) | 14.3(3) | Zn II 2026 | (4) | |
| 8042.7(7) | 14.3(3) | Zn II 2062 | ||
| 6271.7(5) | 16.0(2) | Fe II 1608 | (4) | (4) |
| 6282.4(5) | 16.0(2) | Fe II 1611 | ||
| 8772.7(8) | 16.0(2) | Fe II 2249 | ||
| 8815.2(8) | 16.0(2) | Fe II 2260 | ||
| 8017.8(7) | 14.6(2) | Cr II 2056 | (4) | (4) |
| 8041.1(7) | 14.6(2) | Cr II 2062 | ||
| 8056.4(7) | 14.6(2) | Cr II 2066 |
We note that there is an intervening absorption system at based on Si II, Al II, and Fe II lines. The metal lines in this system are strong but significantly weaker than those from the GRB system. Moreover, the Zn II lines from this system are not detected. It is not possible to estimate the H I column density from the Ly line as there is no flux left from the afterglow around 4255 Å. Assuming a metallicity of a tenth solar we estimate H i. This intervening DLA therefore provides a negligible contribution to the uncertainties on the absorbing column in X-rays or the dust extinction.
In the 2 dimensional spectrum we also identify a Ly emitter at at an impact parameter of 10.2″ south of the GRB position (81.3 kpc at , see the upper panel in Fig. 1). There is no significant absorption in the afterglow spectrum at this redshift. There is also no evidence for Ly emission from the host galaxy in the 2D spectrum, but as the host galaxy is not detected this does not exclude even a large equivalent width Ly emission line from the host.
3.3 The spectral energy distribution
The photon-weighted mean time of the WT-mode X-ray spectrum was 1075 s after the burst. The flux of the optical spectrum was interpolated to this time, using the optical decay slope and the flux calibration of the spectrum. The best-fit to the R-band lightcurve is consistent with the flux interpolation of the optical spectrum to this time (Fig. 4). The NIR data were also corrected to this time, assuming their decay was the same as the R-band decay rate. The correction in the NIR was less than for the optical spectrum since the NIR observations occurred between 37 and 76 minutes after the burst.
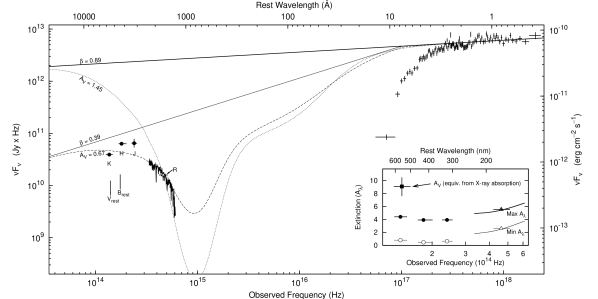
The SED (Fig. 4) clearly shows that a break in the optical-to-X-ray spectral index is required even to fit a simple SMC extinction-correction to the optical spectrum alone. Larger absorption with less reddening would of course allow the optical spectrum to be fit if we assume an intrinsic optical slope that was a continuation of the X-ray slope. Such an extinction would be consistent with the idea of a flat or ‘grey’ extinction as advocated by Galama & Wijers (2001), Savaglio & Fall (2004) and Stratta et al. (2005) among others.
Limits on the total extinction (Aλ) for GRB 050401 were derived from the extreme cases of 1) a single power-law extrapolated from the X-ray spectrum to the optical () and 2) a broken power-law with a (giving ), as expected from the fireball model (Sari, Piran, & Narayan 1998), with the break set conservatively just inside the observed X-ray band (0.4 keV). These limits on Aλ are shown in the inset to Fig 4. It is notable that even a very flat extinction curve cannot alone reconcile the upper limit to the extinction with the large metal column densities we observe. We discuss this conflict below.
4 Discussion
The optical afterglow of GRB 050401 is particularly faint—in fact it is the faintest GRB afterglow for which an absorption line redshift has been obtained. The observed optical to X-ray spectral slope is flatter than expected for the fireball model, therefore GRB 050401 falls into the ‘dark burst’ population as defined by Jakobsson et al. (2004a). The observed reddening in the optical spectrum allow us to conclude that the ‘dark’ nature of the burst can be explained by extinction in the host galaxy. It is interesting that the very high column densities observed in GRB hosts, which are probably local to the GRBs, means that we do not need to invoke very dusty environments to explain dark bursts—even with a small dust-to-gas ratio these very high column densities are sufficient to darken the afterglows.
4.1 Metallicity
Since we expect GRB progenitors to be short-lived (Hjorth et al. 2003b; Stanek et al. 2003), the cloud probed by the afterglow is likely to be the matrix out of which the progenitor was born. For this reason, it may be problematic to try to infer the global properties of the ISM at high-redshift from the GRB’s probable host DLA. But for exactly the same reason GRB-DLAs are particularly important for determining the nature of the progenitor material of the GRB. For instance, the favoured model of long duration GRBs (the ‘collapsar’, Woosley 1993; Woosley & Heger 2006), predicts that GRBs should generally be found in low metallicity environments. Alternative progenitor models exist where there is no such low metallicity preference (e.g. Ouyed et al. 2005; Fryer & Heger 2005).
Previous observations of GRB afterglows and GRB host galaxies have indeed suggested that GRBs reside in low metallicity galaxies (Le Floc’h et al. 2003; Fynbo et al. 2003; Prochaska et al. 2004), and in fact the two next strongest GRB-DLAs after GRB 050401 have rather low metallicities (Vreeswijk et al. 2004; Starling et al. 2005; Chen et al. 2005). The absorbers in GRB afterglows usually have high metal column densities, but relatively little reddening—this phenomenon has been attributed to a flat extinction law, often suggested to be due to destruction of dust grains (Galama & Wijers 2001; Fruchter et al. 2001; Savaglio & Fall 2004; Stratta et al. 2005).
Here we have one of the first direct measures in a single GRB of the H I column density and the total metal (primarily -element) column density. If we assume that the X-ray and optical absorptions probe the same matter, and there is no evidence to the contrary, this allows us to constrain the metallicity from the X-ray measurement, suggesting [X/H], where most of the uncertainty is in the hydrogen column. Using the best-fit to the optical absorption lines we find [Zn/H]. Zn is one of the elements least affected by depletion onto dust grains, at least in warm clouds in the Galaxy (Savage & Sembach 1996), and is also a good tracer of the Fe-group metallicity. By fixing the hydrogen column density at the level of the optically-determined H I column and the Fe-group elements at the level determined from the Zn abundance, we can fit for the -element abundance in the X-ray spectrum. We obtain , which translates to [/H], including the H I uncertainty. We can also directly obtain the ratio of -chain metallicity (from the X-ray spectrum) to Fe-group metallicity (from the optical spectrum). This ratio may hint at a possible overabundance of -elements to Zn compared to solar: [/Zn] (a factor of about 4–5).
In an analysis of QSO absorption lines systems, Turnshek et al. (2003) invoke an overabundance of -chain to Fe-group elements of 2.5. Such an overabundance is consistent with the results obtained here. Indeed, this degree of -element overabundance is consistent with the Zn metallicity (see Turnshek et al. 2003; Matteucci & Chiappini 2005), and would indicate a relatively young ISM still dominated by products from core collapse rather than type Ia supernovae (Matteucci & Chiappini 2005).
From the optical measurements, there is no evidence for an overabundance of Si, which is also considered an -chain element, compared to Zn, with [Si/Zn]. Since Si is depleted onto dust grains as discussed above, this ratio probably reflects differential dust depletion effects. Evidence for dust depletion comes from iron for which we measure [Fe/Zn] similar to the highest seen in QSO-DLAs (Ledoux et al. 2003).
In cold Galactic clouds Zn is depleted by about dex (Savage & Sembach 1996), so it is important to examine if the apparent alpha-element overabundance could be due to a large depletion of Zn onto dust grains. We believe the depletion of Zn is not large in this case, as the abundances of Si, Cr, and Fe relative to Zn in this system ([Si/Zn], [Cr/Zn], [Fe/Zn]) are more similar to the element ratios in warm Galactic clouds ([Si/Zn], [Cr/Zn], [Fe/Zn]) than those in cold Galactic clouds ([Si/Zn], [Cr/Zn], [Fe/Zn]) (see Savage & Sembach 1996, for details). Nevertheless, we cannot exclude some depletion of Zn onto dust and in this case the total metallicity would be higher if metal ratios were similar to the solar values ([X/H]). Strictly, the derived -element overabundance should hence be considered an upper limit.
4.2 Extinction
The optical spectrum is well fit using an SMC extinction curve with A and an intrinsic slope (before dust extinction) of . With a slightly flatter slope of , as expected from the X-ray slope and a cooling break of between the X-rays and the optical, the required extinction is slightly higher, A (see Fig. 4).
This reddening-derived estimate is somewhat less than might be expected from a simple translation of the optical H I or Zn II columns to extinction. These would respectively suggest A assuming an SMC dust-to-hydrogen ratio (Bouchet et al. 1985), or A, following Savaglio & Fall (2004). The similarity of these latter two estimates is not surprising of course since the estimated metallicity in the SMC is similar to the [Zn/H] observed here. However, these estimates are strongly dependent on the metallicity and if some Zn is depleted onto dust, the metallicity-estimated AV could be substantially greater.
A more robust, direct comparison can be made between the optical spectrum and the optical-to-X-ray SED, thereby placing bounds on the total and selective extinctions (see the inset in Fig. 4). A is excluded: it would require a non-power-law continuum in the optical which was also substantially below the continuum expected from the X-ray spectrum, even with a steep spectral break. On the other hand, we can also exclude A since it requires not only an extremely flat extinction curve, but also that the optical and X-ray afterglows are driven by different emission components (e.g. that the X-ray emission is dominated by inverse compton radiation rather than synchrotron radiation).
The absolute limits on the extinction () and the extinction estimates based on metallicity and on reddening-fitting examined above, are all much less than the AV inferred from the metal column derived from the soft X-ray absorption, which is (Predehl & Schmitt 1995). Since the X-ray absorption is dominated by metals, the conversion from X-ray absorption to dust column is not sensitive to a gas-to-metals conversion, but to the dust-to-metals conversion. Allowing an -element overabundance as suggested above would not make these more compatible since it is the -elements that compose most the dust. We are therefore forced to invoke a dust-to-metals ratio (as distinct from the dust-to-gas ratio or the metallicity) which is smaller in this DLA than in the Galaxy or the Magellanic clouds. If the reddening-derived extinction measure is correct, this is more than a factor of ten less than the SMC dust-to-metals ratio. But such a resolution to the low-reddening vs. high metal column problem clashes with the apparent pattern of dust depletion observed above, as depletion at this level naturally implies the presence of a large dust column along with the gas. We are left with a paradox: we very clearly observe a large metal column density and insufficient total extinction (and reddening) implying a low dust-to-metals ratio, but at the same time we have some evidence of dust depletion effects in the ratios of the optical lines. This is puzzling. We cannot exclude the hypothesis that there is a large dust column which has very little effect on the transmission of optical light. On the other hand it seems reasonable to say that the evidence for dust depletion (4–5 in total) may not be quite strong enough to support such a far-reaching conclusion. In that case we invoke a low dust-to-metals ratio as above. Such a low dust content with a moderately high metallicity would indicate either sublimation of most of the dust along the line of sight (e.g. Draine & Hao 2002), or more simply, that the dust observed in this DLA system has been formed by SNe rather than AGB stars. This is because SNe contribute metals and dust very quickly to the ISM, but while they provide nearly all of the metals, they produce only relatively small amounts of dust (SNe produce at most only a few percent of the dust found in the local universe; Ferrarotti & Gail 2005; Nittler 2005).
5 Conclusions
We have reported the strongest damped Ly line observed to date, in the spectrum of GRB 050401. The metallicity is fairly high even for a GRB-DLA, with [Zn/H. Large X-ray absorption is also detected, from which a large -element column density is inferred. The extinction expected based on the X-ray absorbing column density exceeds the total extinction allowed by the SED in GRB 050401, and is more than an order of magnitude greater than the extinction inferred from a good fit of the SMC extinction curve to the reddening in the optical spectrum. A grey or flat extinction law cannot explain this discrepancy. We suggest that since the metallicity is high, and the total extinction is low, it implies that there is comparatively little dust along the line of sight to this GRB (however there is puzzling evidence to the contrary in the depletion patterns of the optical absorption lines). This high metal column with little extinction may be evidence of dust destruction, or that the stellar population is very young and that little dust has been formed yet, in spite of the vigorous star-formation activity. Based on these results, inferences on dust extinction properties drawn from comparisons of optical reddening and metallicity should be approached cautiously.
References
- Akerman et al. (2005) Akerman, C. J., Ellison, S. L., Pettini, M., & Steidel, C. C. 2005, A&A, 440, 499
- Andersen et al. (2003) Andersen, A. C., Höfner, S., & Gautschy-Loidl, R. 2003, A&A, 400, 981
- Angelini et al. (2005) Angelini, L., et al. 2005, GCN Circ., 3161
- Barbier et al. (2005) Barbier, L., et al. 2005, GCN Circ., 3162
- Bloom et al. (2002) Bloom, J. S., Kulkarni, S. R., & Djorgovski, S. G. 2002, AJ, 123, 1111
- Bouchet et al. (1985) Bouchet, P., Lequeux, J., Maurice, E., Prevot, L., & Prevot-Burnichon, M. L. 1985, A&A, 149, 330
- Chen et al. (2005) Chen, H.-W., Prochaska, J. X., Bloom, J. S., & Thompson, I. B. 2005, ApJ, 634, L25
- Christensen et al. (2004) Christensen, L., Hjorth, J., & Gorosabel, J. 2004, A&A, 425, 913
- De Pasquale et al. (2006) De Pasquale, M., et al. 2006, MNRAS, 365, 1031
- Dickey & Lockman (1990) Dickey, J. M. & Lockman, F. J. 1990, ARA&A, 28, 215
- Draine & Hao (2002) Draine, B. T. & Hao, L. 2002, ApJ, 569, 780
- Ferrarotti & Gail (2005) Ferrarotti, A. S. & Gail, H.-P. 2005, A&A in press
- Fruchter et al. (2001) Fruchter, A., Krolik, J. H., & Rhoads, J. E. 2001, ApJ, 563, 597
- Fryer & Heger (2005) Fryer, C. L. & Heger, A. 2005, ApJ, 623, 302
- Fynbo et al. (2003) Fynbo, J. P. U., et al. 2003, A&A, 406, L63
- Galama & Wijers (2001) Galama, T. J. & Wijers, R. A. M. J. 2001, ApJ, 549, L209
- Gorosabel et al. (2003) Gorosabel, J., et al. 2003, A&A, 400, 127
- Gorosabel et al. (2005) Gorosabel, J., et al. 2005, A&A, 444, 711
- Haislip et al. (2006) Haislip, J. B., et al. 2006, Nat, 440, 181
- Hjorth et al. (2003a) Hjorth, J., et al. 2003a, ApJ, 597, 699
- Hjorth et al. (2003b) Hjorth, J., et al. 2003b, Nat, 423, 847
- Jakobsson et al. (2003) Jakobsson, P., et al. 2003, A&A, 408, 941
- Jakobsson et al. (2004a) Jakobsson, P., Hjorth, J., Fynbo, J. P. U., Watson, D., Pedersen, K., Björnsson, G., & Gorosabel, J. 2004a, ApJ, 617, L21
- Jakobsson et al. (2004b) Jakobsson, P., et al. 2004b, A&A, 427, 785
- Jakobsson et al. (2006) Jakobsson, P., et al. 2006, A&A, 447, 897
- Jensen et al. (2001) Jensen, B. L., et al. 2001, A&A, 370, 909
- Kawai et al. (2006) Kawai, N., et al. 2006, Nat, 440, 184
- Kulkarni & Fall (2002) Kulkarni, V. P. & Fall, S. M. 2002, ApJ, 580, 732
- Lanzetta et al. (1995) Lanzetta, K. M., Wolfe, A. M., & Turnshek, D. A. 1995, ApJ, 440, 435
- Le Floc’h et al. (2003) Le Floc’h, E., et al. 2003, A&A, 400, 499
- Ledoux et al. (2003) Ledoux, C., Petitjean, P., & Srianand, R. 2003, MNRAS, 346, 209
- Matteucci & Chiappini (2005) Matteucci, F. & Chiappini, C. 2005, PASP, 22, 49
- McNaught & Price (2005) McNaught, R. & Price, P. A. 2005, GCN Circ., 3163
- Morrison & McCammon (1983) Morrison, R. & McCammon, D. 1983, ApJ, 270, 119
- Nittler (2005) Nittler, L. R. 2005, in ASP Conf. Ser. 341: Chondrites and the Protoplanetary Disk, 539
- Ouyed et al. (2005) Ouyed, R., Rapp, R., & Vogt, C. 2005, ApJ, 632, 1001
- Pei (1992) Pei, Y. C. 1992, ApJ, 395, 130
- Perna et al. (2003) Perna, R., Lazzati, D., & Fiore, F. 2003, ApJ, 585, 775
- Predehl & Schmitt (1995) Predehl, P. & Schmitt, J. H. M. M. 1995, A&A, 293, 889
- Price et al. (2005) Price, P. A., Cowie, L. L., Minezaki, T., Schmidt, B. P., Songaila, A., & Yoshii, Y. 2005, ApJ in press, astro-ph/0509697
- Prochaska et al. (2004) Prochaska, J. X., et al. 2004, ApJ, 611, 200
- Prochaska et al. (2003) Prochaska, J. X., Gawiser, E., Wolfe, A. M., Castro, S., & Djorgovski, S. G. 2003, ApJ, 595, L9
- Prochaska & Wolfe (1998) Prochaska, J. X. & Wolfe, A. M. 1998, ApJ, 507, 113
- Rykoff et al. (2005) Rykoff, E. S., et al. 2005, ApJ, 631, L121
- Sakamoto et al. (2005) Sakamoto, T., et al. 2005, GCN Circ., 3173
- Sari et al. (1998) Sari, R., Piran, T., & Narayan, R. 1998, ApJ, 497, L17
- Savage & Sembach (1996) Savage, B. D. & Sembach, K. R. 1996, ARA&A, 34, 279
- Savaglio & Fall (2004) Savaglio, S. & Fall, S. M. 2004, ApJ, 614, 293
- Savaglio et al. (2003) Savaglio, S., Fall, S. M., & Fiore, F. 2003, ApJ, 585, 638
- Schlegel et al. (1998) Schlegel, D. J., Finkbeiner, D. P., & Davis, M. 1998, ApJ, 500, 525
- Stanek et al. (2003) Stanek, K. Z., et al. 2003, ApJ, 591, L17
- Starling et al. (2005) Starling, R. L. C., et al. 2005, A&A, 442, L21
- Stratta et al. (2004) Stratta, G., Fiore, F., Antonelli, L. A., Piro, L., & De Pasquale, M. 2004, ApJ, 608, 846
- Stratta et al. (2005) Stratta, G., Perna, R., Lazzati, D., Fiore, F., Antonelli, L. A., & Conciatore, M. L. 2005, A&A, 441, 83
- Tagliaferri et al. (2005) Tagliaferri, G., et al. 2005, A&A, 443, L1
- Turnshek et al. (2003) Turnshek, D. A., Rao, S. M., Ptak, A. F., Griffiths, R. E., & Monier, E. M. 2003, ApJ, 590, 730
- van Dokkum (2001) van Dokkum, P. G. 2001, PASP, 113, 1420
- Vladilo & Péroux (2005) Vladilo, G. & Péroux, C. 2005, A&A, 444, 461
- Vreeswijk et al. (2004) Vreeswijk, P. M., et al. 2004, A&A, 419, 927
- Watson et al. (2006) Watson, D., et al. 2006, ApJ, 637, L69
- Waxman & Draine (2000) Waxman, E. & Draine, B. T. 2000, ApJ, 537, 796
- Wolfe et al. (2005) Wolfe, A. M., Gawiser, E., & Prochaska, J. X. 2005, ARA&A, 43, 861
- Wolfe et al. (1995) Wolfe, A. M., Lanzetta, K. M., Foltz, C. B., & Chaffee, F. H. 1995, ApJ, 454, 698
- Woosley (1993) Woosley, S. E. 1993, ApJ, 405, 273
- Woosley & Heger (2006) Woosley, S. E. & Heger, A. 2006, ApJ, 637, 914