The broad-band spectrum of Cyg X-2 with INTEGRAL
We study the broad band (3-100 keV) spectrum of Cygnus X–2 with INTEGRAL. We find that the spectrum is well fitted by a Comptonized component with a seed-photons temperature of keV, an electron temperature of keV and an optical depth . Assuming spherical geometry, the radius of the seed-photons emitting region is km. The source shows no hard X-ray emission; it was detected only at a level above 40 keV. We also analyzed public ISGRI data of Cyg X–2 to investigate the presence of a hard X–ray component. We report the possible presence of hard X-ray emission in one data set.
Key Words.:
accretion, accretion disks – binaries: close – stars: individual: Cygnus X–2 – stars: neutron1 Introduction
Cyg X–2 is one of the six Galactic Low Mass X-ray Binaries (hereafter LMXBs) that are classified as Z-sources. This classification relies upon a combination of the track (that resembles a Z) traced on an X-ray color-color diagram (CCD) and of the correlated timing properties of these sources (Hasinger & van der Klis 1989).
Several studies have been carried out on Cyg X-2: type-I X-ray bursts have been observed in its X-ray lightcurve (Smale 1998), confirming that the primary in the system is a neutron star (NS); its distance has been estimated to be kpc from optical observations (Orosz & Kuulkers 1999), consistent with previous determinations from radio observations (Hjellming et al. 1990) but not with measurements obtained from X-ray bursts (11.6 kpc, Smale 1998). The binary system has an orbital period of 9.8444 d, as can be deduced from the optical behavior of the companion, V1341 Cyg (Casares et al. 1998). The masses of the two stars are and for the primary and the companion, respectively (Orosz & Kuulkers 1999).
The X-ray spectrum of the source has been studied several times over the years. It has been fitted both with the so-called Western model – a blackbody plus a Comptonized component (Hasinger et al. 1990; Smale et al. 1993), and with the so-called Eastern model – a multi-temperature blackbody together with a Comptonized blackbody (Hasinger et al. 1990; Hoshi & Mitsuda 1991; Hirano et al. 1995). More recently, the broad band spectrum of Cyg X–2 has been studied with BeppoSAX (Frontera et al. 1999; Di Salvo et al. 2002; Piraino et al. 2002).
Di Salvo et al. (2002) fitted the broad band spectrum of Cyg X-2 obtained with BeppoSAX using a two component continuum model, consisting of a disk blackbody and a Comptonized component. A broad emission line at keV and an emission line at keV (most probably coming from highly ionized iron) proved necessary for a good fit. In two of the intervals selected on the CCD, the continuum spectrum of Cyg X–2 could not be fit by the usual two-component model, and a third component was needed to fit the high energy part of the spectra. This hard X-ray emission fits a power-law with photon index .
A similar “hard X-ray tail” has been found in other observations, but with an index (Piraino et al. 2002).
A hard X-ray emission has been detected in other Z-sources : GX 5–1 (Asai et al. 1994), GX 17+2 (Di Salvo et al. 2000), GX 349+2 (Di Salvo et al. 2001), Sco X–1 (D’Amico et al. 2001a), and in the non-flaring state of the anomalous Z-source Cir X–1 (Iaria et al. 2001). The physical mechanism producing this high-energy emission is yet to be understood.Some evidence of the correlation of the hard tail with the position of the source in the X-ray CCD has been found for GX 5–1, GX 17+2 and Cyg X–2. Such a correlation may not be present in observations of Sco X–1 (D’Amico et al. 2001a) and of GX 349+2 (see Iaria et al. 2004). D’Amico (2001b) proposed that the presence of a high-energy non-thermal emission could be linked to the 20–50 keV luminosity of the Comptonized component of the spectrum: they made the hypothesis that there is a threshold luminosity () of the Comptonized component above which the non-thermal hard X-ray emission is produced.
In analyzing the first INTEGRAL pointings to Cyg X–2, Natalucci et al. (2003) found the source in the ISGRI images in the 20-40 keV energy band, while it was not detected above 40 keV. We report here on the broad band (3–100 keV) spectral analysis of an INTEGRAL AO1 observation of Cyg X–2 and of all the publicly available ISGRI observations of the source.
2 Observations
The AO1 observation was performed between May 2 and May 3, 2003 (52761.32-52762.43 MJD), during satellite revolution 67. The high-energy coded mask imager IBIS/ISGRI (Ubertini et al. 2003; Lebrun et al. 2003) was used to observe Cyg X-2 for a total exposure time of 66.8 ks. Cyg X-2 was in the JEM-X (Lund et al. 2003) field of view during four science windows, for a total exposure of 7.2 ks. Data were extracted for all pointings with a source position offset in ISGRI and in JEM-X.
Publicly available data from the satellite pointings towards the Cygnus region during the Performance Verification Phase (PVP) have been previously analyzed (Natalucci et al. 2003). Along with these data, 10 more observations have been carried out with the high-energy coded mask imager and have become publicly available. The publicly available observations used in this paper are listed in Table 1.
| Obs. | Start | End | Exposure (s) | Rev | P.L. | ASM |
|---|---|---|---|---|---|---|
| norm. | rate | |||||
| 1 | 1085.63 | 1087.82 | 20737 | 023 | ||
| 2 | 1092.68 | 1093.51 | 9169.59 | 025 | ||
| 3 | 1109.35 | 1109.39 | 2209 | 031 | ||
| 4 | 1178.89 | 1178.92 | 3308.26 | 054 | ||
| 5 | 1202.11 | 1202.17 | 4992.27 | 062 | ||
| 6 | 1226.06 | 1226.12 | 4917.2 | 070 | ||
| 7 | 1238.05 | 1238.1 | 4889.13 | 074 | ||
| 8 | 1257.39 | 1258.34 | 17113.3 | 080 | ||
| 9 | 1261.95 | 1262 | 4913.84 | 082 | ||
| 10 | 1291.96 | 1292.96 | 5021.14 | 092 | ||
| 11 | 1441.42 | 1441.45 | 3308.99 | 142 | ||
| 12 | 1450.43 | 1450.48 | 4923.44 | 145 | ||
| AO1 | 1217.37 | 1218.42 | 66795.96 | 067 |
Data reduction for both instruments was performed using the standard Offline Science Analysis (OSA) version 4.2 distributed by the INTEGRAL Science Data Center (Courvoisier et al. 2003). The algorithms used in the analysis are described in Goldwurm et al. (2003). For the spectral analysis we used data corresponding to the 3–20 keV energy range for JEM-X and to the 20–100 keV energy range for ISGRI.
3 Results
3.1 The AO1 observation
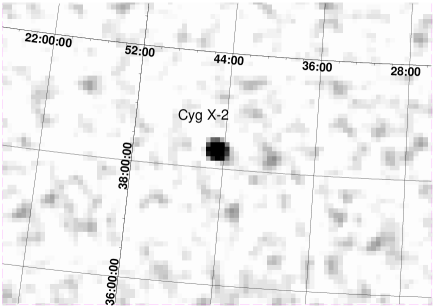
Fig. 1 shows the ISGRI map of the Cyg X-2 region in the 20–40 keV energy range during the AO1 observation. Single pointings were deconvolved and analyzed separately, and then combined in mosaic images. The source is clearly detected at a significance level of . In the energy range 40–80 keV, the source can be detected only with a significance of . At higher energies Cyg X-2 was not detected at a statistically significant level neither in single exposures nor in the total exposure time. Cyg X-2 was observed in ISGRI images at and . The source position is consistent, within the source location error at 90% confidence of (see Gros et al. 2003), with the catalog position (Liu et al. 2001).
We base our spectral investigations mainly on preceding BeppoSAX spectral results (Di Salvo et al. 2002). We find that the broad-band (3–100 keV) spectrum of the AO1 observation is well fitted by an absorbed Comptonization spectrum. Due to the lack of low-energy data we fixed the value of the photoelectric absorption to the value reported by Di Salvo et al. (2002). We will adopt their spectral model in fitting the data. Using the compTT (Titarchuk 1994) model in xspec 11.3.1 we were able to fit the data with a reduced chi squared of 1.09 for 144 degrees of freedom (d.o.f.). The non-detection of a low energy thermal component in the continuum spectrum is not surprising, since it was used to model mainly the low energy (0.1–3 keV) BeppoSAX spectra. The addition of a power-law component at high energies, or of a Gaussian emission line at keV that were found in BeppoSAX observations are not statistically required. Fixing the energy and the width of the emission line to the best values obtained by Di Salvo et al. (2002), we find an upper limit on the intensity of photons cm-2 s-1 (at 90 % confidence), well compatible with the intensity found in the BeppoSAX observations, which varied between 3 and photons cm-2 s-1. We were able to determine an upper limit on the flux of a power-law component (using the pegpwrl model inside xspec) by fixing the photon index to the value reported by Di Salvo et al. (2002), 2.09. We find an upper limit (at 90 % confidence) on power law flux between 30 and 100 keV of erg cm-2 s-1. During the BeppoSAX observation analyzed by Di Salvo et al. (2002) in which the hard X-ray emission was detected, the flux in the same energy band was erg cm-2 s-1111All errors on the fluxes are at 90% confidence.. Since the flux in the 3–30 keV energy band in the present observation, erg cm-2 s-1, is comparable with the flux in the BeppoSAX data in the same band, erg cm-2 s-1, we conclude that the spectrum of the INTEGRAL data is softer than during the BeppoSAX observations and that no significant hard X-ray emission is present. We added a normalization factor between Jem-X and ISGRI spectra; keeping the ISGRI normalization fixed to 1 we found a Jem-X normalization of 0.986. Detailed results for the best-fit model are reported in table 2. The reduced (d.o.f.) of the best fit model is 1.03(142). The folded and unfolded spectra together with the best-fit model and the respective residuals are shown in figure 2.

| CompTT | CompTT + | |
| power-law | ||
| NH ( cm-2) | 0.2 (frozen) | 0.2 (frozen) |
| kTW (keV) | ||
| kTe (keV) | ||
| RW | ||
| Pho. Index | - | 2.09 (frozen) |
| Npo | - | |
| EFe(keV) | - | 6.65 (frozen) |
| (keV) | - | 0.2 (frozen) |
| IFe | - | |
| Flux | 1.05 | 1.13 |
| (d.o.f.) | 1.09(144) | 1.03(142) |
3.2 Looking for hard X-ray emission in other INTEGRAL observations of Cyg X-2
Since no JEM-X data are available during other public ISGRI observations, it is not possible to determine the parameters of the compTT component at these times. To test the presence of a hard tail, we fitted the ISGRI data with the model we fitted to the AO1 observation, keeping the seed photons temperature and the optical depth of the Comptonizing cloud frozen to their best-fit values; the only free parameters in the fit are therefore the normalizations of the two components and the electron temperature of the compTT component. In observations 3, 4 and 11 (see table 1) we had to fix the electron temperature as well.
We consider that a hard tail is present in the spectrum when the power-law flux in the 30-100 keV energy range is different from 0 at 90% confidence. Using this criterion, we find one data set in which the hard tail is detected (see table 1). In the other 11 data sets, no hard tail is detectable, although in most cases the upper limits are consistent with the flux found by BeppoSAX . The detection (or the lack of it) is reported in table 1. Our results partially confirm that a hard tail appears from time to time in Cyg X–2 spectra, as reported by other authors (Di Salvo et al. 2002, Piraino et al. 2002). It was proposed that the presence of the hard power-law emission is strongest in the horizontal branch of the X-ray CCD (Di Salvo et al. 2002). Unfortunately we have no possibility to obtain information about the position of the source along its Z track, neither in the public data nor during the AO1 observation (JEM-X data covered only a small fraction of the ISGRI observation). In the analysis of the first INTEGRAL observations of Cyg X–2, Natalucci et al. (2003) suggested that there could be a correlation between the variability of the high-energy spectrum and the long term variability in the soft X-ray lightcurve of Cyg X–2. We analyzed the Cyg X–2 lightcurves obtained with the RXTE All Sky Monitor (ASM) simultaneously with the INTEGRAL observations, seeking for some sort of correlation between the long term soft X–ray variability and the detection of a hard tail. We do not find evidence of a correlation between the presence of the hard tail and the count rate in the ASM (see table 1).
We tried to obtain a crude estimate of the 20-50 keV luminosity of the Comptonized component from our fitting model in order to verify the hypothesis by D’Amico et al (2001b). In most observations, the error on the inferred luminosity is of one order of magnitude. In the AO1 observation however the power-law was not detected and the 20-50 keV luminosity of the Comptonized component is , but in observation 3, where we detect the hard tail, the luminosity of the Comptonized component is erg s-1. This does not agree with the hypothesis of D’Amico et al. (2001b).
4 Conclusions
We analyzed the INTEGRAL AO1 observation of Cyg X-2. The source was clearly detected in the 20-40 keV (see Figure 1), but only at a 3 level in the 40-80 keV energy band. The broad band spectrum is well fitted by a Comptonization model alone. No hard tail was significantly detected in the data We also analyzed 12 publicly available observations carried out with ISGRI, and confirmed the detection of a hard tail at 90% confidence in one case. This is the first direct detection of a hard tail in high-energy imaging data of a Z-source. A longer, continuous observation of Cyg X–2 with both JEM-X and ISGRI would allow to investigate further the nature of the hard X-ray emission and its relationship with other spectral features of the source.
Acknowledgements.
We acknowledge financial contribution from contract ASI-INTEGRAL I/R/046/04References
- Asai et al. (1994) Asai K., Dotani T., Mitsuda K., Nagase F., Kamado Y., Kuulkers E. & Breedon L. M., 1994, PASJ, 46, 479
- (2) Casares, J., Charles, P. A. & Kuulkers, E., 1998, ApJ, 493, L39
- Courvoisier et al. (2003) Courvoisier, T. J.-L., Walter, R., Beckmann, V., et al. 2003, A&A, 411, L57
- D’Amico et al. (2001a) D’Amico, F., Heindl, W. A., Rothschild, R. E., Gruber, D. E., 2001a, ApJ, 547, L147
- D’Amico et al. (2001b) D’Amico F., 2001b, AIP Conf. Proc. 587, Gamma 2001, ed. S. Ritz, N. Gehrels, & C. R. Shrader (Melville, NY: AIP), 44
- (6) Di Salvo, T., Stella, L., Robba, N. R., et al. 2000, ApJ, 544, L119
- (7) di Salvo, T., Robba, N.R., Iaria, R., Stella, L., Burderi, L., & Israel, G.L., 2001, ApJ, 554, 49
- (8) Di Salvo, T., Farinelli, R., Burderi, L., Frontera, F., Kuulkers, E., Masetti, N., Robba, N. R., Stella, L. & van der Klis, M., 2002, A&A, 386, 535
- (9) Frontera, F., dal Fiume, D., Malaguti, G., Nicastro, L., Orlandini, M., Palazzi, E., Pian, E., Favata, F., Santangelo, A., 1999, Nucl. Phys. B Proc. Suppl., 69, 286
- Goldwurm et al. (2003) Goldwurm, A., David, P., Foschini, L., et al. 2003, A&A, 411, L223
- Gros et al. (2003) Gros, A., Goldwurm, A., Cadolle-Bel M., et al. 2003, A&A, 411, L179
- Hasinger & van der Klis (1989) Hasinger G., & van der Klis M., 1989, A&A, 225, 79
- Hasinger et al. (1989) Hasinger G., van der Klis M., Ebisawa K., Dotani T., Mitsuda K., 1990, A&A, 235, 131
- Hirano et al. (1995) Hirano, A., Kitamoto, S., Yamada, T.T., Mineshige, S.,& Fukue, J., 1995, ApJ, 446, 350
- Hjellming et al. (1990) Hjellming R. M., Han X. H., Cordova F.A.,& Hasinger G., 1990, A&A, 235, 147
- Hoshi & Mitsuda (1991) Hoshi R., & Mitsuda K., 1991, PASJ, 43,485
- (17) Iaria, R., Di Salvo, T., Burderi, L., Robba, N. R., 2001, ApJ, 561,321
- (18) Iaria, R., Di Salvo, T., Robba, N. R., Burderi, L., Stella, L., Frontera, F., van der Klis, M., 2004, ApJ, 600, 358
- Lebrun et al. (2003) Lebrun F., Leray J.-P., Lavocate, Ph., et al. 2003, A&A, 411, L141
- Liu et al. (2001) Liu Q.Z., van Paradijs J., & van den Heuvel E.P.J., 2001, A&A, 368, 1021
- Lund et al. (2003) Lund, N., Budtz-Joergensen, C., Westgaard, N. J., et al. 2003, A&A, 411, L231
- Natalucci et al. (2003) Natalucci, L., Del Santo, M., Ubertini, P., Capitanio, F., Cocchi, M., Piraino, S., and Santangelo, A., 2003, A&A, 411, L395
- Orosz & Kuulkers (1999) Orosz, J.A., & Kuulkers, E., 1999, MNRAS, 305, 132
- Piraino et al. (2002) Piraino, S., Santangelo, A. & Kaaret, P., 2002, ApJ, 567, 1011
- Smale et al. (1993) Smale, A. P., Done, C., et al., 1993, ApJ, 410, 796
- Smale (1998) Smale, A. P., 1998, ApJ, 498, L141
- Titarchuk (1994) Titarchuk, L., 1994, ApJ, 434, 570
- Ubertini et al. (2003) Ubertini, P., Lebrun, F., Di Cocco, G., et al. 2003, A&A, 411, L131