Detection of a period decrease in NN Ser with ULTRACAM: evidence for strong magnetic braking or an unseen companion?
Abstract
We present results of high time resolution photometry of the eclipsing pre-cataclysmic variable NN Ser. NN Ser is a white dwarf/M dwarf binary with a very low-mass secondary star (). We observed 13 primary eclipses of NN Ser using the high-speed CCD camera ULTRACAM and derived times of mid-eclipse, from fitting of light curve models, with uncertainties as low as 0.06 s. The data show that the period of the binary is decreasing, with an average rate of , which has increased to a rate of over the last 2 years. These rates of period change appear difficult to reconcile with any models of orbital period change. If the observed period change reflects an angular momentum loss, the average loss rate ( ergs) is consistent with the loss rates (via magnetic stellar wind braking) used in standard models of close binary evolution, which were derived from observations of much more massive cool stars. Observations of low-mass stars such as NN Ser’s secondary predict rates of 100 times lower than we observe. The alternatives are either magnetic activity-driven changes in the quadrupole moment of the secondary star (Applegate, 1992) or a light travel time effect caused by the presence of a third body in a long ( decades) orbit around the binary. We show that Applegate’s mechanism fails by an order of magnitude on energetic grounds, but that the presence of a third body with mass and orbital period 30 285 years could account for the observed changes in the timings of NN Ser’s mid-eclipses. We conclude that we have either observed a genuine angular momentum loss for NN Ser, in which case our observations pose serious difficulties for the theory of close binary evolution, or we have detected a previously unseen low-mass companion to the binary.
keywords:
binaries: eclipsing – stars: individual: NN Ser – stars: evolution – stars: fundamental parameters – planetary systems1 Introduction
The evolution of close binary systems is governed by angular momentum (AM) loss, driven by a combination of gravitational radiation (Kraft et al. 1962; Faulkner 1971), which is dominant for periods 3 h, and magnetic braking (Verbunt & Zwaan, 1981), which dominates for 3 h. Gravitational radiation is relatively well understood, with the angular momentum loss rates simply governed by the masses and separation of the components of the binary system. Magnetic braking, however, is a more complicated issue. The mechanism is driven by the magnetic field and stellar wind of one of the binary components. As mass is driven off in the stellar wind, the ionised particles are forced to co-rotate with the field lines out to the Alfvén radius. This draws angular momentum away from the star, effectively exerting a braking force to slow its spin. In close binaries, the donor star is tidally locked to the primary, so the angular momentum loss cannot act to slow the spin period of the secondary alone. Instead, the angular momentum is drawn from the binary orbit, causing it to shrink and the orbital period of the binary to decrease. The rate of angular momentum loss by magnetic braking is governed by the mass, radius and angular momentum of the magnetically active star, but there is also evidence to suggest that the AM loss rate saturates for low-mass stars above a certain value of angular momentum (Sills et al., 2000). This has led to a major revision in magnetic braking loss rates for binaries with low-mass secondaries, such as cataclysmic variables.
Cataclysmic variable stars (CVs) are mass-transferring binary systems comprising a white dwarf primary and a low-mass main-sequence secondary. The majority have orbital periods between 1.3 and 10 hours, and their evolution is governed, as with all close binaries, by angular momentum loss from the system (see Warner 1995 for a comprehensive review). CVs are useful for testing close binary evolution, as any theory is constrained by 2 major features in the distribution of CV periods: the period gap and the value of the period minimum. The period gap is a dearth of systems with periods between 2 and 3 hours. Standard CV theory explains this gap by assuming that magnetic braking is cut off at P 3 h as the secondary becomes fully convective (there is no longer a radiative/convective boundary to anchor the magnetic field, so it either dissipates or is rearranged, resulting in a lowered stellar wind). Mass transfer ceases until the system evolves to a period of 2 h and gravitational radiation becomes strong enough to drive mass transfer, re-populating the period distribution below the gap.
The value of the minimum period is governed entirely by the angular momentum loss rate for short-period systems. Under the standard theory, systems below the period gap are driven by gravitational radiation alone, which implies that the minimum period should be at h. In fact the observed cut-off is at about h, suggesting that gravitational radiation alone is not strong enough to reproduce the observed value of .
The standard model was developed by extrapolation from studies of braking rates of solar-type stars in clusters (Rappaport et al., 1983; Spruit & Ritter, 1983). However, a recent dramatic increase in the amount of data available for stars in these clusters (see Stauffer et al., 1997; Krishnamurthi et al., 1997; Reid & Mahoney, 2000, for reviews) has shown that this extrapolation to lower masses appears to be totally wrong - low-mass stars retain more of their angular momentum than their higher-mass counterparts. This means that the new suggested is anything between and times smaller than assumed in the majority of CV studies. Importantly, there is also no evidence for a cut-off in magnetic braking as the secondary becomes fully convective (Andronov et al., 2003), so the new data offer no explanation for the existence of the period gap.
We therefore need a way to directly measure the angular momentum loss rates of CVs in order to test the standard vs. reduced magnetic braking models. One way of doing this is to measure mid-eclipse timings of eclipsing binary systems to find the period change of the system and calculate the angular momentum loss. The period changes are tiny - of order 5 seconds per year - so this is difficult to do in CVs due to contamination of the light curve by the accretion processes. In order to overcome this problem, we have used a non mass-transferring pre-CV, NN Ser. NN Ser is ideally suited for this study as, in addition to the uncontaminated light curve, the system also displays deep primary eclipses that give rise to very sharp ingress and egress features. Given the high-time resolution of ULTRACAM, we are able to estimate the times of mid-eclipse to an accuracy of s.
NN Ser is a white dwarf / M dwarf binary system with an extremely low-mass (M ), and therefore fully convective secondary star. The system was first studied in detail by Haefner (1989), who identified it as a deeply eclipsing ( mag) pre-cataclysmic variable with a strong reflection effect of mag, and an orbital period of 0.13 days. Wood & Marsh (1991) used low-resolution spectra to derive the system parameters, which were refined by the radial velocity study of Catalan et al. (1994) to give the values in Table 1. The most recent study by Haefner et al. (2004) combines high-speed photometry from the Multi-Channel Multi-Colour Photometer (MCCP) with VLT trailed photometry and phase-resolved spectroscopy. This allows them to put good constraints on the temperature of the secondary star. They also attempt to derive accurate values for the radii and masses of the system components, but they failed to detect the secondary eclipse for NN Ser, which caused them to derive a binary inclination of . We have detected the secondary eclipse in our ULTRACAM data (see Fig. 1), and our preliminary modelling indicates that the true inclination is . Full results of our modelling will be the subject of a future paper, but we conclude from our initial results that Haefner et al. (2004) have overestimated the radius (and therefore the mass) of the secondary star by . Nevertheless, we carry out all of our analysis for all values of mass and radius included in the uncertainties given by Catalan et al. (1994) and Haefner et al. (2004). All four studies also give eclipse timings (listed in Table 3) which we have used to extend our baseline for measuring the period change to 15 years.
| Catalán et al. 1994 | Haefner et al. 2004 | |
|---|---|---|
| Wood & Marsh, 1991 | ||
| Binary sep. | 0.95 0.025 R⊙ | 0.9543 0.0233R⊙ |
| Inclination | 84.6 1.1∘ | |
| Mass ratio | 0.18 0.23 | 0.2778 0.0297 |
| WD mass | 0.57 0.04 | 0.54 0.05 |
| RD mass | 0.1 0.14 | 0.150 0.008 |
| WD radius | 0.017 | 0.0189 0.0010 |
| RD radius | 0.15 0.18 | 0.174 0.009 |
| WD temp. | 55000K 8000K | 57000K 3000K |
| RD temp. | 2900K 150K | 2950K 70K |
| RD irr. temp. | 5650K 8150K | 7125K 200K |
| RD spec. type | M4.7 - M6.1 | M4.75 0.25 |
| Distance | 356 pc 472 pc | 500 35 pc |
2 Data acquisition
The data were taken with the ultra-fast, triple-beam CCD camera, ULTRACAM (see Dhillon & Marsh (2001) for a review). We used the camera in conjunction with the 4.2 m William Herschel telescope at the ING to observe NN Ser simultaneously in the Sloan u’, g’ and either r’, i’ or z’ bands. We set a time resolution of 2.06 s to ensure a high signal-to-noise ratio in all wavebands. The observations were taken over a period of 2 years, in May 2002 – 2004, and during those runs we observed 13 primary eclipses of the system. We were also able to observe a number of secondary eclipses as the white dwarf transited the secondary star (see Fig. 1). The pixel size for the 3 ULTRACAM CCDs is 13 m, with a scale of 0.3”/pix. Readout noise is 3.10 – 3.40 e, depending on the CCD, while the gain is 1.13 – 1.20 e/ADU.Each ULTRACAM frame is time-stamped to a relative accuracy of better than 50 s and an absolute accuracy of better than 1 millisecond using a dedicated GPS system. A full list of observations and observing conditions is given in Table 2. The weather in May 2004 was particularly variable, leading to larger errors in our measured times for that epoch.
| Date | Filters | No. | Conditions |
|---|---|---|---|
| eclipses | |||
| 17/05/2002 | u’g’r’ | 2 | good, seeing 1.2” |
| 18/05/2002 | u’g’r’ | 1 | variable, seeing 1.2” - 2.4” |
| 19/05/2002 | u’g’r’ | 1 | fair, seeing 2” |
| 20/05/2002 | u’g’r’ | 1 | fair, seeing 2” |
| 19/05/2003 | u’g’z’ | 1 | variable, seeing 1.5” - 3” |
| 21/05/2003 | u’g’i’ | 1 | excellent, seeing 1” |
| 22/05/2003 | u’g’i’ | 1 | excellent, seeing 1” |
| 24/05/2003 | u’g’i’ | 1 | good, seeing 1.2” |
| 03/05/2004 | u’g’i’ | 3 | variable, seeing 1.2” - 3.2” |
| 04/05/2004 | u’g’i’ | 1 | variable, seeing 1.2” - 3” |
The data were reduced using the ULTRACAM pipeline software written by TRM. Differential photometry was performed on the target, with respect to a nearby, bright, non-variable comparison star.

| Cycle | u’ eclipse | uncertainty | g’ eclipse | uncertainty | r’/i’/z’ eclipse | uncertainty | red |
|---|---|---|---|---|---|---|---|
| Number | time | 1 | time | 1 | time | 1 | filter |
| 38960 | 52411.9470588 | 0.0000020 | 52411.9470564 | 0.0000005 | 52411.9470577 | 0.0000010 | r’ |
| 38961 | 52411.0771385 | 0.0000016 | 52412.0771385 | 0.0000005 | 52412.0771383 | 0.0000010 | r’ |
| 38968 | 52412.9876761 | 0.0000030 | 52412.9876977 | 0.0000008 | 52412.9876721 | 0.0000013 | r’ |
| 38976 | 52414.0283427 | 0.0000030 | 52414.0283394 | 0.0000006 | 52414.0283379 | 0.0000016 | r’ |
| 38984 | 52415.0689716 | 0.0000025 | 52415.0689810 | 0.0000007 | 52415.0689795 | 0.0000016 | r’ |
| 41782 | 52779.0331646 | 0.0000021 | 52779.0331696 | 0.0000010 | 52779.0331362 | 0.0000100 | z’ |
| 41798 | 52781.1144524 | 0.0000015 | 52781.1144513 | 0.0000006 | 52781.1144567 | 0.0000014 | i’ |
| 41806 | 52782.1550904 | 0.0000021 | 52782.1550929 | 0.0000006 | 52782.1550948 | 0.0000011 | i’ |
| 41820 | 52783.9762155 | 0.0000022 | 52783.9762151 | 0.0000007 | 52783.9762110 | 0.0000020 | i’ |
| 44472 | 53128.9486787 | 0.0000070 | 53128.9486778 | 0.0000040 | 53128.9486611 | 0.0000800 | i’ |
| 44473 | 53129.0787555 | 0.0000027 | 53129.0787597 | 0.0000022 | 53129.0787487 | 0.0000050 | i’ |
| 44474 | no data | n/a | 53129.2088356 | 0.0000020 | 53129.2088355 | 0.0000027 | i’ |
| 44480 | 53129.9893197 | 0.0000050 | 53129.9893229 | 0.0000025 | 53129.9893148 | 0.0000040 | i’ |
3 Analysis & Results
All MJD times were corrected to Barycentric Dynamical Time (TDB), then additionally corrected for light travel time to the solar system barycentre. All times are therefore listed in MJD(BTDB). In order to measure accurate eclipse times, we needed a model of the eclipse of the white dwarf, which we calculated as follows. We defined the two stars by their radii relative to the separation of the binary. Since we allowed for tidal deformation of the M dwarf (but not the white dwarf), the radius of the M dwarf was measured from its centre of mass towards the white dwarf. Apart from the relative radii, we also require the binary mass ratio and inclination, stellar effective temperatures and linear limb darkening coefficients to define our model binary. The two stars were divided into many small elements. The temperatures of the elements covering the M dwarf were set, accounting for incident flux from the white dwarf by adding fluxes so that
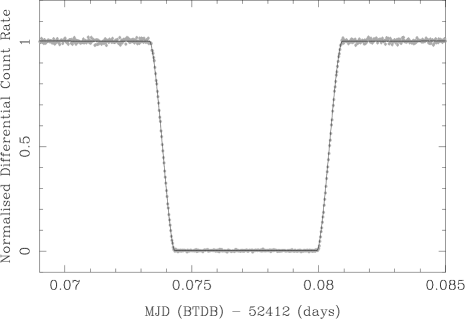
where is the Stefan-Boltzmann constant and is the flux incident on the secondary accounting for the projection effects and the distance from the white dwarf. The surface brightness of each element was then set assuming black-body spectra, and given the effective wavelength of the filter in question. Once the surface brightnesses were set, the model light-curves were computed by summing over all elements, testing for which were in view and not eclipsed and accounting for their projected areas. The eclipse by the M dwarf was computed, allowing once again for tidal distortion. Our assumption of black-body spectra for the two stars is physically unrealistic, but for the eclipse times of this paper, the key element is to have a model that can match the shape of the primary eclipse, which ours does well (Fig. 2). The timings and associated errors for the mid-eclipses in all of the wavebands are given in Table 3. The errors on our mid-eclipse timings are typically 0.15 s but as low as 0.06 s when conditions are good.
| Time of mid-eclipse | Cycle | Reference |
|---|---|---|
| MJD(BTDB) | Number | |
| 47344.025(5) | 0 | 1 |
| 47703.045744(2) | 2760 | 4 |
| 47703.175833(6) | 2761 | 4 |
| 47704.216460(3) | 2769 | 4 |
| 47705.127023(3) | 2776 | 4 |
| 47705.257115(7) | 2777 | 4 |
| 47712.28158(15) | 2831 | 2 |
| 47713.32223(15) | 2839 | 2 |
| 48301.41420(15) | 7360 | 2 |
| 51006.0405(2) | 28152 | 4 |
| 51340.2159(2) | 30721 | 4 |
| 51666.9779(4) | 33233 | 3 |
The times of mid-eclipse in the g’ band were plotted against cycle number. We found that all 13 of the ULTRACAM points except for one (cycle 38968) fell on a straight line, and that the one discrepant point showed a time shift of 2.06 s - exactly the same timing as one exposure. We noted from the logs that we had GPS problems during this exposure run, therefore concluded that the GPS timestamp had slipped by one exposure for that point, and corrected it by 2.06 s to bring it in line with the other points. Old eclipse timings from the literature (Haefner 1989; Wood & Marsh 1991; Pigulski & Michalska 2002; Haefner et al. 2004; Table 4) were then added to the plot. The residuals after subtracting a straight-line fit can be seen in Fig.3. We derive a best-fit linear ephemeris from all the available data for NN Ser as
where the quoted uncertainties are the 1 sigma uncertainties in the fit. We derive a best-fit quadratic ephemeris as:
The data, with eclipse times tE, were fit with a parabola of form:
| (1) |
The rate of period decrease can then then be found using
| (2) |
We found that the rate of period change over the 15 years of observations is increasing, so we fit all of the data to find an average rate of period change, and just the ULTRACAM data to find the current rate.
The angular momentum of the system as a whole is given by
| (3) |
where , and M are the primary, secondary and total masses respectively. Combining this with Kepler’s third law,
| (4) |
we find that, for a detached system (where , and M are constant),
| (5) |
For NN Ser, our measured value for the average rate of period change is
and for the current rate of period change
Taking and (Catalan et al., 1994), these correspond to angular momentum loss rates of
and
where the relatively large allowed range is caused by the uncertainties in the system parameters, where we have assumed that the system parameters are independent of each other. Obviously this will overestimate the size of the uncertainty in our measured angular momentum loss rate for any one value of secondary mass. When carrying out the analysis of period loss mechanisms in Section 4, we have used a more realistic approach, relating the secondary radius to its mass, using the M-R relation for secondaries in binary stars given in Gorda & Svechnikov (1998) and calculating the resultant separation of the binary. This then gives a range of values for the angular momentum change that are specific to each value of secondary mass.

4 Discussion - Mechanisms for period change
Period changes in binary systems are generally due to one of three mechanisms:
-
1.
Applegate’s (1992) mechanism, where period changes are caused by coupling between the binary period and changes in the shape of the secondary star;
-
2.
the presence of a third body in a long orbit around the binary. This affects the light travel-time, which can be mis-interpreted as a change in the binary period. For example, as the binary moves towards the observer, the eclipses are seen to occur more frequently than when the binary is moving away.
-
3.
a genuine angular momentum loss from the system;
We show below that the most common cause of measurable change in binary periods - Applegate’s mechanism - cannot work for NN Ser: the luminosity of the secondary star is too low to provide the necessary energy. We also discuss the other two mechanisms in detail, along with the ramifications for binary evolution.
4.1 Applegate’s mechanism
Applegate (1992) proposed that orbital period modulations observed in many binary stars could be induced by the gravitational coupling of the binary orbit to variations in the shape of the magnetically active secondary star. The shape changes are reflected in a change of quadrupole moment which leads to the change in period; no loss of angular momentum from the system is necessary. The shape changes are presumed to be driven by solar-like magnetic cycles. To avoid an excessive energy budget (Marsh & Pringle, 1990), Applegate (1992) proposed that the shape changes were driven by the re-distribution of angular momentum within the secondary star. He showed that the energy required was well within the capabilities of 4 out of 5 stars that he considered, and was not far off the mark for the fifth, RS CVn.
One of the reasons we chose NN Ser was that it has a particularly low mass – and therefore low luminosity – secondary star, which should be incapable of driving large period changes under Applegate (1992)’s model. We now consider this in detail.
The observational fact we have to explain is the total period change, which in NN Ser amounts to s over the 15 years from the MCCP to the ULTRACAM epoch. A period change corresponds to a change in quadrupole moment , where
| (6) |
where and are the mass and radius of the secondary star and is the orbital separation (Applegate & Patterson, 1987). Applegate (1992) calculated the change in quadrupole moment by considering the transfer of angular momentum from the inside of the star into a thin outer shell. This increases the oblateness of the shell and therefore its quadrupole moment, at the expense of some energy. Applegate used for the mass of the shell. This is immediately a problem in the case of NN Ser because the mass of the secondary star is only , and so is not in any sense a “shell”. We therefore generalised Applegate’s work as follows. We split the star into an inner “core”, denoted by subscript 1 and an outer shell denoted by subscript 2. Angular momentum is transferred from the core to the shell leading to changes in their angular frequencies of and such that
| (7) |
where and are the moments of inertia and given by integrals over radius of a series of thin shells of the form
| (8) |
The change in angular frequencies changes the oblateness and therefore quadrupole moments of the core and shell leading to an overall change in quadrupole moment of
| (9) |
where the coefficients are given by integrals over shells of the form
| (10) |
where is the mass inside radius . These equations follow from Eq. 25 of Applegate (1992).
For a given period change, mass and radius Eq. 6 gives the change in quadrupole moment. We then use Eqs 7 and 9 to solve for , and therefore for the angular momentum transferred, . This then leads to the energy change from Applegate (1992)’s Eq. 28:
| (11) |
where is the initial differential rotation.
In order to solve the equations above, one needs first to know the run of density with radius. We calculated this from the Lane-Emden equation for an polytrope as an approximation to the fully convective secondary star.
In Fig. 4 we show the results of these calculations as a function of the shell mass for , and s.

Applegate used a value of , on the basis that one would expect the initial differential rotation to be of a similar order of magnitude as the changes. In order to arrive at a minimum energy, we have assumed that ; had we used instead , the energies would be increased by a factor . Even without this factor, the figure shows that we need at least ergs to drive the observed period change. The luminosity of the secondary star is , which, for NN Ser’s secondary with , gives the energy available over the 15 years of observations as
This range, which is indicated in the lower-right of Fig. 4 fails by a factor of about 10 to match the energy we calculate, although it does just tally with a calculation based upon Applegate’s original calculations (dotted line). A plot of the ratio of our value of minimum energy required to drive Applegate’s mechanism over the energy available in 15 years vs the radius of the secondary star is shown in Fig 5. It can be seen that the ratio of energy required over energy available is well above 1 for all values of secondary star radius (and therefore mass), i.e. for the system parameters derived by Catalan et al. (1994) and Haefner et al. (2004), NN Ser’s secondary star is not capable of generating enough energy to drive Applegate’s mechanism.
Our increased estimate is a result of the differences in our approach compared to Applegate (1992)’s. First we generalise his thin shell approximation by integration over finite ranges of radii. Second, in Eq. 9, there is a positive contribution from the shell, but also a negative contribution from the core which Applegate did not include and which balances the shell to a considerable extent. The dashed line in Fig. 4 shows the effect of ignoring the core’s contribution to the energy in our calculation. This line converges towards Applegate’s (dotted line) at small shell masses. At large shell masses the effect of the variation in density with radius and finite shell thickness, which Applegate did not include, are important and explain the remaining difference. Ignoring the core cuts the energy requirement by about a factor of 4, suggesting that, given the squared dependence of energy on and hence , the core balances about 50% of the quadrupole increase from the shell. Applegate (1992) already recognised that his approximations must break down when the shell becomes a significant fraction of the star’s mass; the counter-balancing effect of the core’s quadrupole moment has not been pointed out before as far as we are aware.
While we have shown that the intrinsic luminosity of NN Ser’s secondary star is too low to drive Applegate (1992)’s mechanism, we note that the secondary star is heavily irradiated by the hot, white dwarf primary, as shown by the much higher temperature on the side facing the white dwarf. In order to estimate how much of an effect this will have on the secondary star, we compared the flux from the primary that is intercepted by the secondary star with the secondary star’s intrinsic luminosity. We find that the intercepted flux from the white dwarf is 13 times the intrinsic luminosity of the secondary, and therefore, if more than 70% of this were to be absorbed by the secondary star, the extra energy provided could be enough to drive Applegate (1992)’s mechanism. However, there are a number of reasons that this should not be the case. Firstly, very little of the energy absorbed at the stellar surface flows inward, since the opacity in this region becomes very high, the stellar surface quickly heats up, and so the heating luminosity is re-radiated (Harpaz & Rappaport, 1991, 1995). Instead, the main effect of the irradiating flux is to block the outflow of the radiation produced in the secondary star’s interior. The star will undergo a small expansion as some of the blocked energy is stored as internal or gravitational energy, but unlike a star undergoing isotropic irradiation, an anisotropically irradiated star diverts the energy flow in the upper layers of the convection zone to the unirradiated parts of its surface, efficiently cooling the secondary star (Vaz & Nordland, 1985; Ritter et al., 2000). In this case the energy flow is decoupled from the mechanical and thermal structure, which can still be considered as spherically symmetrical, hence the structure of the secondary star below the convection zone is virtually unaffected by the irradiating flux. The irradiating flux does not penetrate deeply enough into the atmosphere to affect the deep boundary layers that must be deformed to drive Applegate (1992)’s mechanism. Finally, if the secondary star were absorbing 9 times its intrinsic energy from the primary star, we should see some variability in the light curves over the 3 years of observations with ULTRACAM. We see no evidence for this as the light curves are consistent to within 3.5% over that time.
We conclude that in the case of NN Ser, Applegate (1992)’s quadrupolar distortion mechanism falls short of being able to match the observed period change, although we note that there may yet be ways to affect the quadrupole distortion at less energy cost (Lanza et al., 1998). We now look at alternative mechanisms of producing NN Ser’s period change.

4.2 Third body
Apparent changes in the orbital periods of binary stars have often been attributed to the light-travel time variation caused by third bodies, although further observation usually reveals that this cannot be the case. However with the relatively limited coverage to date, this is at least a possibility for NN Ser which we investigate in this section.
Changes in eclipse timings of binary stars do not necessarily indicate a genuine change in the binary period. A third body in a long orbit around the binary can cause small but significant changes in the light-travel time from the binary system, which manifest themselves as strictly sinusoidal changes in the timings of mid-eclipse. We are able to put constraints on the mass and period of any third body which could cause the observed period change in NN Ser by fitting all possible sine waves to a plot of mid-eclipse timings vs cycle number. A function of form
was fitted to the plot for values of between 2 and 500000 days, where was kept fixed at the orbital period of the binary, is the modulation period of the period change, is the amplitude of the period modulation, and is a measure of the phase of the zero point of the modulation with respect to the zero point of the binary period. As we are interested in the minimum possible mass, we assumed that the inclination of the orbital plane of the third body is aligned with the line of sight, i.e. sin 1. This gave us the values of A3 for all possible modulation periods between 2 and 500000 days. From this, we were able to use Kepler’s law and the observed luminosity of NN Ser to find the range of allowable masses of the third body which could cause the observed period change in NN Ser. The minimum possible mass comes from the fact that we have not seen a reversal in the period change of NN Ser. The minimum value of is therefore 30 years, which corresponds to a minimum mass of 0.0043 M⊙.
The maximum value of comes from the luminosity of the binary system in eclipse. The luminosity of the third body must be equal to or less than the observed mid-eclipse luminosity. This means that it must have a mass equal to or less than that derived for the secondary star. If the maximum mass is 0.18M⊙ then the maximum orbital period for any third body is days 285 years.
We therefore find that, on the basis of the current data at least, a low-mass companion to the binary system could cause the observed changes in mid-eclipse timings that we observe in NN Ser, and that the long periods suggested by our data would be able to accommodate NN Ser’s primary even before its evolution to a white dwarf. Our results also indicate that measuring eclipse timings of binary systems is potentially a very sensitive method of detecting extra-solar planets in long-period orbits. We suspect however, that as in other instances, further observations will rule out a third body.
4.3 Comparison with angular momentum loss models
The period decrease we have measured in NN Ser may also be explained by angular momentum loss from the binary system. Angular momentum loss in CVs and pre-CVs is governed by two mechanisms - gravitational radiation and magnetic braking. The rates of AM loss caused by both mechanisms must be added together to find the total AM loss for the system. We compare the inferred angular momentum loss rate for NN Ser (corresponding to the rate of period decrease) to both the values predicted by the standard CV magnetic braking rate (Rappaport et al., 1983), based on extrapolation from studies of braking rates of solar-type stars in clusters, and to the reduced magnetic braking rate (Sills et al., 2000), based on more recent data, for which the angular momentum saturates at lower masses. Under the standard model, the angular momentum, J, decreases as (Skumanich, 1972), where is the angular velocity of the star. However, the reduced braking model suggests that the angular momentum loss is best modelled as for and for , where the threshold rate, is much lower than the rotation rates of CVs. This means that the new suggested is anything between and times smaller than assumed in the majority of CV studies.
If this is correct, we require a large-scale revision of CV evolution, possibly with systems staying at an approximately fixed period throughout their lifetime rather than migrating from long to short periods. However, such a model has significant problems when compared to observations, particularly as the mass transfer rate should be much lower than seen in the high accretion rate group of CVs known as novalike variables.
Both models were applied to CV studies by Andronov et al. (2003), hereafter APS03.
4.3.1 Gravitational radiation
We use the same expression for AM loss due to gravitational radiation as used in APS03, although this was misquoted in their paper. The correct expression is given by:
| (12) |
where M1, M2 and M are the white dwarf mass, secondary mass and total mass respectively, and a is the binary separation given by Newton’s form of Kepler’s third law . For NN Ser this gives a range of values of 5.75 1.74 ergs, over 100 times smaller than required to drive our measured value of for NN Ser.
4.3.2 Standard magnetic braking model
The standard model for magnetic braking in CVs is based upon studies of the solar wind and and the rotation periods of solar-type stars in open clusters (Weber & Davis 1967; Skumanich 1972; Mestel & Spruit 1987). Rappaport et al. (1983) developed an empirical prescription that is still commonly used in CV studies. This relationship is given by
| (13) |
where 0 4 is a dimensionless parameter and is the angular frequency of rotation of secondary star (= binary period for CVs) in rad s-1 . We applied this to NN Ser to find the predicted standard angular momentum loss rate for this pre-CV. The results can be seen in Fig. 6. APS03 cut off the standard magnetic braking model at a secondary mass of 0.3 M⊙ to satisfy the standard CV theory. This states that as the secondary becomes convective, the magnetic field is no longer locked to the stellar core and so either dissipates or is rearranged, cutting off the magnetic braking mechanism. APS03 suggested that there is no evidence for this cut-off, so we have not applied it here. We find that by ignoring the magnetic braking cut-off, this model can explain the observed loss rates seen in NN Ser.
4.3.3 Reduced magnetic braking model
The more recently proposed model for angular momentum loss due to magnetic braking was applied to CVs in APS03. Studies of the rotational periods of low-mass stars (Queloz et al. 1998; Collier-Cameron & Jianke 1994; Keppens et al. 1995; Krishnamurthi et al. 1997; Sills et al. 2000) all showed that the standard model overestimates angular momentum loss rates for periods below 2.5 – 5 days and that a modification of the standard model was required for those high rotation rates. APS03 modelled the modified angular momentum loss rates using a prescription with the same functional form as that of Sills et al. (2000), given by
| (14) |
where is the critical angular frequency at which the angular momentum loss rate enters the saturated regime. The constant Kw = 2.7 g cm s-1 is calibrated to give the known solar rotation rate at the age of the Sun (Kawaler, 1988). The values of were calculated from the values of given in Sills et al. (2000) using the relationship between and convective turnover time, given by
| (15) |
The values of were taken from Kim & Demarque (1996), assuming an age of 0.2 Gyr.
Again, the prescription was applied to NN Ser. Results are shown in Fig. 6. Our plot differs significantly from the original plot in APS03 due to their mis-calculation of the angular momentum loss due to gravitational radiation. By applying the correct gravitational radiation loss rate, the total angular momentum loss rates predicted by APS03 are within 1 order of magnitude of the standard magnetic braking model rather than 2 orders of magnitude lower, as they originally claimed. However, this is still too low to explain the loss rates seen in NN Ser.

5 Discussion
We have found that only two mechanisms can explain the observed period change in NN Ser - either a genuine angular momentum loss from the system or an unseen third body in orbit around the binary. In the case of an angular momentum loss, our observations show that the system is losing angular momentum at the rate predicted by Rappaport et al. (1983), but only if we assume that magnetic braking is not cut off as the secondary mass reaches 0.3 . APS03 pointed out that an increase in the angular momentum loss rate at low periods can solve a major problem regarding the theoretical vs observed values of the period minimum. If CV evolution at h were driven solely by gravitaional radiation, Patterson (1984) found that the period minimum should be at 1.1 hr rather than the observed value of 1.3 hr. He also noted that the angular momentum loss rates would be very low for these short-period systems, implying a low mass accretion rate and therefore a high population of CVs at the minimum period, a prediction that is contradicted by observation. By adding the extra angular momentum loss rate from magnetic braking, the cut-off is shifted to longer periods. However, our value of the magnetic braking rate causes the opposite problem. We find that at short periods, the magnetic braking rate is almost 100 times the rate of angular momentum loss due to gravitational radiation. Paczynski (1981) showed that, for constant ,
(see also Patterson, 1984), bringing the minimum period up to a value of 331 mins 5.5 hours, which is clearly not correct.
We also have the continuing problem of how to explain the presence of the period gap - a dearth of systems with periods . If magnetic braking does not shut off as the secondary becomes fully convective then there is no reason for systems to cease mass-transfer between those periods. APS03 suggested that instead of a migration of CVs from long- to short-period, the systems above and below the period gap may belong to two different populations, with no migration between the two. However, this is more likely for their longer-timescale angular momentum loss, as their model depends upon the presence of an evolved secondary star, than for our measured magnetic braking rate.
6 Conclusions
We find that there are two possible explanations for the observed period change in the pre-CV NN Ser over the last 15 years. If the change is due to a genuine angular momentum loss from the system then the rate corresponds to an angular momentum loss that agrees most closely with the standard magnetic braking rate proposed by Rappaport et al. (1983), and that the reduced magnetic braking rate of Andronov et al. (2003) underestimates the measured rate by 2 orders of magnitude. We find no evidence for a cut-off in magnetic braking as the secondary mass drops below . If the period change is instead due to a third body, we place constraints on such a body of 0.0043 M and 30 years P 285 years.
As a by-product of this investigation, we have found that the energy requirements of the Applegate (1992) quadrupolar distortion mechanism are significantly increased once one accounts for the role of the inner part of the star in counter-balancing the outer shell.
7 Acknowledgements
CSB was supported by a PPARC studentship. TRM acknowledges the support of a PPARC Senior Research Fellowship. ULTRACAM is supported by PPARC grant PPA/G/S/2002/00092. This work is based on observations from the William Herschel Telescope, operated by the Isaac Newton Group at the Observatorio del Roque de los Muchachos of the Instituto de Astrofisica de Canarias. This research was carried out, in part, at the Jet Propulsion Laboratory, California Institute of Technology, and was sponsored by the National Aeronautics and Space Administration.
References
- Andronov et al. (2003) Andronov N., Pinsonneault M., Sills A., 2003, ApJ, 582, 358
- Applegate (1992) Applegate J. H., 1992, ApJ, 385, 621
- Applegate & Patterson (1987) Applegate J. H., Patterson J., 1987, ApJ, 322L, 99
- Catalan et al. (1994) Catalan M. S., Davey S. C., Sarna M. J., Smith R. C., Wood J. H., 1994, MNRAS, 269, 879
- Collier-Cameron & Jianke (1994) Collier-Cameron A., Jianke L., 1994, MNRAS, 269, 1099
- Dhillon & Marsh (2001) Dhillon V. S., Marsh T. R., 2001, NewAR, 45, 91
- Faulkner (1971) Faulkner J., 1971, ApJ, 170, 99
- Gorda & Svechnikov (1998) Gorda S. Y., Svechnikov M. A., 1998, ARep, 42, 793
- Haefner (1989) Haefner R., 1989, A&A, 213, L15
- Haefner et al. (2004) Haefner R., Fiedler A., Butler K., Barwig H., 2004, A&A, 428, 181
- Harpaz & Rappaport (1991) Harpaz A., Rappaport S., 1991, ApJ, 383, 739
- Harpaz & Rappaport (1995) Harpaz A., Rappaport S., 1995, A&A, 294, L49
- Kawaler (1988) Kawaler S. D., 1988, ApJ, 333, 236
- Keppens et al. (1995) Keppens R., MacGregor K. B., Charbonneau P., 1995, A&A, 294, 469
- Kim & Demarque (1996) Kim Y., Demarque P., 1996, ApJ, 457, 340
- Kraft et al. (1962) Kraft R. P., Matthews J., Greenstein J. L., 1962, ApJ, 136, 312
- Krishnamurthi et al. (1997) Krishnamurthi A., Pinsonneault M. H., Barnes S., Sofia S., 1997, ApJ, 480, 303
- Lanza et al. (1998) Lanza A. F., Rodono M., Rosner R., 1998, MNRAS, 296, 893
- Marsh & Pringle (1990) Marsh T. R., Pringle J. E., 1990, ApJ, 365, 677
- Mestel & Spruit (1987) Mestel L., Spruit H. C., 1987, MNRAS, 226, 57
- Paczynski (1981) Paczynski B., 1981, AcA, 31, 1
- Patterson (1984) Patterson J., 1984, ApJ Supp., 54, 443
- Pigulski & Michalska (2002) Pigulski A., Michalska G., 2002, IBVS, 5218
- Queloz et al. (1998) Queloz D., Allain S., Mermilliod J. C., Bouvier J., Mayor M., 1998, A&A, 335, 183
- Rappaport et al. (1983) Rappaport S., Verbunt F., Joss P. C., 1983, ApJ, 275, 713
- Reid & Mahoney (2000) Reid I. N., Mahoney S., 2000, MNRAS, 316, 827
- Ritter et al. (2000) Ritter H., Zhang Z. Y., Kolb U., 2000, A&A, 360, 969
- Sills et al. (2000) Sills A., Pinsonneault M. H., Terndrup D. M., 2000, ApJ, 534, 335
- Skumanich (1972) Skumanich A., 1972, ApJ, 171, 565
- Spruit & Ritter (1983) Spruit H. C., Ritter H., 1983, A&A, 124, 267
- Stauffer et al. (1997) Stauffer J. R., Hartmann L. W., Prosser C. F., Randich S., Balachandran S., Patten B. M., Simon T., Giampapa M., 1997, ApJ, 479, 776
- Vaz & Nordland (1985) Vaz L. P. R., Nordland A., 1985, A&A, 147, 281
- Verbunt & Zwaan (1981) Verbunt F., Zwaan C., 1981, A&A, 100, 7
- Warner (1995) Warner B., 1995, Cataclysmic Variable Stars. Cambridge Astrophysics Series
- Weber & Davis (1967) Weber E. J., Davis L. J., 1967, ApJ, 148, 217
- Wood & Marsh (1991) Wood J. H., Marsh T. R., 1991, ApJ, 381, 551