Eötvös University, Budapest, Pázmány Péter sétány 1/A, H-1518, Budapest, Hungary
Department of Physics, Bolyai Military Univ. POB 12, H-1456 Budapest, Hungary
Konkoly Observatory, POB 67, H-1525 Budapest, Hungary
98.70.Rz (GRB, gamma ray sources) 98.80.-k (cosmology)
Analysis of the BATSE Continuous MER Data
Abstract
The CGRO/BATSE database includes many types of data such as the 16-channel continuous background or medium energy resolution burst data (CONT and MER data types). We have calculated some four hundred burst’s medium energy resolution spectra and Principal Component Analysis has been applied. We found five components can describe GRBs’ spectra.
1 Introduction
In the process of understanding the internal mechanism of the gamma ray bursts it is of great importance, to classify the events, to find important and less important variables among the observed parameters. Searching for groups and subgroups is still one of the main goals of the GRB research. The BATSE GRB database produced interesting results (e.g. [3, 4, 5, 7, 10] and the references therein). BATSE CONT data are available on the Internet via anonymous ftp from the CGRO Science Support Center site [11]. The CONT data type is trigger independent, has a spectral resolution of channel and a temporal resolution of s. Data are organized into 8x16 matrices for each time bin, 8 being the number of detectors and 16 the number of energy channels. These channels are used to approximate the burst’s spectrum which is quite variable during the burst (e.g. [6, 8]). We estimated using Principal Component Analysis (PCA) how many parameters are necessary to characterize CONT data.
2 Data Selection
In the CONT database there are bursts ranging from BATSE trigger number to . The data are background-subtracted and continuous. There is no clear indication where the burst starts or where it ends, so we defined the following criteria: If the count rate exceeds the level for a given energy channel, the entire bin is included in the summation, where is the variation of counts in the given channel. The background variation of a channel () is the average count rate over selected ”burst-free” intervals calculated from 200 time bins when no burst has occurred. After the summation every burst was represented by a -element vector. At some bursts none of the channels had a greater count rate than and obviously these bursts were excluded from the sample.
3 Data processing
Summing up the selected time bins (for the triggered detectors only) we got a 16-element vector for each burst. Excluding the bursts with no counts above the level meant to exclude GRBs. Further were excluded because they had more than four negative elements. Therefore bursts remained in this analysis. To proceed further in processing the data we took the logarithm of the count values and divided them with the sum of the 16 elements. (If we keep only the bursts with 16 positive values only 104 bursts remain, therefore if the burst has less than five negative values these values are replaced with 1, which should not cause significant changes in our analysis.)
4 Principal Component Analysis
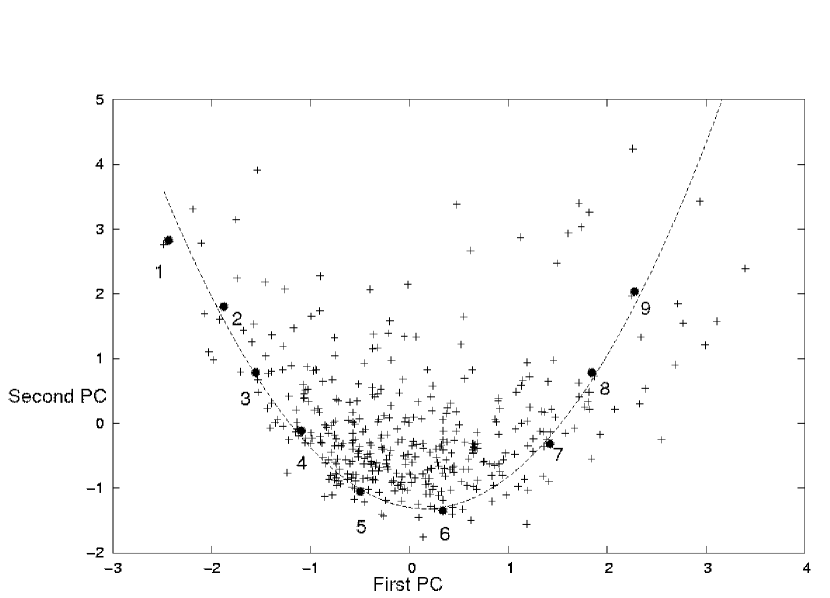
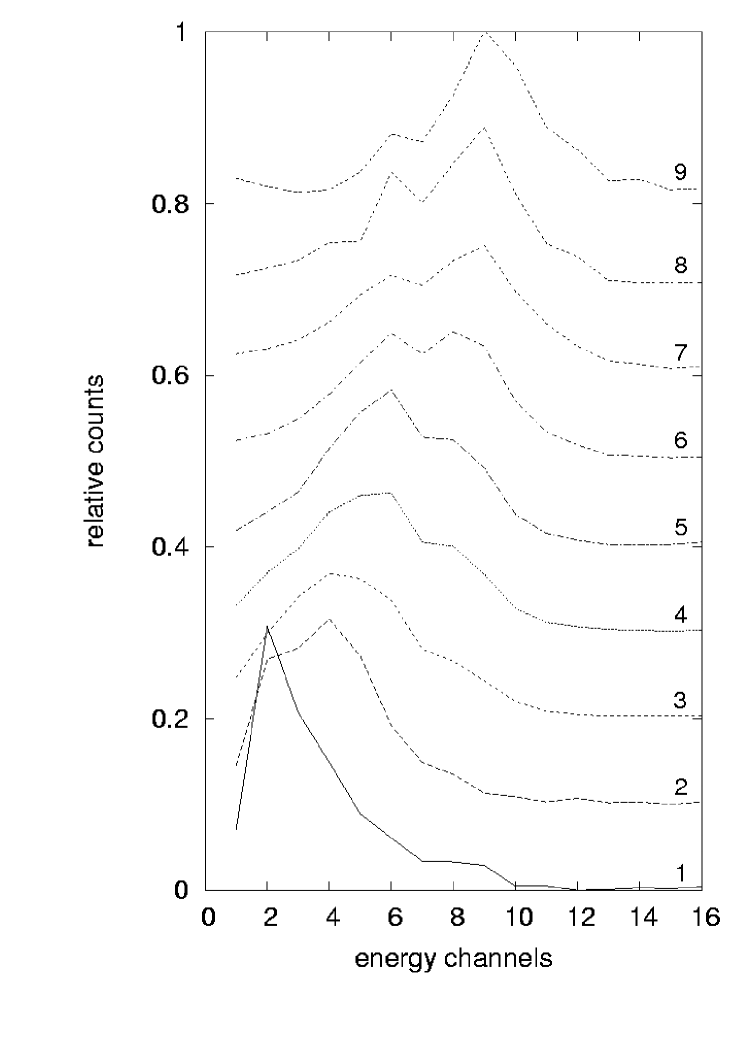
The PCA [9] method has a growing importance in astronomy [1, 2]. It is used to distinguish between relevant and non-relevant variables. One can imagine the method as a rotation in a multi-dimensional space (with normalized variables) which finds the direction of the greatest standard deviation. Based on our sample of bursts we have performed a Principal Component Analysis. Since we divided with the sum of the 16 elements of the vector, the most obvious Principal Component, the intensity of the burst has not been taken into account. Table 1. shows the eigenvalues of the PCA. If the eigenvalue is less than 0.7 (Joliffe level [9]) the PC is not important. If the eigenvalue is bigger than 1 the PC is very important. Therefore the five biggest PCs are enough to describe the MER spectra of the bursts. These five PCs contain the 78.1% of the whole MER spectral information. Figure 1. shows the first vs. second PCs distribution. The 401 positions of the bursts lay in an area that can be delimited by an arc. As Figure 2. shows the spectra change continuously along the arc.
5 Conclusion
We performed PCA on the 16x401 element matrix and we concluded that the information specific for the spectra (not considering the intensity) can basically be given by the first five Principal Components. Furthermore, we recognized the distribution of GRBs in the scatter plot of the first two PCs can be delimited roughly by an arc.
Acknowledgements.
This research was supported through OTKA grants T034549 and T48870.References
- [1] \BYBagoly Z. et al. \INApJ4982002342
- [2] \BYBalázs L.G. et al. \INA&A3112002145
- [3] \BYHakkila J. et al. \INApJ5382000165
- [4] \BYHorváth I. \INApJ5081998757
- [5] \BYHorváth I. \INA&A3922002791
- [6] \BYMészáros P. \INScience291200179
- [7] \BYMészáros A., Bagoly Z., Vavrek R. \INA&A35420001
- [8] \BYRyde F. et al. \INA&Ain press2005astro-ph/0411219
- [9] \BYJolliffe \INPrincipal Component AnalysisNew York: Springer1986
- [10] \BYMukherjee S. et al. \INApJ5081998314
-
[11]
ftp://cossc.gsfc.nasa.gov