First VUV full-Sun spectrum of the transition region with high spectral resolution compared to cool stars
This paper reports the first full-Sun vacuum ultraviolet (VUV) emission line profile originating from the transition region from the chromosphere to the corona. It is based on a raster scan of the whole solar disk using SUMER/SOHO. The full-Sun spectrum has a spectral resolution which allows an investigation of details in the line profile as well as a thorough comparison to stellar spectra as obtained, e.g. with FUSE or STIS/HST. The full-Sun spectrum shows enhanced emission in the wings, and is well described by a double Gaussian fit with a narrow and a broad component. It is shown that the broad component is due to structures on the solar surface, especially those related to the magnetic chromospheric network. Thus it is proposed that the broad components of other solar-like stars are also a consequence of the mixture of surface structures, and not necessarily a signature of small-scale heating processes like explosive events, as it is commonly argued. A comparison to spectra of luminous cool stars shows that the line asymmetries of these stars might also be a surface structure effect and not or only partly due to opacity effects in their cool dense winds. These comparisons show the potential of high quality full-Sun VUV spectra and their value for the study of solar-stellar connections. As an example, this study proposes that Cen A has a considerably higher amount of magnetic flux concentrated in the chromospheric magnetic network than the Sun.
Key Words.:
Stars: coronae — Sun: corona — Sun: transition region — Line: profiles — Ultraviolet: stars1 Introduction
Our information on processes in the outer atmospheres of the Sun, solar-like stars and stars of other types is largely based on the analysis of emission line spectra from the ultraviolet and extreme vacuum ultraviolet (VUV) to the X-rays. Of special value is the VUV wavelength range from the Lyman edge at 912 Å to 1600 Å, which is dominated by emission lines formed at temperatures from K to almost K and chromospheric continua. Through this temperature coverage all the way from the chromosphere into the corona, the VUV is best suited to investigate the heating processes and dynamics of coronae and winds of cool stars.
On the instrumental side, in the VUV one can resolve even details of the emission line profiles. The typical thermal line width at K is of the order of km/s, which is setting a minimum requirement for the spectral resolution of , with being the speed of light in vacuum. This is fulfilled by current VUV spectrographs, but so far X-ray instruments operating below 100 Å lack this capability (cf. Table 1a).
To interpret the stellar observations and to relate features in the spectral profile to actual physical processes or structures on the stellar surface, a comparison to observations of the Sun with high spectral, spatial, and temporal resolution is of vital importance. To compare results from solar studies with stellar observations, one needs high spectral resolution spectra of the Sun observed as a star. However, such a reference VUV spectrum of the Sun is lacking. Therefore Pagano et al. (2004) went as far as proposing to use an Cen A spectrum as a reference full-Sun spectrum. This is based on the assumption that despite its differences to the Sun, Cen A is solar-like enough to serve this purpose.
There are plenty of solar spectra with sufficient spectral resolution (cf. Table 1b), e.g. with the SUMER spectrograph on-board SOHO (Wilhelm et al., 1995, 1997), even for different solar structures (Curdt et al., 2001, 2004). The largest slit of SUMER covers . This corresponds to 0.04 % of the visible solar disk, with the slit length covering about 15 % of the disk diameter. On the other hand, considering typical line widths in the VUV of the order of 0.1–0.2 Å, instruments observing the Sun as a star lack the spectral resolution necessary to resolve the line profile (cf. Table 1c). Thus there is a real need for a Sun-as-a-star or full-Sun VUV spectrum.
| wavelength | spec. resolution | ||||||
| instrument | range [Å] | [Å] | ref. | ||||
| (a) | XMM/Newton | 6 | – | 38 | 0.05 | 500 | (1) |
| Chandra/LETG | 5 | – | 175 | 0.06 | 1000 | (2) | |
| FUSE | 912 | – | 1180 | 0.05 | 20 000 | (3) | |
| STIS/HST | 1130 | – | 3100 | 0.02 | 100 000 | (4) | |
| GHRS/HST | 1100 | – | 3200 | 0.02 | 100 000 | (5) | |
| (b) | CDS/SOHO | 150 | – | 780 | 0.2 | 3 000 | (6) |
| SUMER/SOHO | 465 | – | 1610 | 0.04 | 20 000 | (7) | |
| HRTS | 1190 | – | 1730 | 0.05 | 30 000 | (8) | |
| UVSP/SMM | 1150 | – | 3600 | 0.02 | 100 000 | (9) | |
| (c) | EGS rocket | 300 | – | 1100 | 2 | 400 | (10) |
| SOLSTICE | 1190 | – | 4200 | 1.5 | 2 000 | (11) | |
References: 1 – den Herder et al. (2001); 2 – Brinkman et al. (2000); 3 – Moss et al. (2000); 4 – Woodgate et al. (1998); 5 – Brandt et al. (1994); 6 – Harrison et al. (1995); 7 – Wilhelm et al. (1997); 8 – Brueckner & Bartoe (1983); 9 – Woodgate et al. (1980); 10 – Woods & Rottman (1990); 11 – Rottman et al. (1993);
One possibility to get line profiles of the Sun-as-a-star might be to point a spectrograph above the limb and to analyze the instrumental stray-light. The major complication here is that the different parts of the solar disk contribute differently to the stray-light, and the results depend on the stray-light model used. Nevertheless, this has been done using SUMER and results have been reported by Lemaire et al. (2004). However, they only analyzed continuum intensities, and not details of line profiles, yet. Further work will have to show if this technique can provide high spatial resolution data with sufficient quality.
It is known since long that for a large variety of stars the emission lines originating from the transition region from the chromosphere to the corona, i.e. plasma at about K, show enhanced emission in the wings (Linsky & Wood, 1994; Wood et al., 1996, 1997). Recently this was studied in depth for a larger number of emission lines in the case of Cen A (Pagano et al., 2004). These profiles are usually well fitted by double Gaussians, with a narrow component fitting the line cores and a broad component accounting for the excess in the wings.
Before they were discovered with stars, such wing enhanced profiles have been found on the Sun (Kjeldseth Moe & Nicolas, 1977), and have been interpreted as being the signature of small-scale reconnection events, so called explosive events (Dere & Mason, 1993). Recently an alternative scenario was suggested by Peter (2001) in which the broad components might be due to waves propagating up into the corona.
The rough similarity of the double Gaussian line profiles of solar spectra, usually acquired near disk center, and the disk-integrated stellar profiles led a number of authors to attribute the broad components of the stellar profiles also to small-scale reconnection events (Wood et al., 1997; Pagano et al., 2004). However, there are subtile differences between the stellar and the spatially resolved solar spectra, especially concerning the relative contribution of the broad component and its line width, as will be pointed out later in this paper.
Also emission lines of luminous cool stars show such double Gaussian profiles, as has been recently noted by Dupree et al. (2005). They proposed a working hypothesis that the line asymmetries are due to an opacity effect in the cool dense wind of these stars. It remains to be seen, if this sound interpretation is unique, or if the distribution of surface structures could also lead to the observed spectra. Here, again, a full-Sun line profile would be of vital importance.
In order not to compare apples with pears, one has to compare the stellar line profiles to an actual Sun-as-a-star or full-Sun spectrum. Because of the lack of a direct observation, one had to get a proxy for such a profile. For their comparison of Cen A and the Sun Pagano et al. (2004) used solar spectra from UVSP and SUMER (cf. Table 1) acquired at disk center. To get the solar irradiance they corrected the disk center radiance by simply multiplying with a factor , where is the solar radius (cf. Wilhelm et al., 1998). Thus they did not account for any center-to-limb variation, which can be more than a factor of 10 for transition region lines (see Table 6 of Wilhelm et al., 1998).
In their study of the magnetic activity of Cet and Cen A as compared to the Sun, Judge et al. (2004) properly accounted for the center-to-limb variation of the radiance by using observed center-to limb intensity variations from actual observations with the SUMER instrument by Dammasch et al. (1999). As Judge et al. (2004) were mainly interested in the irradiance in the various lines, and not in the actual shape of the full-Sun line profile, this procedure is perfectly adequate.
In case one is interested in details of the line profile, e.g. the superposition of a narrow and a broad component, one can no longer rely on such a method as proposed by Judge et al. (2004). Instead in the present paper a construction of a full-Sun spectrum based on a full-disk raster scan of the SUMER instrument will be utilized. Due to instrumental effects a simple summation of the individual spectra acquired during the full-disk rasters is not possible, and a more sophisticated approach will be used.
The outline of the paper is as follows. In Sect. 2 the SUMER full-disk scans and instrumental effects are described before the construction of the full-Sun spectrum is outlined. The resulting full-Sun spectrum is characterized in Sect. 3, and center-to-limb effects and the influence of spatial structures are discussed, before the consequences of these results are laid out in Sect. 4. Finally the full-Sun spectrum is compared to Cen A and other solar-like stars in Sect. 5 as well as to luminous cool stars in Sect. 6, paying special attention to the consequences for the interpretation of these stellar profiles. Sect. 7 concludes the paper with a discussion of the main results.
2 From a full-disk scan to a full-Sun spectrum
2.1 The SUMER C IV full-disk scan
The SUMER VUV spectrograph acquired a number of full-disk scans in various VUV emission lines, which have been analyzed in detail to investigate the radiance of the Sun, e.g. with respect to the center-to-limb variation or the spatial distribution of line intensities (Wilhelm et al., 1998). Out of these full-disk rasters only three were recorded containing the full spectral information, i.e. the line profile; for the others just moments of the profile have been transmitted to the ground, which is useful to investigate the line radiance, but, of course, insufficient to study details of the spectral profile.
The spectral properties of the three scans with full spectral information in He i (584 Å), Ne viii (770 Å) and C iv (1548 Å) have been investigated in detail by Peter (1999a, b). Using these data Peter (1999a) could show that the transition region line shifts really show a center-to-limb variation in accordance with a predominantly radial flow, i.e. the shift is proportional to the cosine of the heliocentric angle, and that (low) coronal lines show a net blueshift at disk center, while the transition region is redshifted.
The data reduction procedure for the SUMER data is described in detail in Peter (1999a); peculiarities of the data processing, e.g. correcting the cushion distortion of the image on the SUMER detector are discussed thoroughly by Peter & Judge (1999). In short, one has to correct the data for flat-field, dead time, gain, and geometric distortion as well as for the temporal drift of the image on the detector, which will be of importance in the next subsection (Sect. 2.2).
In the present study the SUMER full-disk data as reduced by Peter (1999a) are used to construct a full-Sun spectrum, concentrating on the full-disk raster in C iv (1548 Å). Under ionization equilibrium conditions this line is formed at K in the middle transition region. The raster was performed on 4. and 5. Feb. 1996 over a total time of 31 hours. The exposure time of each individual spectrum acquired through the slit was 15 s, and a 2.1 Å (50 wavelength pixels) wide part of the spectrum centered around the C iv line was transmitted to the ground. The line was placed on reference pixel 403 on the KBr coated part of the detector. The scan step (perpendicular to the slit) to aquire the raster was 3″, so the resulting maps are () under-sampled. However, as all parts of the solar disk are equally represented in the raster, this does not pose a problem when constructing a full-Sun spectrum. At the peak of the C iv line on average (median value) only 13 counts per pixel were registered. Therefore the data have been binned along the slit by a factor of 3.
After the binning a single Gaussian fit was applied to each spectral profile using a Genetic Algorithm based optimization method (Pikaia, Charbonneau, 1995), which proved to be a very robust and reliable tool for the problem at hand.
As there is no on-board wavelength calibration lamp with SUMER, the line positions are calibrated so that the line shifts at and directly above the limb vanish on average (when having corrected for solar rotation). Above the limb the line of sight completely transverses the optically thin transition region, and statistically one should see as much plasma flowing towards the observer as is flowing away. Thus there should be no net line shift. This is discussed in detail by Peter (1999a) and Peter & Judge (1999).
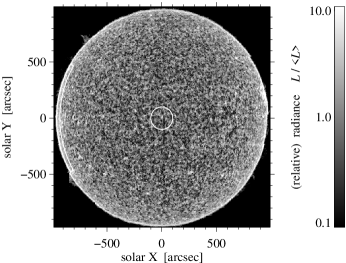
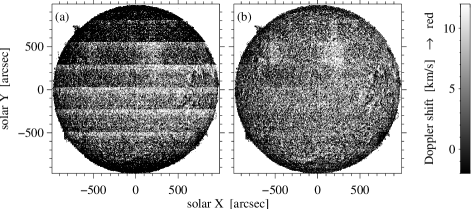
In Fig. 1 the raster of the full Sun is plotted in line radiance relative to the median radiance of the disk. The Doppler shifts of the C iv line before and after all the corrections are plotted in Fig. 2a and b, respectively. Please note the strong variation of line shift in the uncorrected Doppler map (Fig. 2a) while acquiring the data starting from the south-east (bottom-left), first moving westward and finally finishing in the north-east (top-left). One can still identify the eight sweeps of the spectrograph rastering the full disk back and forth in Fig. 1 and Fig. 2, especially well in the uncorrected Doppler shifts (Fig. 1a).
2.2 SUMER long-term wavelength drifts
In principle one could construct the full-disk integrated spectral profile of the C iv line by simply adding up all the individual spectra acquired across the whole disk. However, this does not work, as the SUMER instrument shows a systematic temporal drift of the image on the detector in the wavelength direction, which is related to the temperature stabilization of the instrument, kept at a defined mean temperature during operation as has been shown in detail by Rybák et al. (1999). The typical time scale of this drift is about two hours with a peak-to-valley variation of the line position on the detector of about 0.7 spectral pixels, corresponding to 0.03 Å or about 6 km/s Doppler shift for the C iv line at 1548 Å (see Fig. 1 of Rybák et al., 1999).
For longer observations with heavy usage of the (pointing) mechanisms, like during the 31 hours full-disk raster under investigation, stronger drifts can occur, in the present case summing up to or more spectral pixels, corresponding to Doppler shifts of 7 km/s (cf. Peter, 1999a). This is nicely illustrated by the uncorrected Doppler map shown in Fig. 2a. The long-term drift can be corrected for, based on the argument that the variation of the Doppler shift should be systemantic on the Sun, i.e. on average it should show a smooth variation from one limb through disk center to the other limb. Especially the east-west varaition should be the same as the north-south variation. These corrections for the full-disk Doppler shifts as shown in Fig. 2a & b have been performed by Peter (1999a).
In conclusion, the amplitude for the systematic instrumental drifts of the line shifts, summing up to some 14 km/s, is not negligible111Note that under normal circumstances for most of the observations performed with SUMER, this instrumental drift of the line position plays only a minor rôle or is completely negligible. It is only the very long duration combined with the heavy use of the mechanisms of the instrument for the full-disk scan which leads to this strong effect. when compared to the width of a typical transition region line of some 20 to 30 km/s (Gaussian width, i.e. half width at of maximum). Therefore we cannot simply add up all the spectra acquired during the full-disk scan to get a full-Sun spectrum, as the resulting spectrum would be heavily influenced by the instrumental effects.
One possible solution would be to shift each individual spectrum in wavelength by the same amount as the Doppler shifts are corrected. However, the spectra, especially in the less bright inter-network areas, are still relatively noisy, even after the binning, which is because of the short exposure time and the corresponding low counts (cf. Sect. 2.1). In order to shift the line profile reliably by a fraction of a pixel, one would have to be able to perform a reliable interpolation of the spectral profile. As this is prevented by the low signal-to-noise ratio, this strategy seems problematic for the present data set.
2.3 Constructing the full-Sun spectrum
Because of the problems outlined above, for the present study an alternative procedure based on the Gaussian fits to the line profile will be used. While the original spectra have a too low signal-to-noise ratio in order to shift them by a fraction of a pixel in wavelength through interpolation, the data quality is sufficient for a reliable Gaussian fit to the line profile using an appropriate tool. Being a global optimization method, the Genetic Algorithm implemented by Charbonneau (1995) is ideal for this task, and it has proven to give reliable results on a large number of problematic optimization tasks. Therefore we use the line radiances (cf. Fig. 1), corrected Doppler shifts (cf. Fig. 2), line widths and continuum levels as following from the (single) Gaussian fits to calculate the line profiles at each respective location on the solar disk. As mentioned in the original work, the single Gaussian fits give an excellent description of the original line profiles (Peter, 1999a).

The dashed lines show the two components of a double Gaussian fit to the line profile; the double Gaussian fit itself is practically identical to the line profile. The dotted line shows the relative difference between the double Gaussian fit and the full disk spectrum (multiplied by 5); the relative difference stays well below 1 %. For comparison the solid line shows a single Gaussian fit.
Panels (b) and (c) show the same, but for the disk center and limb regions as outlined in Fig. 1.
Panels (d) to (e) show the bisectors of the line profiles shown in panels (a) to (c), respectively.
These spectra can now be easily summed up to give a full-Sun spectrum, or to evaluate spectra of smaller areas on the Sun for comparison. In the radiance map (Fig. 1) we outlined one such region at disk center (with a diameter of 1/10 of the disk diameter) and another region from 95 % of the disk radius (930) to the limb (960) within from the equator at the east limb.
The potential problem of this procedure is that only a single Gaussian fit is performed to the line profiles, while it has been known for long that the transition region lines, even when observed with the highest possible spatial resolution (1″ to 2″), partly show enhanced emission in the wings of the lines (Kjeldseth Moe & Nicolas, 1977), which is well described by a double Gaussian fit (Peter, 2000). With the present data the signal-to-noise ratio due to the low count rates prevents a double Gaussian fit. However, it will be shown in Sect. 3.2 that these broad components describing the wings of the high spatial resolution spectra contribute only little to the total emission, and therefore might be neglected for the present investigation.
The full-Sun spectrum and, for comparison, the disk-center and limb spectra are displayed in Fig. 3a–c as thick lines (in histogram mode). Fig. 3a shows the first VUV full-Sun line profile with a spectral resolution allowing to investigate details of the line profile. In contrast to earlier work this spectrum is not only based on spectra taken on a small fraction of the visible solar hemisphere, but is obtained through an integration over the full solar disk.
3 Characteristics of the solar full-disk spectrum
To characterize the full-Sun spectrum and to compare it with stellar spectra, a single and a double Gaussian fit is applied to the spectrum. Here we use again the Genetic Algorithm based fit (Charbonneau, 1995) together with a fast local method (Levenberg-Marquardt; IDL-code mpfit implemented by C.B. Markwardt). The fits are shown in Fig. 3a and the fit parameters are listed in Table 2.
| C iv (1548 Å) | line width [km] | |||||
| [km/s] | fwhm | |||||
| full Sun | SG | 0.92 | 1.9 | 28.7 | 47.7 | 26.1 |
| NC | 0.52 | 1.0 | 25.3 | 42.1 | 22.4 | |
| BC | 0.48 | 6.1 | 41.8 | 69.6 | 40.2 | |
| disk center | SG | 0.90 | 4.6 | 28.3 | 47.1 | 25.8 |
| NC | 0.47 | 3.5 | 23.8 | 39.6 | 20.7 | |
| BC | 0.53 | 10.6 | 43.0 | 71.5 | 41.3 | |
| limb | SG | 0.96 | 1.4 | 29.7 | 49.5 | 27.3 |
| NC | 0.59 | 2.1 | 27.1 | 45.1 | 24.4 | |
| BC | 0.41 | 1.7 | 39.3 | 65.4 | 37.5 | |
| bright | SG | 0.79 | 8.0 | 30.7 | 51.1 | 28.4 |
| network | NC | 0.72 | 8.3 | 25.2 | 41.9 | 22.3 |
| spectrum | BC | 0.28 | 7.2 | 53.4 | 88.9 | 52.1 |
| Cen A | NC | 0.53 | 8.8 | 25.9 | 43.2 | 23.2 |
| BC | 0.47 | 7.4 | 47.3 | 78.8 | 45.8 | |
The double Gaussian fit is an excellent match to the line profile, with the relative difference to the full-Sun spectrum being well below 1 % (the dotted line in Fig. 3a shows the relative difference multiplied by 5). The line profile shows a significant asymmetry, as the broad component of the double Gaussian fit is shifted relative to the narrow component by some 5 km/s, which is a sizeable fraction of the width of the narrow component. The narrow and the broad component contribute roughly equal shares to the total emission in the line.
3.1 Differences between the full-disk spectrum and average disk-center and limb spectra
The full-Sun line profile and the one originating from a small region around disk center (cf. Fig. 1) as plotted in Fig. 3a and b look very similar. The Gaussian fits for full-Sun and disk-center spectra are also very much alike in terms of line radiance and line width, but not in line shift (cf. Table 2).
The (east) limb spectrum (Fig. 3c) is much more symmetric compared to the disk center one, as can also be seen from the bisectors of the line profile in Fig. 3d–f. Furthermore the spectrum at the limb shows a weaker and less shifted broad component. The line width there is somewhat larger than at disk center, which can be understood in terms of an opacity effect, i.e. C iv is not completely optically thin near the limb, where the path length of the line of sight through the transition region becomes longer (cf. Mariska, 1992, Sect. 5.2.4). However, as this effect is small, it affects the full-Sun line profile only little.
The most noticeable difference between the disk-center and the limb spectra is the line shift. While at disk center C iv shows the well known redshift (Doschek et al., 1976), the line at the limb should show no shift at all, as C iv is formed (almost) under optically thin conditions. However, because of the rotation of the Sun with some 1.8 km/s at the equator, the spectra at the east and west should show the corresponding line shifts. Indeed, the line profile is quite symmetric, relatively well described by a single Gaussian fit (cf. Fig. 3c), and it is blueshifted, as expected for the east limb (cf. Table 2).
The resulting line shift of the full-Sun spectrum should be somewhere between zero and the disk center shift, but the actual value depends on the relation of intensity to Doppler shifts and the center-to-limb variation of both quantities.
Usually the shifts of transition region lines from the Sun are given as average line shift at quiet Sun disk center. This was the case in the first report of persistent transition region line shifts by Doschek et al. (1976) and is also true for the recent and still up-to date SUMER quiet Sun investigations by Brekke et al. (1997) and Peter & Judge (1999) reporting redshifts of C iv from 4.5 to 6 km/s as well as a study of a (moderately) active region by Teriaca et al. (1999) giving a slightly higher redshift. One should note that these authors derived their line shifts by fitting the line profiles by a single Gaussian.
In accordance with these results the C iv line (when fitted by a single Gaussian) is redshifted by 4.6 km/s at disk center (cf. Table 2). In contrast, (the core of) the full-Sun spectrum shows a considerably smaller redshift, only 1 km/s or 2 km/s, depending on whether one used a double Gaussian fit or a single Gaussian fit (which is then pulled to the red by the line asymmetry in the wing, which is accounted for by the double Gaussian fit).
This has an important implication for stellar studies. So far, usually the disk-center quiet-Sun values have been used for solar–stellar comparisons (cf. Sect. 5). However, as the stellar spectra are always disk-integrated, one has to compare the stellar redshift not to the solar disk-center values, but to values reduced by a factor of 2 to 4! Using the persistent redshifts of the transition region lines as an indicator of stellar activity, one vastly overestimates the activity of the Sun when using the “traditional” disk center values.
3.2 Differences between the full-disk spectrum and spectra at high spatial resolution
Spectra of C iv on the solar disk with the highest spatial
resolution currently available (1″ to 2″) have been
investigated by Peter (2000, 2001) with respect to
the line asymmetries through double Gaussian fits.
These typically show line widths and shifts of the line core component
(the narrow component) comparable to the disk-center spectrum listed in
Table 2.
However, with respect to the broad components, there are three major
differences of the high spatial resolution spectra when compared to the
disk-center spectrum presented here222The 100″ radius disk-center region used here (cf. Fig. 1) corresponds to 1 % of the solar disk. The results do
not change much if one chooses a region at disk center with 200″ or
even 300″ radius, the latter one covering 10 % of the disk.
Sticking to the 100″ radius region at disk center, however, is
still large enough to be representative of the quiet Sun, but avoids any
center-to-limb effects.
(cf. Table 2).
(1) The broad components of the high spatial resolution spectra from bright
network elements contribute only some 25 to 30 % to the total line
radiance, while the broad component of the disk-center spectrum
contributes 50 %, i.e. it is as strong as the narrow component.
(2) In the high spatial resolution spectra the broad component is shifted
slightly by some 1 km/s to the blue with respect to the narrow
component, while in the disk-center spectrum the relative shift of the
broad component is about 7 km/s to the red.
(3) The broad components in the high spatial resolution spectra are much
broader than in the disk-center spectrum (by 25 %).
Especially the first point is of interest in order to check the importance of the broad components of the high spatial resolution spectra for the calculation of the full-Sun spectrum. According to Peter (2000) the enhanced emission in the wings of high spatial resolution spectra, accounted for by the broad components, is mostly restricted to the bright patches of the network covering some 13 % of the area. Using this and the numbers given in Table 2 of Peter (2000), the broad components of the high spatial resolution spectra contribute only some 10 % to the total emission of the line.
Thus the broad components of the high spatial resolution spectra could only contribute a small (of order 20 %) portion to the broad component of the full-Sun spectrum, which accounts for 50 % of the total line emission. In retrospect, this justifies to neglect the emission from the wings of the C iv line when constructing the full-Sun spectrum (cf. Sect. 2.3).
4 Interpretation of disk-integrated spectra
The above discussion has major consequences for the interpretation of the full-Sun spectrum and thus also for the interpretation of stellar VUV spectra from transition region lines.
The tail components, or broad components, of the spectra at high spatial resolution are certainly a signature of not-resolved small scale processes on the Sun. Explosive events, small reconnection events in the transition region, are a good candidate to explain these broad components, as was already argued by Dere & Mason (1993). The larger of these events, when spatially resolved, cause satellites in the blue and/or red wing of the line, shifted by up to 100 km/s or more due to an outflow from the reconnection site (Innes et al., 1997). Smaller explosive events, not spatially resolved, could then lead to the enhancement in the line wings, even though Peter & Brković (2003) presented some counter-arguments. An alternative, still speculative scenario was proposed by Peter (2001), in which the broad components are interpreted as the signature of of upward propagating magneto-acoustic waves in coronal funnels, based on an investigation of VUV lines covering the whole transition region and low corona.
Now the important question is, if one can use these interpretations for the broad components of the high spatial resolution spectra of the Sun also to understand the broad components of other stars. Considering the discussion in the preceeding subsection, the answer might be “no”.
In the present analysis we have started with perfectly single Gaussian line profiles derived from the actually observed spectra. Therefore, the broad components of the full-Sun spectrum cannot be due to broad components of the individual high spatial resolution spectra.
To investigate the nature of the broad component of the full-Sun spectrum it is instructive to first look at the disk-center spectrum, which shows very similar properties than the full-Sun spectrum. Statistically, on the Sun the redshifts are strongest over the magnetic chromospheric network, where also the transition region intensities are the highest (Brynildsen et al., 1996; Peter, 1999a, 2000). This relation of line radiance and shift can well lead to a line asymmetry with enhanced emission in the red wing, caused by the few brightest areas showing very high redshifts. This would also explain why the enhancement in the red wing is much stronger than in the blue wing, viz. the redshift of the broad component as compared to the narrow one. Please note that the Gaussian widths of the broad components of the full-Sun and disk-center spectra (cf. Table 2) are just below the (adiabatic) sound speed of 50 km/s at the formation temperature of C iv of K and thus the motions leading to the broad components are subsonic.
Finally, the much reduced shift of the narrow and core components of the full-Sun spectrum as compared to the one at disk center is simply a consequence of the center-to-limb variation and the (statistically) vanishing line shifts at the limb (cf. Sect. 3.1).
The conclusion from this discussion is that the enhanced emission in the wings of the full-Sun spectrum is not due to un-resolved small-scale processes like explosive events or wave propagation. It is more likely that it is primarily due to the large scale structures of the super-granular convection, viz. the chromospheric network, with a typical scale of some 3 to 5 % of the solar radius. This is based on the systematic differences in the flow-structure of the network and inter-network areas and especially the relation of the line shifts to radiances (e.g. Brynildsen et al., 1996; Peter, 2000). As the width of the broad component is the same in the disk-center and the full-Sun spectrum, the broad component of the full-Sun spectrum still carries information on the structure and size of the chromospheric network.
From previous work it is well established that the width of the narrow components of the disk-integrated spectra contain valuable information on the (coronal) heating process, as discussed e.g. in Wood et al. (1997), who compare a large number of stars width different activity levels. Using this information one might derive some estimate on the average net line shift. Through this the Doppler shift of the narrow component of the disk-integrated spectrum then contains information on the center-to-limb variation of the transition region emission.
From this one might distill the following rough trends concerning the
disk-integrated spectrum:
(1) The broad component contains information on the structure of and flows
in the chromospheric network.
(2) The width of the narrow component contains information on the stellar
activity and the heating process.
(3) The Doppler shift of the narrow component contains information on the
center-to-limb-variation.
5 Comparison to Cen A
and other solar-like stars
As the Sun and Cen A are quite similar in spectral type (both G2 V), and as Cen A has a very high apparent luminosity, Cen A seems to be a very good choice for a solar analogue. For this reason and especially because of the lack of a full-Sun VUV spectrum with decent spectral resolution, Pagano et al. (2004) proposed to use the Cen A spectrum as a reference for solar-stellar connections. The line fit parameters for C iv (1548 Å) from Cen A as given by Pagano et al. (2004) are repeated in Table 2. However, there are also indications for differences between the Sun and Cen A, e.g. a sightly higher mass and a 25 % lower surface gravity (Morel et al., 2000). The most noticeable difference in terms of magnetic activity is the lack of a clear indication for a UV cycle with Cen A, at least on a time scale comparable to the Sun (Ayres et al., 1995). Therefore it is of vital importance to compare the full-Sun spectrum of C iv (1548 Å) to Cen A.
Both the full-Sun and the Cen A line profile are well described by a double Gaussian fit, and the relative contributions of the two components match very well (cf. Table 2). Likewise the widths of the narrow and broad components differ only by 2 % and 12 %, respectively. In that respect Cen A indeed is a very good representative of the Sun.
There is, however, a very pointed difference in the line shifts for the full-Sun and Cen A spectra, manifesting itself by two findings: (1) The Cen A narrow component shows a more than four times higher redshift than the narrow component of the full-Sun spectrum. Previous studies could not find this disagreement because they compared the Cen A spectrum to solar spectra at high spatial resolution, rather than to a disk-integrated spectrum as derived in this paper. (2) While both the full-Sun and the Cen A broad component show a noticeable redshift, in the case of the full-Sun spectrum the broad component shows a redshift relative to the narrow component, while for Cen A there is a small relative blueshift.
According to the discussion in Sect. 4 this difference in line shifts of the narrow and core components might hint at differences between the Sun and Cen A with respect to the structure of the chromospheric magnetic network and the center-to-limb variation (items 1 and 3 at the end of Sect. 4). Considering the difference in surface gravity between the Sun and Cen A we might well expect a difference in the super-granular convection pattern — changing the network structure — and in pressure scale height — changing the emission scale height of the transition region and thus the center-to-limb variation of C iv.
6 Investigating the line asymmetry:
Diagnostics for stellar winds?
In their detailed investigation of VUV line profiles from luminous cool stars Dupree et al. (2005) propose that the winds of these stars lead to a deficit in the blue part of the line profile through an opacity effect. They investigated C iii (977 Å) and O vi (1032 Å), formed in ionization equilibrium conditions at K and K, respectively. The C iii profiles from the various stars are reasonably well fitted with a single Gaussian (within the noise of the data; except for the inter-stellar absorption feature near line center). For the O vi line a double Gaussian fit with a narrow and an approximately equally strong broad component is necessary.
If the proposal of Dupree et al. (2005) is correct, together with future modeling of the respective stellar wind this would provide stellar physics with a new powerful tool to investigate the mass loss rate of luminous cool stars. Therefore it is of importance to investigate their assumption that the line asymmetries are indeed a signature of the opacity of the wind outflow.
Assuming that the respective VUV emission line is formed close to the star, where the plasma is still almost at rest, and assuming a wind which is not optically thin, one would expect a deformation of the line profile due to absorption in the blue part of the line profile. Based on this idea Dupree et al. (2005) do a single Gaussian fit to only the red side of the line profile, which will not (or only little) be affected by absorption in the wind. The excess in the blue side of the fitted Gaussian compared to the observed spectrum is then a measure for the line emission lost from the line profile due to the opacity effect of the wind (cf. Figure 9 and 12 in Dupree et al., 2005, showing the C iii and O vi spectra along with the fits).

To investigate their proposal, the same analysis procedure is applied to the full-Sun spectrum shown in Fig. 3a. The spectrum is plotted again in a histogram style in Fig. 4a, now along with a single Gaussian fit using only the red side of the line profile (positive Doppler shifts) to perform the fit. The resulting Gaussian is over-plotted as a thick solid line. It is evident that the solar spectrum shows the same effect as the spectra of the luminous cool stars reported by Dupree et al. (2005).
To have a more realistic comparison, we binned the full-Sun spectra to roughly match the spectral resolution of the FUSE spectra used by Dupree et al. (2005), and added some 40 % random noise. Fig. 4b and c show two cases with noise on top of the same full-Sun spectrum in histogram mode. The thin solid lines show double Gaussian fits to the noisy spectra, with the two components as dashed lines. The single Gaussian fit to only the red part of the profile is over-plotted as a thick solid line. Typically this single Gaussian has an integrated radiance which is some 30 % to 50 % higher than for the actual full-Sun profile (cf. Fig. 4).
One result of this simple experiment is that the noisy spectra (Fig. 4b,c) show a much weaker broad component than the original full-Sun spectrum (Fig. 4a). While in the latter case the broad and narrow components are equally strong (the broad component contributes 47 % to the total emission), in the case of the noisy spectra the broad component contributes less than 20 % to the total emission. This result is natural, as for a noisy spectrum the narrow component can be pushed to larger line widths by the optimization algorithm and thus there is less need for a broad component when performing the line fit. This effect might be part of the reason why Dupree et al. (2005) found single Gaussians to be sufficient to fit the C iii line they show in their Fig. 9.
The major result of this experiment is that the noisy line profiles, and their fits to the red side only of the line profile, look very similar to the cool luminous stars (Fig. 9 & 12 of Dupree et al., 2005). This is especially true for Car (F0 II), Cet (K0 III) and Gem (K0 III).
In the case of the Sun with its hot, low density wind, there is no opacity effect the wind is imposing on the VUV spectra originating from the low corona and transition region. As outlined in the previous sections, the asymmetries in the full-Sun spectra are due to the distribution of structures, especially the chromospheric magnetic network. Because of the close proximity of the full-Sun spectra with added noise and the cool star spectra shown by Dupree et al. (2005) with respect to the single Gaussian fit to the red part of the line, one might wonder about the validity of the assumption to start with, i.e. the opacity effect of the wind. Of course, their working hypothesis is very attractive, as one can expect a strong wind from cool luminous stars. However, this interpretation is not unique, as also noted by the authors.
For the Sun the asymmetry of the line is due to the cell-network structure, with the strongest Doppler shifts occuring in the bright areas. The net shift of transition region lines is, e.g., due to flows or waves along loops, as has been suggested by various 1D loop models (e.g. see references in Peter & Judge, 1999) and confirmed by a recent investigation of spectra synthesized from a 3D MHD coronal model (Peter et al., 2004).
This situation could be similar to the cool, more luminous stars, where one certainly would expect some larger scale convection patterns (Schwarzschild, 1975; Freytag et al., 2002) leading to concentrations of the magnetic fields. Like the magnetic network on the Sun, these concentrations will give rise to a connection between line shift and radiance, then resulting in the asymmetry of the integrated profile. Furthermore also those cool luminous stars can be expected to have closed magnetic structures in their low coronae and thus it is very probable that the transition region and low corona shows the persistent line shifts known very well for the Sun and other stars (Wood et al., 1997; Pagano et al., 2004). The net line shifts (of the narrow components) given by Dupree et al. (2005) for the cool luminous stars range from zero to 20 km/s to the red, which does not seem unrealistic considering values found on the Sun, where the distribution of redshifts in the quiet Sun transition region reaches up to at least 25 km/s (Fig. 9 of Peter, 1999a).
The conclusion from this is that there are at least two possible scenarios to understand the nature of the asymmetries of VUV lines from cool luminous stars. The hypothesis of Dupree et al. (2005) that opacity effects in the stellar wind lead to an absorption in the blue part of the line, and the suggestion put forward in this paper, that surface structures are responsible for the effect. Future modeling efforts on the distribution of structures in the atmospheres of cool luminous stars as well as modeling of the radiative transfer of the VUV lines through the stellar wind will be needed to distinguish between these two suggestions, or to favor even another idea, not yet thought of.
7 Discussion and Conclusions
This paper presents the first VUV spectrum of the Sun seen as a star of a transition region line with sufficient spectral resolution to allow a detailed comparison with stellar observations. To construct the full-Sun spectrum, a SUMER full-disk raster scan was used. Before summing up all the spectra, instrumental corrections have been applied, especially for the long-term wavelength drifts. Through this procedure we find an asymmetric full-Sun spectrum with enhanced emission in the wings of the line, which is very well fitted by a double Gaussian with a narrow and a broad component.
From the comparison of the full-Sun spectrum with average and high spatial resolution spectra from various locations on the solar disk we find that the broad component of the full-Sun spectrum is not a signature of the enhanced emission in the wings of high spatial resolution spectra, which are due to small scale reconnection flows or waves. In contrast, full-Sun broad components are indicative of the structure of the magnetic (chromospheric) network through the relation of intensity and Doppler shift of transition region emission lines. Therefore, unlike as proposed in previous stellar studies by e.g. Wood et al. (1997) or Pagano et al. (2004), the broad components of disk-integrated stellar spectra do not contain much information on the coronal heating mechanism, but rather provide valuable input on the structure of the magnetic network. This opens a new range opportunities for stellar studies.
The net redshifts of transition region lines of solar-like stars have been used as an indication of stellar activity, because we know from the Sun that active regions show much stronger redshifts than quiet areas (Achour et al., 1995; Teriaca et al., 1999). However, the redshift of the full-Sun profile of C iv was found to be lower by a factor of 4 to 6 when compared to data at disk center. Thus, at least for the Sun, the center-to-limb variation greatly reduces the line shift of the full-Sun spectrum. This is because the intensity increases towards the limb, while the line shift decreases (Peter, 1999a).
When comparing the Sun to Cen A, which shows a net redshift of almost 10 km/s while the full-Sun spectrum is only shifted by 1–2 km/s, there are basically two interpretations. Either Cen A has a comparable disk-center line shift but no center-to-limb variation, or Cen A has a considerably higher disk-center line shift than the Sun. As it is hard to imagine Cen A having no limb brightening in the optically thin transition region lines, the second interpretation is more plausible. As the broad components of Cen A and the full-Sun are comparable, according to the above discussion the two stars should have similar network structures. Thus we can expect Cen A to have much stronger redshifts above the magnetic concentrations of the chromospheric network, and therefore probably more magnetic flux concentrated in the magnetic network.
The comparison of the full-Sun spectrum to those of luminous cool stars reveals that the interpretation of the latter by Dupree et al. (2005) as being due to an opacity effect in the wind is not unique. While in the case of the Sun we can be sure that there is (almost) no opacity effect in the wind, the full-Sun spectrum shows the same properties as the luminous cool stars when the same techniques as used by Dupree et al. (2005) are applied.
These comparisons of the full-Sun VUV spectrum of C iv (1548 Å) show that full-Sun spectra in other lines are needed. The technique applied in this paper will work only for Ne viii (770 Å) and He i (584 Å), as SUMER acquired full-disk rasters with full spectral resolution in these lines only. To get profiles for a larger number of VUV emission lines, one would have to apply a different technique. The straylight analysis mentioned in the introduction, performed by Lemaire et al. (2004) and so far only applied to continuum data, is a good candidate.
Probably the most important result of this paper is to demonstrate the necessity of complex modeling of the stellar structures, as only this can provide us with the tools to investigate the similarities and differences of solar and stellar VUV spectra. This incorporates new simulations of solar and stellar coronae including the synthesis of VUV spectra as done by Peter et al. (2004), as well as new models of winds e.g. from cool luminous giants including radiative transfer through the wind in order to distinguish between surface structure effects and absorption in a dense wind.
Acknowledgements.
Sincere thanks are due to Klaus Wilhelm and Reiner Hammer for carefully reading the manuscript.References
- Achour et al. (1995) Achour, H., Brekke, P., Kjeldseth-Moe, O., & Maltby, P. 1995, ApJ, 453, 945
- Ayres et al. (1995) Ayres, T. R., Fleming, T. A., Simon, T., et al. 1995, ApJS, 96, 223
- Brandt et al. (1994) Brandt, J. C., Heap, S. R., Beaver, E. A., et al. 1994, PASP, 106, 890
- Brekke et al. (1997) Brekke, P., Hassler, D. M., & Wilhelm, K. 1997, Solar Phys., 175, 349
- Brinkman et al. (2000) Brinkman, A. C., Gunsing, C. J. T., Kaastra, J. S., et al. 2000, ApJ, 530, L111
- Brueckner & Bartoe (1983) Brueckner, G. E. & Bartoe, J. 1983, ApJ, 272, 329
- Brynildsen et al. (1996) Brynildsen, N., Kjeldseth Moe, O., & Maltby, P. 1996, ApJ, 462, 534
- Charbonneau (1995) Charbonneau, P. 1995, ApJS, 101, 309
- Curdt et al. (2001) Curdt, W., Brekke, P., Feldman, U., et al. 2001, A&A, 375, 591
- Curdt et al. (2004) Curdt, W., Landi, E., & Feldman, U. 2004, A&A, 427, 1045
- Dammasch et al. (1999) Dammasch, I. E., Wilhelm, K., Curdt, W., & Schühle, U. 1999, in Magnetic Fields and Solar Processes, ed. A. Wilson (ESA SP–448), 1165–1170
- den Herder et al. (2001) den Herder, J. W., Brinkman, A. C., Kahn, S. M., et al. 2001, A&A, 365, L7
- Dere & Mason (1993) Dere, K. P. & Mason, H. E. 1993, Solar Phys., 144, 217
- Doschek et al. (1976) Doschek, G. A., Feldman, U., & Bohlin, J. D. 1976, ApJ, 205, L177
- Dupree et al. (2005) Dupree, A. K., Lobel, A., Young, P. R., et al. 2005, ApJ, 622, 629
- Freytag et al. (2002) Freytag, B., Steffen, M., & Dorch, B. 2002, Astronomische Nachrichten, 323, 213
- Harrison et al. (1995) Harrison, R. A., Sawyer, E. C., Carter, M. K., et al. 1995, Solar Phys., 162, 233
- Innes et al. (1997) Innes, D. E., Inhester, B., Axford, W. I., & Wilhelm, K. 1997, Nature, 386, 811
- Judge et al. (2004) Judge, P. G., Saar, S. H., Carlsson, M., & Ayres, T. R. 2004, ApJ, 609, 392
- Kjeldseth Moe & Nicolas (1977) Kjeldseth Moe, O. & Nicolas, K. R. 1977, ApJ, 211, 579
- Lemaire et al. (2004) Lemaire, P., Gouttebroze, P., Vial, J., et al. 2004, A&A, 418, 737
- Linsky & Wood (1994) Linsky, J. L. & Wood, B. E. 1994, ApJ, 430, 342
- Mariska (1992) Mariska, J. T. 1992, The solar tansition region (Cambridge Univ. Press, Cambridge)
- Morel et al. (2000) Morel, P., Provost, J., Lebreton, Y., et al. 2000, A&A, 363, 675
- Moss et al. (2000) Moss, W., Cash, W. C., Cowieand, L. L., et al. 2000, ApJ, 538, L1
- Pagano et al. (2004) Pagano, I., Linsky, J. L., Valenti, J., & Duncan, D. K. 2004, A&A, 415, 331
- Peter (1999a) Peter, H. 1999a, ApJ, 516, 490
- Peter (1999b) —. 1999b, ApJ, 522, L77
- Peter (2000) —. 2000, A&A, 360, 761. Erratum: A&A 364, 933
- Peter (2001) —. 2001, A&A, 374, 1108
- Peter & Brković (2003) Peter, H. & Brković, A. 2003, A&A, 403, 287
- Peter et al. (2004) Peter, H., Gudiksen, B., & Nordlund, Å. 2004, ApJ, 617, L85
- Peter & Judge (1999) Peter, H. & Judge, P. G. 1999, ApJ, 522, 1148
- Rottman et al. (1993) Rottman, G. J., Woods, T., & Sparn, T. P. 1993, J. Geophys. Res., 98, 10667
- Rybák et al. (1999) Rybák, J., Curdt, W., Kučera, A., Schühle, U., & Wöhl, H. 1999, in Magnetic Fields and Solar Processes, ed. A. Wilson, ESA SP-448, 361–366
- Schwarzschild (1975) Schwarzschild, M. 1975, ApJ, 195, 137
- Teriaca et al. (1999) Teriaca, L., Banerjee, D., & Doyle, J. G. 1999, A&A, 349, 636
- Wilhelm et al. (1995) Wilhelm, K., Curdt, W., Marsch, E., et al. 1995, Solar Phys., 162, 189
- Wilhelm et al. (1997) Wilhelm, K., Lemaire, P., Curdt, W., et al. 1997, Solar Phys., 170, 75
- Wilhelm et al. (1998) Wilhelm, K., Lemaire, P., Dammasch, I. E., et al. 1998, A&A, 334, 685
- Wood et al. (1996) Wood, B. E., Harper, G. M., Linsky, J. L., & Dempsey, R. C. 1996, ApJ, 458, 761
- Wood et al. (1997) Wood, B. E., Linsky, J. L., & Ayres, T. R. 1997, ApJ, 478, 745
- Woodgate et al. (1980) Woodgate, B. E., Brandt, J. C., Kalet, M. W., et al. 1980, Solar Phys., 65, 73
- Woodgate et al. (1998) Woodgate, B. E., Kimble, R. A., Bowers, C. W., et al. 1998, PASP, 110, 1183
- Woods & Rottman (1990) Woods, T. N. & Rottman, G. J. 1990, J. Geophys. Res., 95, 6227