Halos of Spiral Galaxies. III. Metallicity Distributions11affiliation: Based on observations with the NASA/ESA Hubble Space Telescope, obtained at the Space Telescope Science Institute, which is operated by the Association of Universities for Research in Astronomy, Inc.,under NASA contract NAS 5-26555
Abstract
We report results of a campaign to image the stellar populations in the halos of highly inclined spiral galaxies, with the fields roughly 10 kpc (projected) from the nuclei. We use the F814W (I) and F606W (V) filters in the Wide Field Planetary Camera 2, on board the Hubble Space telescope.
We unambiguously resolve the stellar halos one to two magnitudes fainter than the tip of the red giant branch. Extended halo populations are detected in all galaxies. The color-magnitude diagrams appear to be completely dominated by giant-branch stars, with no evidence for the presence of young stellar populations in any of the fields.
The metallicity distribution function for the galaxy sample is derived from interpolation within an extensive grid of red giant branch loci. These loci are derived from theoretical sequences which are calibrated using the Galactic globular clusters, and also using empirical sequences for metal-rich stellar populations. We find that the metallicity distribution functions are dominated by metal-rich populations, with a tail extending toward the metal poor end. To first order, the overall shapes of the metallicity distribution functions are similar to what is predicted by simple, single-component model of chemical evolution with the effective yields increasing with galaxy luminosity. However, metallicity distributions significantly narrower than the simple model are observed for a few of the most luminous galaxies in the sample. The discrepancies are similar to those previously observed for NGC 5128, the halo of M 31, and the Galactic bulge.
Our observations may be used to help distinguish between models for the formation of spiral galaxies. It appears clear that more luminous spiral galaxies also have more metal-rich stellar halos. The increasingly significant departures from the closed-box model for the more luminous galaxies indicate that a parameter in addition to a single yield is required to describe chemical evolution. This parameter, which could be related to gas infall or outflow either in situ or in progenitor dwarf galaxies that later merge to form the stellar halo, tends to act to make the metallicity distributions narrower at high metallicity.
1 Introduction
The oldest stellar populations in galaxies offer clues to the earliest epochs of galaxy formation. The nature of halo stellar populations, detailed structures, and kinematics are clues to the understanding of how galaxies have assembled their mass. Much of what we know about such early populations comes from detailed studies of the stellar halo of the Milky Way. However, remarkably little is known about the stellar halos of other spiral galaxies, and their formation histories.
Based on the analysis of chemical, kinematic, and structural properties of the Galaxy halo stellar populations, two canonical scenarios of halo formation and evolution were proposed. The monolithic collapse scenario was proposed by Eggen, Lyden-Bell, & Sandage (1962), in which the stellar halo is formed by a rapid collapse of the proto-Galaxy, within a time on order of the dynamical timescale (yr). The second scenario was proposed by Searle & Zinn (1978) in which the halo is formed within a longer timescale (yr) by accretion of protogalactic fragments that underwent separate pre-enrichment. The recently identified streams in halos of different galaxies (the Galaxy: Yanny et al. 2000; M 31: Ibata et al. 2001; NGC 5128: Peng et al. 2002) give credence to the idea that halo populations are affected by infall/accretion of dwarfs (Ferguson et al. 2002).
However neither of these scenarios account qualitatively and quantitatively for the accumulated constraints on the properties of the Milky Way stellar halo, and both of them have several difficulties in explaining the observed properties of the Galaxy halo stars (Norris & Ryan 1991; Beers & Sommer-Larsen 1995; Chiba & Beers 2000); it is yet unclear which framework may describe accurately the formation and the evolution of the Galaxy halo. The failure of these models suggested hybrid scenarios. In those scenarios, the flattened distribution of stars at the inner part of the Milky Way results from dissipative collapse of large gas clouds similar to the Eggen et al. scenario, while the outer Galaxy spheroid region originates from dissipationless accretion of dwarf-like fragments (Freeman 1996; Carney et al. 1996).
The main conclusion drawn from the comparison between the Milky Way and M 31 (Durrell et al. 2001) halo star properties is that the Galaxy halo may not be typical: the halos of spiral galaxies seem to be quite diverse. The physical processes thay may regulate this diversity are still very unclear (see Bekki & Chiba 2001 for a discussion of this issue on the framework of Cold Dark Matter models).
A key quantity that helps disentangle the formation history of the stellar halo is the metallicity distribution function of galactic halo stars. For stellar populations older than about 1 Gyr, the location of red giant stars on the color-magnitude diagram is predominantly sensitive to metallicity rather than age, so a first-approximation metallicity distribution can be constructed through stellar photometry. This approach was extensively used, both from ground-based and Hubble Space Telescope (HST) deep photometry, to construct the metallicity distribution of nearby galaxies. Only a few galaxies beyond the Local Group have measured metallicity distributions, e.g. NGC 5128 (Harris & Harris 2002) and NGC 3379 (Gregg et al. 2004).
In this paper we report the results from the observations of resolved stars in halos of a sample of nearby spiral galaxies. The photometry is used to construct the metallicity distributions of halo stellar populations. The main aim here is to study the global properties of population II halos in normal spirals, to seek correlations between galactic properties and halo stellar populations and structures.
The layout of this paper is as follows: in § 2 we present our data set, in § 3 we present the methodology and the ingredients we used to construct the metallicity distribution, and present the properties of the observed halo fields, metallicity distributions, and discussions of our results. Finally, in § 5 the results of the present work are summarized, and their implications for the formation and evolution of galactic halos are discussed.
2 Data
2.1 Data reduction and Artificial star experiments
The galaxy selection criteria, observations and the reduction techniques applied to our sample of highly inclined spiral galaxies have been described in Mouhcine et al. (2004a). Here we recall briefly the reduction procedures. The galaxies were imaged with the F814W (I) and F606W (V) filters. The location of the observed fields that were not discussed in Mouhcine et al. (2004a) are shown in Fig.1. The observed fields are located so as to avoid contamination from the outer bulge and/or the disk, and to sample a pure halo stellar population. Exposure times through the F814W filter were set to reach a signal-to-noise of 5 in the WF camera for an absolute magnitude (for galaxies with ) or for more distant ones. The F606W exposure times were set to reach the same S/N at the same absolute magnitude for metal-poor RGB stars. The images were reduced using the standard HST pipeline, and employing the latest flatfield observations and using contemporaneous super-dark reference frames. The dithered frames were combined with iterative cosmic ray rejection using software in the stsdas.dither package based on the drizzle algorithm of Fruchter and Hook (2002). The stellar magnitudes were measured through circular apertures with a radius of . These aperture magnitudes were corrected to total magnitudes using TinyTim model (Krist 2004) point-spread functions. Aperture-corrections and zeropoints are applied separately for each CCD chip. The charge-transfer inefficiency has been corrected using the latest version of the Dolphin (2002) equations. The instrumental magnitudes were transformed to standard V and I magnitudes following the prescription of Holtzman et al. (1995). After correcting for the foreground extinction, we have estimated the magnitudes in the standard photometric system using the instrumental magnitudes and solving the equations relating the WFPC2-to-VI magnitudes using the coefficients tabulated by Holtzman et al. (1995).
As the focus of this paper is to derive the abundance distributions from a star-by-star analysis, sources of contamination and error must be understood and controlled. One of the factors that could influence the color width of the red giant branch, and thus affect the measurement of the stellar metallicities, are the photometric errors. The photometric errors may introduce a broadening of the red giant branch sequence that may be interpreted as indicative of a physical metallicity distribution function. Photometric incompleteness may mask the presence of extremely red stellar populations. In order to assess these effects, we carried out a large number of artificial star experiments, evaluating the photometric scatter and completeness as a function of magnitude. In each simulation, stars were added to the original images, with input colors and magnitudes following a narrow red giant branch sequence. The locations of stars in each frame were chosen randomly, so that over different experiments the added stars were uniformly distributed over the whole frame. The images were then reduced following the same procedure used for the original frames. Because the incompleteness varies as a function of I and (V-I) (and on the chip), we have mapped out the completeness using linear interpolation between the grid points sampled in the artificial star experiments. We have used this to assign to each star a completeness fraction. In practice, we compute the completeness in terms of the instrumental magnitudes and then translate them through the photometric calibration equations into the completeness in terms of standand magnitudes for each point in the color-magnitude diagram. The depth of the images vary from galaxy to galaxy, with completeness limits ranging from absolute magnitudes to . To assess the accuracy of our photometry, we calculate the difference between the input and recovered magnitude for each magnitude bin. The photometric errors at an absolute magnitude range from mag in the best case (NGC 55) to mag in the worst case (NGC 4258).
For the purpose of deriving the metallicity distribution for stellar halos, the completeness effects may be large for extremely red and bright giant stars at the upper right corner of a color-magnitude diagram near the completeness cutoff determined by the V-filter; those stars are likely to have solar or super-solar abundances. For nearly all sample galaxies, apart from NGC 4258, the completeness limit falls well below the brightest end of the red giant branch. In our analysis of the metallicity distribution, we include the effects of incompleteness as far as the data allow. Contamination by foreground Galactic stars may be important, especially for the NGC 4945 halo field because of its low Galactic latitude and the deep photometry. To estimate Galactic foreground contamination, we used the Besançon group model of stellar population synthesis of the Galaxy available through the Web111http://bison.obs-besancon.fr/modele/ (Robin et al. 2003), simulating the total number and optical photometry of foreground stars. We found that Galactic field star contamination contributes only at the maximum, in the case of NGC 4945, within the magnitude ranges used to construct the metallicity distribution functions and . A few faint background galaxies may have misclassified as stars. An upper limit to the contamination can be estimated from the Hubble Deep Fields (catalogs described in Casertano et al., 2000), which have the same area as the fields we have observed. In the HDF-N we find 10 sources with and arcsec. In the HDF-S there are 22 such sources. Some of these are galactic foreground stars. Thus the level of compact-source contamination is entirely negligible.
2.2 Distances and Reddening
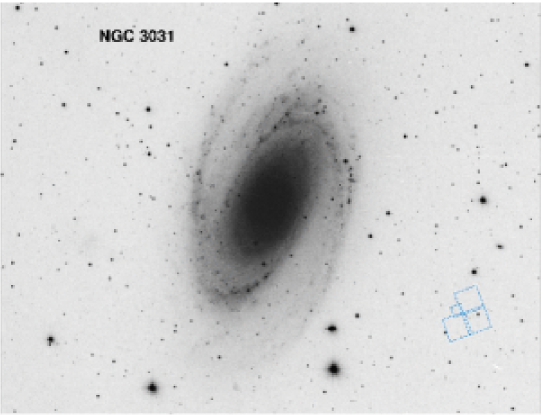
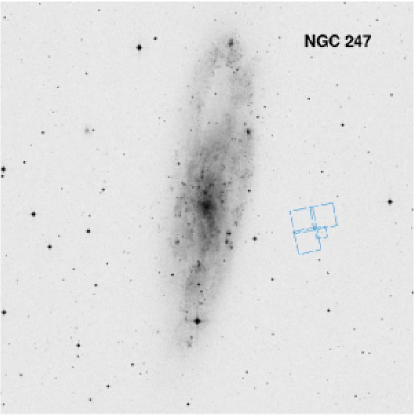
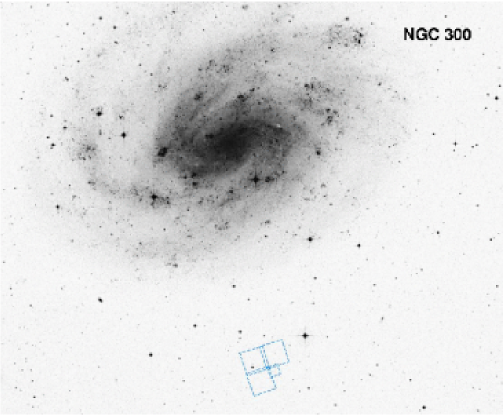
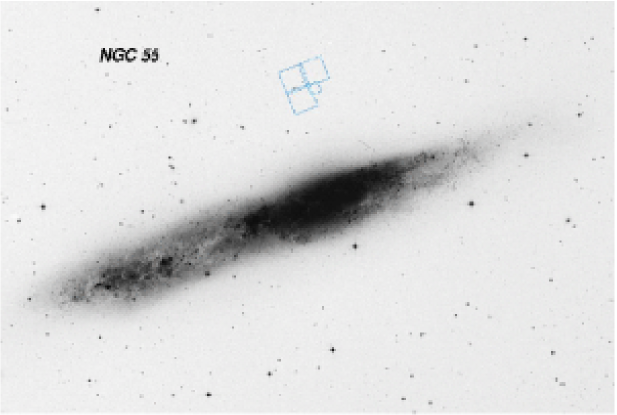
The morphological type, disk inclination, integrated magnitude, foreground extinction, and true distance modulus of each galaxy in the sample are listed in Table 1. Extinction- and inclination-corrected V-band magnitudes come from RC3. No significant internal extinction is expected to affect the halo stellar populations, as halo regions are most likely dust free. The reddening toward the halo fields was estimated using the all-sky map of Schlegel et al. (1998). We adopt the relations and for the used HST filters. We have neglected the effect of any possible differential reddening across our fields and along the line of sight. Indeed, the differential reddening due to the Galactic foreground across the WFPC2 fields is likely to be small. The locations of the observed halo field are shown Fig.1, on the Digitized Sky Survey image of the galaxies that were not discussed in paper I, i.e., NGC 55, NGC 247, NC 300, and NGC 3031.
As demonstrated extensively in the literature, the tip of the red giant branch is a useful distance indicator (Lee et al. 1993). The I-band luminosity function can be used to identify the magnitude level of the tip of the red giant branch, and thus the distance modulus to our sample galaxies. Mouhcine et al. (2004a) have used both the edge-detection algorithm and the maximum likelihood analysis to estimate the tip of the red giant branch magnitude for four galaxies in our sample, i.e., NGC 253, NGC 4244, NGC 4258, and NGC 4945 (see Mouhcine et al. 2004a for detailed discussion). For the other four galaxies in our sample, i.e. NGC 55, NGC 247, NGC 300, and NGC 3031, the numbers of stars at the bright end of the red giant branch sequences are too small. Consequently, it is difficult to locate reliably the discontinuities in red giant star luminosity functions, and then to measure accurately the distance modulus to those galaxies (Madore & Freedman 1995). For those galaxies, we rely on published distances. NGC3031 (M 81, is a Sb galaxy with similar properties to M 31, with an inclination of ; it is the nearest bright galaxy with both a dynamically known black hole and nuclear activity (Ho, Filippenko, & Sargent 1996). The association of galaxies around M 81, i.e., M 82 (NGC 3034), NGC 3077, and various dwarf spheroidal and irregular galaxies, is one of the nearest prominent groups in the vicinity of the Local Group. NGC 3031 has been observed as a part of the HST Key project (Freedman et al. 1994). Ferrarese et al. (2000) published a Cepheid-based distance modulus to NGC 3031 of . The other three galaxies are all members of the Sculptor group. Graham (1982) suggest that this small group is significantly extended along the line of sight, and a range of in may be expected. NGC 300 is an SA(s)d galaxy, with an inclination of . Freedman et al. (2001) have published a Cepheid-based distance of Mpc (). NGC 55 is an Sc galaxy that is almost edge-on, with an inclination of . The distance to NGC 55 is poorly known. Puche & Carignan (1988) have compiled different distance measurements to the galaxy, with a mean distance modulus of . Using the I-band luminosity function of the carbon star population in the galaxy from Pritchet et al. (1987), the calibrated mean absolute I-band magnitude of carbon stars from Richer (1981), and using the long distance scale to the Large Magellanic Clouds, the distance modulus to NGC 55 of (see Richer et al. 1985 for a discussion of empirical evidence for using carbon stars as a distance indicator and Mouhcine & Lançon 2003 for a theoretical discussion of the issue). This is consistent with Graham’s conclusion that NGC 55 lies in front of NGC 253 (Graham 1982). However, the Pritchet et al. (1987) survey of carbon stars in the galaxy suffers from a severe incompleteness. In our analysis, we will use the distance modulus from Puche & Carignan (1988). It is worth mentioning that the uncertainties in the distance modulus to NGC 55 have little effect on the analysis presented later in the paper. NGC 247 is an Sc(s)III-IV galaxy, almost edge-on galaxy (with an inclination of ). NGC 247 has the most uncertain distance modulus estimate. Davidge & Courteau (2002) have used the Tully-Fisher relation, as calibrated by Sakai et al. (2000), with published integrated photometry and line widths from Pierce & Tully (1992), to derive a galaxy distance modulus of . The derived distance is consistent with NGC 247 being a member of the Sculptor group at its far side, and with its location on the sky close to NGC 253.
3 Analysis
3.1 Color-magnitude diagrams
Fig. 2 and Fig. 3 shows the reddening-corrected and distance-corrected color-magnitude diagrams of the sample galaxies. The most prominent features are the well-populated red giant branches. The color-magnitude diagram contains no indication of significant young or intermediate-age stellar populations in the halos of these spiral galaxies. There are few stars in the region where one may expect to see early-type stars; in addition, above the first-ascent giant stars there is a negligible number of stars that may identified as bright asymptotic giant branch stars, associated with intermediate age populations. A firm conclusion about the presence or lack of an intermediate age population would require much deeper photometry, as shown recently by Brown et al. (2003) for the halo of M31.
As a first indication of the range of metallicities across the red giant branch, we have overplotted the loci of the observed red giant branch sequences for standard Milky Way globular clusters of different metallicities which encompass the majority of RGB stars for each galaxy. These lines are for the observed red giant branch sequences of M 15 ([Fe/H]=-2.2), M 2 ([Fe/H]=-1.6), NGC 1851 ([Fe/H]=-1.3), and 47 Tuc ([Fe/H]=-0.71) from Da Costa & Armandroff (1990), the metal-rich bulge globular cluster NGC 6553 ([Fe/H]=-0.25) from Segar et al. (1999), and the old disk open cluster NGC 6791 ([Fe/H]=0.2) from Garnavich et al. (1994). While we cannot rule out an age spread in these galaxies, the color spread observed in the data is due primarily to a spread in metallicity. Theoretical isochrones show that metallicity has a much larger effect than age on RGB color. For example, at on the red giant branch, a 0.2 mag shift in to the blue can be achieved by a relatively large decrease in age from 13 to 6 Gyr or a relatively small decrease in [Fe/H] from to . In the analysis to follow we shall assume that halo stellar populations have a fixed globular cluster-like age. Mean metallicities will be slightly higher if the ages are lower. ¿From the comparison in Fig. 2 and Fig. 3, it is clear that all spiral halos contain a metal-poor stellar component extending down to , however only bright galaxies, i.e., , tend to have a stellar component that extends to high metallicities, even higher than the metallicity of the most metal-rich halo globular cluster 47 Tuc. With the HST, the efforts of investigating stellar halo properties have extended beyond the Local Group to include the Cen A group (e.g., Harris et al. 1999) and the giant elliptical NGC 3379 in the Leo I Group (Gregg et al. 2004). The color-magnitude diagrams of the halo of spiral galaxies show that the overall color-magnitude diagram morphologies of the halo stellar populations are similar, showing the same old red giant branch population that ends abruptly at the tip of the sequence.
The morphology of the color-magnitude diagrams demonstrates that the stellar populations in the halos of spiral galaxies are diverse, and can range from a very low metallicity of dex up to supra-Solar. The color-magnitude diagrams of NGC 4258, NGC 253, and NGC 4945 show a large color span and are similar to the color-magnitude diagrams of the halo of M 31 (Durrell et al. 2001, 2004) and NGC 5128 (Harris & Harris 2000, 2002). NGC 3031 and NGC 4244 show a mixture of low-to-intermediate metallicities, and have similar morphologies to the color-magnitude diagram of the outer regions M 33 (e.g., Tiede et al. 2004). The location of the color-magnitude diagram blue edge is similar to what is observed for the three bright galaxies, suggesting that their original halo gas started at similar chemical compositions, but they have undergone slower chemical enrichment which has reached a smaller metallicity spread. The faintest galaxies in our sample—NGC 55, NGC 247, and NGC 300— are composed mainly of metal-poor stars, and are similar to the dwarf spheroidal M 81-BK5N in the M 81 group (Caldwell et al. 1998).
3.2 Metallicity distribution functions
3.2.1 Calibration of metallicity measurements
To derive the metallicity distribution function for the galaxy sample, we convert the observed stellar photometry to metallicity on a star-by-star basis. To do so, we superimpose a fiducial grid of RGB tracks on the color-magnitude diagrams, and interpolate between them to derive an estimate of a star’s metallicity (e.g., Holland et al. 1996; Harris et al. 1999). Such a procedure stands implicitly on the assumption that all of the halo stellar population has a uniformly globular cluster-like age. The shape of the metallicity distribution will change only slightly if the age distribution is narrow. The random errors in the color measurements are significantly smaller than the observed color spread at the bright red giant branch end, used to derive the metallicity distribution function.
A bias may be caused by the presence of early-asymptotic giant branch stars (E-AGB), which run almost parallel to the red giant branch with bluer colors, and hence may be misclassified as stars on the red giant evolutionary phase. The inclusion of these stars may bias the metallicity distribution function toward an excess of metal-poor stars. However, Padova group stellar evolutionary models (e.g., Fagotto et al. 1994) indicate that the lifetime ratio of E-AGB phase to RGB phase, directly related to the number ratio of E-AGB stars to RGB stars, is 15–20%, suggesting that the bias exerted by E-AGB stars should not be severe (see also Harris et al. 1999 and Durrell et al. 2001). Note that a fraction of metal-poor E-AGB stars are rejected from the sample of stars used to build the metallicity distributions as they are bluer than the colors of the most metal-poor track in the grid. Another bias source is the possibility of ages considerably younger than globular clusters. Brown et al. (2003) have shown that the halo of M 31 contains a significant intermediate-age, metal-rich stellar population, as well as the classical globular cluster age-like metal-poor stellar population. Lacking information about the age distribution of stars in our sample, we shall simply assume that they are all old and of uniform age. While we do not relax this assumption in this paper, it is worth noting here that a fairly plausible age distribution, wherein metal-rich stars are significantly younger than metal poor stars, will tend to reduce the color spread in the RGB. We shall return to this point in § 3.2.2.
To generate the metallicity distribution of halo stars we prefer using theoretical red giant branch sequences over empirical cluster fiducials. Even with the remaining uncertainties, such as the effect of convection on the evolution of RGB stars, or the temperature scale of giant stars, the state of the theoretical modeling of giant stars should be accurate enough to achieve the goal we seek. Harris & Harris (2000) have shown that the coarness of the observed cluster fiducial grid may cause artifacts in the metallicity distribution function that disappear once a densely spaced grid in metallicity is used. We use VandenBerg et al. models (2000) of red giant tracks for stars and covering the abundance range from to , approximately in steps of 0.1 dex. All the models we used assume that the stars are enhanced, i.e., [/Fe]=0.3, to take account of recent results on the abundance analysis of Galactic halo stars (McWilliam 1997, Gratton et al. 2000), and in the globular cluster of nearby early-type galaxies (Larsen et al. 2002). The metallicity is defined as . The grid has been compared and well calibrated against the observed loci of standard globular cluster fiducial sequences (Bergbusch & VandenBerg 2001; Harris & Harris 2000). We attempted to use the semi-empirical red giant grid constructed by Saviane et al. (2000), but realized that the metallicity range covered by this grid is not sufficient to cover the range of stars observed in halos of some galaxies in our sample. Note there is good agreement between the Saviane et al. (2000) calibration and the grid we are using, over the metallicity range common to both red giant sets.
For bright galaxies in the sample, a number of halo stars are located beyond the most metal-rich track of the theoretical grid, suggesting the presence of metal-rich stellar populations in the halo of these galaxies. To cover these stars, and as the theoretical stellar evolutionary tracks of super-solar metallicity stars are still of poor quality, we add to this grid the observed red giant branch fiducial of the old metal-rich disk open cluster NGC 6791. The metallicity of the cluster is thought to lie in the range (Taylor 2001, and reference therein), with no element enhancement (Peterson & Green 1998, Chaboyer et al. 1999). The estimate of the metal-rich end of the metallicity distribution function suffers from both the poor knowledge of the metal-rich star evolutionary patterns, and from the photometric incompleteness affecting preferentially the regions in the color-magnitude diagrams where these stars are located. The calibration of the grid at the metal-rich end is the most uncertain part of the analysis of our data set.
To evaluate the stellar metallicities, we proceed as follows. For each observed stellar distance- and reddening-corrected I-band magnitude, we construct a relationship between the color (V-I)o of fiducial tracks at this magnitude, and their metallicities [M/H], then we fit a non-linear function to the relationship, we use the fit to the relationship between (V-I)o and [M/H] to convert the observed reddening-corrected stellar color to a metal abundance. This was repeated for all stars in the color-magnitude diagrams lying in the magnitude ranges used to derive the metallicity distributions. Similar procedures were used in the literature (e.g., Holland et al. 1996; Grillmair et al. 1996; Harris & Harris 2000).
In the brightest magnitude of the RGB, the V band blanketing causes the V, I distribution of the metal-rich stars turn over, making the interpolation procedure rather uncertain. On the other hand, the faint end of the red giant branch is affected by large photometric errors, and will scatter more stars to bluer color, which may bias the resultant metallicity distribution to be more metal poor. To construct the metallicity distribution function, we therefore decided to avoid both the bright and the faint end of the observed red giant sequence, and restrict our analysis to stars in the magnitude range that minimize the effects of both the photometric errors, incompleteness, and the evolutionary track curvature. The magnitude ranges used to estimate the metallicity distribution function for each galaxy are indicated in the panels of Fig. 4 and Fig. 5. To overcome the problem of track curvature at the high metallicity end, Harris & Harris (2000, 2002) and Durrell et al. (2001) have followed similar procedures, but interpolated in the plane. In principle, using stellar magnitudes, colors, and bolometric corrections, the bolometric magnitude can be estimated. However, the bolometric corrections depend on the stellar metallicity, and this is exactly what one is looking for. This circularity affects the self-consistency of such an approach. Our procedure is valid as long as stars are within the evolutionary RGB track grid, but we decided to include stars that are one bluer, at a given reddening-corrected I-band magnitude, than the lowest metallicity track, as well as for stars redder than the highest metallicity fiducial track.
3.2.2 Results for the metallicity distribution function
The resultant incompleteness-corrected metallicity distribution functions for all galaxies in our sample are shown in Fig. 4 and Fig. 5, and listed in Table 2. An optimal distribution bin width was estimated on a case-by-case basis according to the halo star sample size and the distribution’s skewness, using the method of Scott (1992). To account for the effects of incompleteness, we count each star as the inverse of the photometric completeness at the location of the star on the color-magnitude diagram. Measurement errors are readily computed, and error bars are shown. Each panel shows the magnitude range used to estimate the metallicity distribution function for each galaxy in the sample. The magnitude intervals have been chosen to minimize the effects of both the photometric errors and the incompleteness. In the second paper of this series, we have derived the mean metallicities of halo stars using the relationship between the mean colors of the red giant branch stars at a luminosity of and stellar abundances as calibrated by Lee et al. (1993). The last column of Table 1 lists these mean stellar metallicities. The mean metallicities of halo stars could also be derived from the metallicity distribution functions. In principle, these two mean stellar metallicities should be similar. Fig. 6 shows a comparison between the two mean stellar metallicities. The mean metallicities of halo stars of faint galaxies, i.e., , agree well with the derived mean metallicities of halo stars using the color of red giant branch stars at . However, a systematic difference at the of 0.2–0.4 dex level is found between the two mean metallicities of halo stars for bright galaxies, i.e., . The peaks of the metallicity distribution functions of bright galaxies tend to be more metal-poor than the mean metallicities derived using the [Fe/H] vs. relationship of Lee et al. (1993).
To calibrate the model grid of VandenBerg et al. (2000) used to derive the metallicity distribution functions, Harris & Harris (2000) have compared the well known metallicities of the fiducial Milky Way globular clusters to the metallicities derived from ranning their red giant branch sequences through the interpolation algorithm (see § 3.2.1). At both low- and high-metallicity ends, they found a satisfactory agreement between the metallicities derived from the interpolation within the VandenBerg et al. (2000) model grid and the literature metallicities. However, at intermediate metallicities, i.e., , the agreement is poorer. The estimated metallicity of the Milky Way globular cluster 47 Tuc from the interpolation within the model grid is lower than the literature value by dex, on the order of the observed systematic difference between halo star mean metallicities from the metallicity distribution functions and those from the red giant branch star colors at a luminosity of (that we repored in paper II). The mean colors of the observed red giant branchs of bright galaxies in our sample agree well with the red giant branch sequence of 47 Tuc as shown in Fig.2. Thus, the shift between the two mean metallicities of bright galaxy halo stars is due to the fact that the VandenBerg et al. (2000) models predict a redder red giant branch sequence than the observed one at the 47 Tuc metallicity. Thus, if metal rich stars () are present, the mean stellar halo metallicities derived from the colors of red giant branch stars at a luminosity of may be a bit more reliable than these derived from the mean of the metallicity distribution functions.
Inspecting the metallicity distribution functions, a number of common features emerge. The overall shape for all metallicity distribution functions is similar; they are characterized by prominent peaks at the metal-rich end with extended metal-poor tails. The figures show that the position of the dominant peak is a function of the parent galaxy luminosity: the brighter the galaxy, the higher the metallicity of the prominent peak of the halo metallicity distribution function. The I-band magnitude range selected to construct the metallicity distribution functions of NGC 253 and NGC 4945 stellar halos should allow us to detect stars with metallicities up to solar. If super-solar stars are present in the halos of these galaxies, we might be missing them. The sharp cut-off of the metallicity distribution function at the high metallicity end appears to be real, instead of an effect of the photometric incompleteness or another observational artifact. The evolutionary tracks with metallicities in the range are above the magnitude range where the incompleteness starts to be severe. The only galaxy for which the sharp cut-off of the metallicity distribution function at the high metallicity end could be due to observational effects is NGC 4258. The metal-rich end of the metallicity distribution function of this galaxy is suspected to be incomplete, i.e., a fraction of metal-rich stars are missing. For this galaxy, the photometry does not probe the red giant branch far, and the 50% completeness level limit falls close to the brightest end of the RGB sequence. We have limited ourselves to a range of I-band magnitudes where the completeness level is not severely low. However, stars with metallicities higher than lie at fainter magnitudes than the magnitude range chosen to construct the metallicity distribution function of NGC 4258 halo stars. If the halo of this galaxy contains metal-rich stars, we might be missing a fraction of them.
Similar features are seen for the metallicity distribution functions of both M 31 (Durrell et al. 2001, 2004) and NGC 5128 (Harris & Harris 2000), i.e., prominent metal-rich peak, metal-poor tail, and a sharp metal-rich end. The metallicity distribution function of the Galaxy stellar halo is distinct from those of our galaxy sample and from M 31 and NGC 5128, suggesting again that the halo of the Galaxy is not typical for a luminous (spiral) galaxy (see also Mouhcine et al. 2004b).
The most straightforward models of stellar population enrichment considers the closed box evolution of a homogeneous proto-galactic gas cloud having initial abundance . As time advances, the gas is consumed to form stars, and more massive stars, that evolve rapidly, return a fraction of their mass, enriched in metals due to the nucleosynthesis, to the gas cloud. The instantaneous recycling approximation neglects the lifetime of stars that contribute to the chemical enrichment compared to any timescale of the system, and assumes complete and homogeneous ejecta mixing (Searle & Sargent 1972; Pagel & Patchett 1975). The simple model assumes that no infall and/or outflow of metals has occured during the star forming phase of the system. The stellar yield, defined as the ratio of the mass of new metals ejected to the mass locked into long-lived stars and remnants, parametrizes the model. Under these assumptions, the stellar metallicity distribution follows the simple law:
| (1) |
where is the stellar yield. The yield and the mean abundance are related via: , where is the initial metallicity. Hence, the yield is the average metallicity of the stars in a one-zone system following the exhaustion of the gas (Hartwick 1976). If metals are lost from the system by gas outflow, assuming that the gas loss rate is proportional to the star formation rate, the functional form of the metallicity distribution is unchanged, but the true yield is reduced to the effective yield , where is a parameter related to the gas loss rate (for a detailed discussion, see Binney & Merrifield 1998). The only two free parameters of the model are the mean metallicity of the stellar population and the initial abundance of the protogalactic gas. In the following, we will assume that the initial star formation event has consumed a primordial heavy element-free gas, i.e., . The agreement between the observed galaxy luminosity-stellar halo metallicity and the expected scaling from Dekel & Silk (1986), where the chemical evolution of the protogalaxy is approximated by this simple model, suggests that it may also provide a convenient approximation of the metallicity distribution of halo stars (see Mouhcine et al. 2004b).
Fig. 4 and Fig. 5 show the simple chemical model predictions, with the choice of the effective yield as indicated in each panel, overplotted on top of the observed metallicity distribution function. The photometric uncertainties for the stars considered here are small (see Fig. 2 and Fig. 3), and the models have not been smoothed. Fig. 7 and Fig. 8 show the same models and the same data on a linear metallicity scale. As the simple chemical model satisfies the requirement of a probability distribution, the model predictions are scaled by the area under the data histogram, so that the area covered by the data and fits are identical. It is has to be mentioned that by comparing the observed metallicity distribution to the simple chemical model predictions, we implicitly assume that galaxies are built up within a single potential well.
The figures show that the simple chemical models grossly reproduce the general shape of the estimated metallicity distribution function. The number of observed stars at the low metallicity end continues to rise as the metallicity decreases as required by the model. The effective yields needed to reproduce the metallicity distribution functions are a function of the parent galaxy luminosity. The effective yield values needed to get an agreement with the observed metallicity distribution of bright galaxies are similar to those needed to fit the metallicity distribution functions of the M 31 halo (Durrell et al. 2001), and NGC 5128 (Harris & Harris 2000), but much larger than the best value for the Galaxy halo.
Despite the success of the simple chemical model to reproduce, in broad terms, the metallicity distributions, there are, however, noticeable deviations, especially when bright galaxies are considered. The simple model predicts that the subsolar regime () is more populated than what is observed, deviating from the exponential-decay condition. On the other hand, the number of stars in the intermediate metallicity regime (), is underestimated by the simple chemical evolution models. Quite striking is that the observed metallicity distribution is significantly narrower than the simple chemical model predictions. At near-solar metallicity, a star excess is predicted, and a sharp cut-off is generally missed by the models. As discussed above, this sharp cut-off is real; it may be even sharper given that any observational bias can only smooth out, and then broaden, any sharp feature in the metallicity distribution. This relative lack of metal poor stars is evident for the halo of M31, where it is possible to reach fainter than the horizontal branch. The metal poor fraction, as evidenced by the fraction of blue HB stars, is (Bellazini et al. 2003)
4 Interpretation: implication for galaxy formation
What kind of stellar halo formation scenario can account for the new observations? A key element to understanding the formation of stellar halos can be found in the shape of their MDFs. The stellar halos of bright galaxies are dominated by a metal-rich stellar population. This implies that those galaxies underwent a large amount of chemical enrichement before the stellar halos were assembled, or that the halos were assembled from metal-rich satellites. Hierarchical models of galaxy formation provide a reasonable picture of galaxy evolution. Côté et al. (2000) have discussed a model for the formation of a galactic spheroid, where it is assembled by dissipationless accretion of isolated, chemically distinct, small and metal-poor protogalactic fragments. These models are able to reproduce the metallicity distributions of both diffuse halo stars and halo globular cluster systems in both the Galaxy and M 31 provided that the luminosity function of protogalactic fragments that were accreted to form the halo of M 31 is flatter than what is needed to reproduce the Galaxy halo metallicity distributions. Despite its success in accounting for the overall shape of the MDFs of M 31 and Milky Way stellar halos, this model has difficulties accounting for the large excess of stars at , i.e., the peak of the metallicity distribution (see also Durrell et al. 2001). These stars are too metal-rich to be formed in a shallow potential well, i.e., in a low-mass protogalactic fragment. The comparison between the observed stellar halo MDFs and those of dwarf galaxies, i.e., NGC 147 and BK 5N in the M 81 group as given in Harris & Harris (2000), show clearly that stellar halos contain a rather small number of metal-poor stars that dominate dwarf galaxies. This suggests that the stellar halos of spiral galaxies, at least the bright ones, have not been predominantly assembled from the disruption of metal-poor dwarf satellite galaxies similar to ones observed in the Local Group and M 81 galaxy group. The differences of chemical abundance ratios between Galaxy halo stars and those of Local Group dwarf spheroidal galaxy stars seems to indicate that this may be also the case for the Milky Way stellar halo (Shetrone et al. 2003; Tolstoy et al. 2003). Harris & Harris (2001) have shown that NGC 5128 stellar halo MDF is statistically indistinguishable from the MDF of the Large Magellanic Cloud (LMC) outer disk stars constructed using a sample of giant stars from Cole et al.(2000). The observed metallicity distributions of bright galaxy stellar halos share similarities with the metallicity distributions of both the inner region of the faint compact elliptical galaxy M 32 (Grillmair et al. 1996) and the LMC outer disk stars (Cole et al. 2000), i.e., small number of metal-poor stars, and the predominance of stars. These similarities suggest that at least a fraction of halo stars originates from the disruption of LMC-like galaxies. This is in agreement with the suggestion of Ibata et al. (2001) and Harris & Harris (2001) that the bulk of the halos of M 31 and NGC 5128 may have formed from a single event, such as the disruption of similar metal-rich stellar systems. Yet another possibility is that the stars formed from gas which was pre-enriched by the formation of the spheroid. The high metallicity is suggestive of gas originating in violent starburst that may be connected with the formaton of the bulge.
The sharp high-metallicity cutoff of the metallicity distribution, in comparison to the predictions of simple chemical evolution model, suggests that the star formation did not proceed to exhaust entirely the gas reservoir. If spiral stellar halos formed in a rapid and violent star-forming event, one may expect that a fraction of the heavy elements, produced by supernovae, are lost by means of metal-rich galactic winds before the metal-rich gas was exhausted by star formation. Another possible way to produce the apparent pronounced peak in the metallicity distribution functions may be the presence of a large age spread for halo stellar populations. If metal-rich halo populations are significantly younger than halo metal-poor populations, metal-rich RGB stars will be bluer than they would be if they were old. Thus, their metallicity will be systematically underestimated if the metallicity distribution functions are constructed following the assumption that halo field stars are uniformely old. Deep observations of the M 31 stellar halo indicate the presence of an age spread larger than few Gyr (Brown et al. 2003). Unfortunately, no constraints are available on the age distributions of halo stellar populations for other galaxies. Deep and wide field observations of stellar halos are needed to get insight into the age distribution of halo stellar populations over a significant fraction of the halo.
The paucity of metal-poor stars compared to the simple chemical model predictions may flag the presence of a G-dwarf like problem, similar to what is observed for the Galactic disk (Tinsley 1980), and also possibly in the bulge (Zoccali et al. 2003). Investigations of integrated light properties show that the G-problem is present in early type galaxies (Greggio 1997). It is intriguing to see that stellar systems with different histories are sharing the same problem, the reason for which is not fully understood. For galactic stellar halos, pre-enrichment of the gas from which halo stars form can be invoked to explain the moderate number of metal-poor stars compared to the simple chemical model predictions. The closed-box chemical evolution model stands on the assumption that the gas mass is assembled entirely before the star formation starts, i.e., no outflow or inflow. It is well established that the G-dwarf problem is eliminated if the baryonic matter assembly is assued to be gradual (Pagel 1997). This suggests that stars which end up in the halo of spiral galaxies were formed gradually within their formation site(s).
5 Summary & Conclusions
We have presented the results from a study of the stellar populations within the halos of spiral galaxies. The main goal of our study is to investigate the properties of spiral halos, and to deepen our understanding of the physical processes that govern their formation, and to shed light on the buildup of galaxies over the cosmic time.
We have used WFPC2 to image in the F606W () and F814W () filters halo fields in a sample of eight nearby highly inclined galaxies, to construct the color-magnitude diagram for the halo diffuse stellar populations in spiral galaxies. The observations were designed in a way that the resultant color-magnitude diagrams are complete to at least a magnitude below the tip of the red giant branch. Such depth secures the usage of the red giant branch stars to investigate the properties of stellar halos. With this galaxy sample and data quality, it is possible to begin addressing systematically questions regarding the correlations between the properties of spiral halo field stellar populations and spiral galaxy properties.
We have found that the halo color-magnitude diagrams are morphologically dominated by old red giant branch stars, with no significant number of halo stars brighter than the classic old tip of the red giant branch. This is consistent with the conventional interpretation of galaxy halos being composed primarily by an homogeneous, old stellar population. However, the color range spanned by giant stars is sensitive to the parent galaxy luminosity. The stellar halos of bright galaxies contain red giant branch stars with redder colors than faint galaxies.
A finely spaced grid of theoretical evolutionary tracks together with an empirical red giant branch of a Galactic metal-rich cluster of a known metallicity, was used to convert the color-magnitude diagrams of the halo stellar populations into photometric metallicity distributions. The distributions of stellar metallicities are found to show a broad peak at the metal-rich end, with low metallicity tails extending to , with a fairly sharp edge at the high-metallicity end. The metallicity of the metal-rich peaks depend on the parent galaxy luminosity. The halo stellar populations are dominated by moderately high-metallicites, i.e., . This suggests that stellar halos are more likely to be formed by the disruption of intermediate mass galaxies, i.e., similar to M 32 and LMC, rather than the accretion of metal-poor dwarf satellite galaxies. The simple chemical model does match the metallicity distribution to first order, with the effective yields best matching the observed distributions increasing with the galaxy luminosity. The analysis of the departures of observed metallicity distributions from the predictions of the simple chemical models indicates that the halo may have built up gradually from a pre-enriched gas.
A high priority for future work should be the extension of this type of analysis to other spiral galaxies, targeting a variety of morphological types, disc and bulge properties, and position on the Hubble sequence. This will more fully reveal the variation and trends in halo properties, and to what extent the halo of the Milky Way is unique.
References
- (1) Beers, T.C, & Sommer-Larsen, J., 1995, ApJS, 96, 175
- (2) Bekki, K., Chiba, M., 2001, ApJ, 558, 666
- (3) Bellazzini, M., Cacciari, C., Federici, L., FuciPecci, F., Rich, M.R., 2003, A&A, 405, 867
- (4) Bergbusch, P.A., & VandenBerg D.A., 2001, ApJ, 556, 322
- (5) Binney, J., & Merrifiled, M., 1998, Galactic Astronomy (Princeton: Princeton Univ. Press)
- (6) Brown, T.M., Ferguson, H.C., Smith E., et al., 2003, ApJ, 592, L17
- (7) Carney, B.W, Laird, J.B., Latham, D.W., Aguilar, L.A., 1996, AJ, 112, 668
- (8) Casertano, S., et al., 2000, 2000, AJ, 120, 2747
- (9) Chaboyer, B., Green, E.M., Liebert, J., 1999, AJ, 117, 1360
- (10) Chiba, M., & Beers, T.C., 2000, AJ, 119, 2843
- (11) Caldwell, N., Armandroff, T.E., Da Costa, G.S., Seitzer, P., 1998, AJ, 115, 535
- (12) Cohen, J.G., Gratton, R.G., Behr, B.B., & Carretta, E., 1999, ApJ, 523, 739
- (13) Cole, A.A., Smecker-Hane, T.A., Gallagher, J.S., 2000, AJ, 120, 1808
- (14) Côté, P., Marzke, R.O., West, M.J., Minniti, D., 2000, AJ, 533, 869
- (15) Da Costa, G.S., & Armandroff, T.E., 1990, AJ, 100, 162
- (16) Davidge, T.J., & Courteau, S., 2002, AJ, 123, 1438
- (17) Dekel, A., & Silk, J., 1986, ApJ, 303, 39
- (18) Durrell, P.R., Harris, W.E., & Pritchet, C.J., 2001, AJ, 121, 2557
- (19) Durrell, P.R., Harris, W.E., & Pritchet, C.J., 2004, AJ, 128, 260
- (20) Eggen, O., Lynden-Bell, D., & Sandage A., 1962, ApJ, 136, 748
- (21) Fagotto, F., Bressan, A., Bertelli, G., & Chiosi, C., 1994, A&AS, 104, 365
- (22) Ferguson, A.M.N., Irwin M.J., Ibata, R.A., Lewis, G., & Tanvir, N., 2002, AJ, 124, 1452
- (23) Ferrarese, L., et al., 2000, ApJS, 128, 431
- (24) Fleming, D.E.B., Harris, W.E., Pritchet, C.J., & Hanes, D.A., 1995, AJ, 109, 1044
- (25) Freedman W.L., et al. 1994, ApJ, 427, 628
- (26) Freedman W.L., et al. 2001, ApJ, 553, 47
- (27) Freeman, K.C., 1996, in ASP Conf. Ser. 92, Formation of the Galactic Halo: Inside and Out, ed. G.W. Preston, H. Morrison, & A. Sarajedini, 3
- (28) Garnavich, P.M., VandenBerg, D.A., Zurek, D.R., & Hesser, J.E., 1994, AJ, 107, 1097
- (29) Graham, J.A., 1982, ApJ, 252, 474
- (30) Gratton, R.G., Carretta, E., Matteucci, F., & Sneden, C., 2000, A&A, 358, 671
- (31) Gregg, M.D., Ferguson, H.C., Minniti, D., Tanvir, N., Catchpole, R., 2004, AJ, 127, 1441
- (32) Greggio, L., 1997, MNRAS, 285, 151
- (33) Grillmair, C.J., et al. 1996, AJ, 112, 1975
- (34) Guarnieri, M.D., Ortolani, S., Montegriffo, P., Renzini, A., Barbuy, B., Bica, E., & Moneti, A., 1998, å, 331, 70
- (35) Harris, G.H., Harris, W.E., & Poole, G.B., 1999, AJ, 117, 855
- (36) Harris, W.E., & Harris, G.H., 2000, AJ, 120, 2423
- (37) Harris, W.E., & Harris, G.H., 2002, AJ, 123, 3108
- (38) Hartwick, F.D.A., 1976, ApJ, 209, 418
- (39) Ho, L.C., Filippenko, A.V., Sargent, W.L.W., 1996, ApJ, 462, 183
- (40) Holland, S., Fahlman, G.G., & Richer, H.B., 1996, AJ, 112, 1035
- (41) Holtzman, J.A., Burrows, C.J., Casertano, S., et al., 1995, PASP, 107, 1065
- (42) Ibata, R.A., Irwin M.J., Lewis, G., Ferguson, A.M.N., & Tanvir, N., 2001, Nature, 412, 49
- (43) Larsen, S.S., Brodie, J.P., Beasley, M.A., & Forbes, D.A., 2002, AJ, 124, 828
- (44) Lee, M.G., Freedman, W.L., & Madore, B.F. 1993, ApJ, 417, 553
- (45) McWilliam, A., 1997, ARA&A, 35, 503
- (46) Mouhcine, M., Lançon, A., 2003, MNRAS, 338, 572
- (47) Mouhcine, M., Ferguson, H.C., Rich, R.M., Brown, T., & Smith E., 2004a, ApJ, submitted
- (48) Mouhcine, M., Ferguson, H.C., Rich, R.M., Brown, T., & Smith E., 2004b, ApJ, submitted
- (49) Mould, J., & Kristian, J., 1986, ApJ, 305, 591
- (50) Mighell, K.J., Rich, R.M., 1995, ApJ, AJ, 110, 1649
- (51) Norris, J.E., & Ryan, S.G., 1991, ApJ, 380, 403
- (52) Origlia, L., Rich, R.M., Castro, S., 2002, AJ, 123, 1559
- (53) Pagel, B.E.J., & Patchett, B.E., 1975, MNRAS, 172, 13
- (54) Pagel, B.E.J., 1997, Nucleosyntheis and Chemical Evolution of Galaxies (Cambridge: Cambridge University Press), 237
- (55) Peng, E.W., Holland, C., Freeman, K.C., White, R.L., 2002, AJ, 124, 3144
- (56) Peterson, R.C., Green, E.M., 1998, ApJ, 502, 39
- (57) Pierce, M.J., & Tully, R.B., 1992, ApJ, 387, 47
- (58) Pritchet, C.J., Schade, D., Richer, H.B., Crabtree, D., & Yee, H.K.C., 1987, ApJ, 323, 79
- (59) Pritchet, C.J., van den Bergh, S., 1994, AJ, 107, 1730
- (60) Puche, A., & Carignan, C., 1988, AJ, 95, 1025
- (61) Richer, H.B., 1981, ApJ, 243, 744
- (62) Richer, H.B., Pritchet, C.J., Crabtree, D.R., 1985, ApJ, 298, 240
- (63) Robin, A.C., Reylé, C., Derriére, S., & Picaud, S., 2003, A&A, 409, 523
- (64) Sagar, R., Subramaniam, A., Richtler, T., & Grebel, E.K. 1999, A&AS, 135, 391
- (65) Sakai, S., Mould J.R., Hughes S.M.G., et al., 2000, ApJ, 529, 698
- (66) Sarajedini, A., & Van Duyne, J., 2001, AJ, 122, 2444
- (67) Saviane, I., Rosenberg, A., Piotto, G., & Aparicio, A., 2000, å, 355, 966
- (68) Schlegel, D.J., Finkbeiner, D.P., & Davis, M., 1998, ApJ, 500, 525
- (69) Scott, D. W. 1992, Multivariate Density Estimation (New York: Wiley)
- (70) Searle, L., & Sargent, W.L.W., 1972, ApJ, 173, 25
- (71) Searle, L., & Zinn R., 1978, ApJ, 225, 357
- (72) Shetrone, M., Venn, K.A., Tolstoy, E., Primas, F., Hill, V., & Kaufer., A., 2003, AJ, 125, 684
- (73) Smail, I., Hogg, D.W., Yan, L., & Cohen J.G., 1995, ApJ, 449, L105
- (74) Taylor, B.J., 2001, A&A, 377, 473
- (75) Tiede, G.P., Sarajedini, A., Barker, M.K., 2004, AJ, 128, 224
- (76) Tinsley B.M., 1980, Fundam. Cosmic Phys., 5, 287
- (77) Tolstoy, E., Venn, K.A., Shetrone, M., Primas, F., Hill, V., & Szeifert, T., 2003, AJ, 125, 707
- (78) VandenBerg, D.A., Swenson, F.J., Rogers, F.J., Iglesias, C.A., & Alexander, D.R,. 2000, ApJ, 532, 430
- (79) Yanny, B., Newberg, H.J., Kent, S., et al., 2000, ApJ, 540, 825
- (80) Zoccali, M., Renzini, A., Ortolani, S., et al., 2001, AJ, 121, 2638
- (81) Zoccali, M., Renzini, A., Ortolani, S., et al., 2003, A&A, 399, 931
| Galaxy | Type | ||||||
|---|---|---|---|---|---|---|---|
| NGC 55 | Sc | 90 | 26.11 | 0.01 | -19.02 | -1.69 | -1.54 |
| NGC 247 | Sc(s)III-IV | 80 | 27.30 | 0.02 | -18.91 | -1.44 | -1.39 |
| NGC 253 | Sc(s) | 86 | 27.59 | 0.02 | -21.13 | -0.74 | -1.17 |
| NGC 300 | Sc(s)II | 46 | 26.53 | 0.014 | -18.62 | -1.93 | -1.86 |
| NGC 3031 | Sb(r)I-II | 60 | 27.80 | 0.08 | -21.14 | -0.90 | -1.25 |
| NGC 4244 | ScdIII | 90 | 27.88 | 0.02 | -18.96 | -1.48 | -1.51 |
| NGC 4258 | Sb(s)II | 71 | 29.32 | 0.02 | -21.30 | -0.70 | -1.26 |
| NGC 4945 | Sc(s)I-II | 90 | 27.56 | 0.18 | -20.77 | -0.66 | -1.03 |
| [M/H] | NGC 253 | NGC 3031 | NGC 4258 | NGC 4945 | NGC 4244 | NGC 300 | NGC 247 | NGC 55 |
|---|---|---|---|---|---|---|---|---|
| -2.45 | 0.0 | 0.0 | ||||||
| -2.445 | 0.0 | |||||||
| -2.425 | 0.0 | 0.0 | ||||||
| -2.35 | 1.1 | 0.0 | ||||||
| -2.295 | 6.4 | |||||||
| -2.275 | 5.7 | 2.1 | ||||||
| -2.25 | 1.2 | 3.5 | ||||||
| -2.2 | 2.1 | |||||||
| -2.17 | 1.0 | |||||||
| -2.15 | 2.3 | 5.8 | ||||||
| -2.145 | 11.8 | |||||||
| -2.125 | 13.9 | 5.1 | 8.24 | |||||
| -2.05 | 5.7 | 10.4 | ||||||
| -2.0 | 5.1 | |||||||
| -1.995 | 8.5 | |||||||
| -1.975 | 20.9 | 5.3 | ||||||
| -1.95 | 1.2 | 8.2 | 2.1 | |||||
| -1.875 | 10.3 | |||||||
| -1.85 | 2.3 | 8.1 | ||||||
| -1.845 | 15.0 | |||||||
| -1.825 | 27.7 | 3.1 | ||||||
| -1.80 | 4.1 | |||||||
| -1.75 | 9.1 | 15.0 | ||||||
| -1.73 | 3.1 | |||||||
| -1.695 | 15.1 | |||||||
| -1.675 | 42.9 | 8.4 | ||||||
| -1.65 | 8.0 | 10.5 | ||||||
| -1.625 | 6.2 | |||||||
| -1.6 | 8.2 | |||||||
| -1.55 | 4.6 | 17.3 | ||||||
| -1.545 | 22.4 | |||||||
| -1.525 | 39.6 | 3.1 | ||||||
| -1.51 | 6.2 | |||||||
| -1.45 | 11.5 | 25.4 | ||||||
| -1.4 | 6.2 | |||||||
| -1.395 | 19.2 | |||||||
| -1.375 | 39.3 | 10.5 | 8.2 | |||||
| -1.35 | 17.4 | 45.3 | ||||||
| -1.29 | 6.1 | |||||||
| -1.25 | 24.5 | 48.6 | ||||||
| -1.245 | 48.1 | |||||||
| -1.225 | 93.3 | 16.8 | ||||||
| -1.2 | 20.5 | |||||||
| -1.15 | 23.7 | 80.4 | ||||||
| -1.095 | 42.1 | |||||||
| -1.075 | 135.9 | 19.9 | ||||||
| -1.07 | 17.5 | |||||||
| -1.05 | 26.1 | 101.4 | ||||||
| -1.00 | 17.5 | |||||||
| -0.95 | 26.6 | 176.5 | ||||||
| -0.945 | 49.1 | |||||||
| -0.925 | 142.2 | 27.4 | ||||||
| -0.875 | 3.1 | |||||||
| -0.85 | 38.1 | 202.7 | 12.4 | |||||
| -0.80 | 10.3 | |||||||
| -0.795 | 29.1 | |||||||
| -0.775 | 179.3 | 27.5 | ||||||
| -0.75 | 57.0 | 278.5 | ||||||
| -0.65 | 67.9 | 281.3 | ||||||
| -0.645 | 14.7 | |||||||
| -0.63 | 5.2 | |||||||
| -0.625 | 242.1 | 21.4 | 1.0 | |||||
| -0.60 | 4.1 | |||||||
| -0.55 | 51.3 | 358.9 | ||||||
| -0.495 | 12.0 | |||||||
| -0.475 | 217.5 | 17.2 | ||||||
| -0.45 | 20.7 | 286.4 | ||||||
| -0.41 | 1.0 | |||||||
| -0.35 | 1.7 | 194.6 | ||||||
| -0.345 | 1.2 | |||||||
| -0.325 | 93.8 | 17.5 | ||||||
| -0.25 | 0.0 | 97.2 | ||||||
| -0.195 | 1.4 | |||||||
| -0.19 | 2.1 | |||||||
| -0.175 | 28.5 | 3.5 | ||||||
| -0.15 | 0.0 | 44.2 | ||||||
| -0.05 | 0.0 | 11.6 | ||||||
| -0.025 | 3.4 | 1.2 |