New soft gamma-ray bursts in the BATSE records and spectral properties of X-ray rich bursts
Abstract
A population of X-ray dominated gamma-ray bursts (GRBs) observed by Ginga, BeppoSAX and HETE-2 should be represented in the BATSE data as presumably soft bursts. We have performed a search for soft GRBs in the BATSE records in the 25–100 keV energy band. A softness of a burst spectrum can be a reason why it has been missed by the on-board procedure and previous searches for untriggered GRBs tuned to 50–300 keV range. We have found a surprisingly small number ( yr-1 down to 0.1 ph cm-2 s-1) of soft GRBs where the count rate is dominated by 25–50 keV energy channel. This fact as well as the analysis of HETE-2 and common BeppoSAX/BATSE GRBs indicates that the majority of GRBs with a low has a relatively hard tail with the high-energy power-law photon index . An exponential cutoff in GRB spectra below 20 keV may be a distinguishing feature separating non-GRB events.
keywords:
gamma-ray bursts – methods: data analysis1 Introduction
Observations of the prompt gamma-ray bursts (GRBs) emission by different instruments show that their spectra can extend from several keV up to a few MeV (Wheaton et al., 1973; Trombka et al., 1974; Metzger et al., 1974) sometimes up to GeV range (Sommer et al., 1994). According to recent broadband observations by Ginga (Strohmayer et al., 1998), HETE-2 (Sakamoto et al., 2005) and combined results of BeppoSAX/BATSE (kip02) and RXTE/IPN (Smith et al., 2002), most GRBs exhibit a peak in the spectrum at an energy in the 50–400 keV range. However, distribution of is broad and large part of events demonstrate significant X-ray (2–30 keV) emission (X-ray dominated GRBs, X-ray rich GRBs). At this moment study of broadband spectra is complicated because of insufficient statistics accumulated by broadband instruments and biases due to different instrument responses.
The BATSE (Paciesas et al., 1999) data of all-sky 9.1 years
(1991–2000) continuous monitoring in -ray range
give unique possibility for combined GRB analysis
with X-ray observations. BATSE -ray detectors
were the most sensitive instruments of this type
over GRB history. Only recently launched Swift experiment (Gehrels et al., 2004) has
a more sensitive -ray detector.
However, during the next several years Swift cannot accumulate statistics comparable to that of the BATSE.
BATSE detected about 2700 GRBs with fluxes down to
ph cm-2 s-1 (Paciesas et al., 1999).
In addition, the off-line scans of
the BATSE continuous records almost doubled
the number of observed GRBs with fluxes down to
ph cm-2 s-1
(see Kommers et al. 2001;
111Non-triggered supplement
to the BATSE GRB catalogs is available at
http://space.mit.edu/BATSE/intro.html
Stern et al. 2001
222The uniform catalog of GRBs
found in the continuous BATSE daily records is available at
http://www.astro.su.se/groups/head/grb_archive.html)
The BATSE detectors were sensitive to photons from 25 keV up to 1 MeV. However, the on-board procedure and most off-line searches identified GRBs according to the signal in the 50–300 keV range while GRBs with a soft spectrum could be missed. These soft events can help to outline the place of the X-ray dominated bursts in the GRB variety.
The 25-50 keV range was inspected only in the off-line search of Kommers et al. (2001). Their scan have covered 6 out of 9.1 years of the BATSE data and yielded 50 unknown low-energy events some of which are probably soft GRBs. Even if all of them are GRBs, the number of these events is 50 times smaller than that found in the 50–300 keV range.
We performed a search for GRBs, inspecting the 25–50 keV range for time period not covered by the scan of Kommers et al. (2001) with a more careful and optimized for soft GRBs procedure. The continuous daily 1.024 s time resolution DISCLA records of count rate in 8 BATSE detectors in 4 energy channels (25–50, 50–100, 100–300 and 300–1000 keV) were used. We have applied the same technique and the same algorithm as in our scan of the BATSE DISCLA data in the 50–300 keV range (Stern et al., 2001) setting the trigger in the 25–100 keV range (i.e. in the 1st and 2nd energy channels).
| Date | Seconds | TJD | HRb | ||||||
| of TJD | deg | deg | deg | s | |||||
| 13 soft GRBs () | |||||||||
| 980726 | 63036 | 11020 | 0.11 | 0.57 | 255.8 | 54.8 | 9.7 | 56 | 29 |
| 980804 | 50914 | 11029 | 0.46 | 0.87 | 173.3 | 52.7 | 7.3 | 13 | 5 |
| 980927 | 6133 | 11083 | 0.33 | 0.89 | 9.6 | 54.5 | 11.4 | 6 | 4 |
| 981225 | 76754 | 11172 | 0.22 | 0.45 | 161.9 | 61.3 | 17.0 | 25 | 4 |
| 990304 | 77277 | 11241 | 1.85 | 0.83 | 31.6 | 26.7 | 4.6 | 4 | 2 |
| 990513 | 2453 | 11311 | 0.18 | 0.30 | 236.4 | 59.6 | 16.5 | 15 | 2 |
| 990610 | 20227 | 11339 | 0.11 | 0.43 | 234.8 | 16.6 | 17.3 | 80 | 11 |
| 990804 | 39065 | 11394 | 0.05 | 0.92 | 44.1 | 21.2 | 36.6 | 38 | 10 |
| 990907 | 75723 | 11428 | 0.06 | 0.66 | 301.0 | 39.3 | 8.3 | 126 | 33 |
| 991003 | 30847 | 11454 | 0.16 | 0.60 | 253.8 | 33.2 | 21.1 | 13 | 6 |
| 991009 | 30691 | 11460 | 0.10 | 0.47 | 107.9 | 3.5 | 12.9 | 24 | 8 |
| 991106 | 59880 | 11488 | 0.10 | 0.33 | 284.7 | 58.2 | 20.5 | 39 | 11 |
| 000107 | 8784 | 11550 | 0.12 | 0.91 | 74.9 | 61.6 | 16.1 | 73 | 12 |
| 8 classic GRBs () | |||||||||
| 980707 | 9097 | 11001 | 0.40 | 3.29 | 79.0 | 40.4 | 9.9 | 6 | 4 |
| 980930 | 83166 | 11086 | 0.37 | 1.90 | 132.0 | 70.9 | 6.7 | 38 | 19 |
| 981012 | 21270 | 11098 | 0.11 | 1.24 | 59.0 | 15.5 | 20.7 | 17 | 11 |
| 981019 | 69630 | 11105 | 0.29 | 2.18 | 208.9 | 40.3 | 11.7 | 17 | 3 |
| 981221 | 18020 | 11168 | 0.97 | 1.82 | 71.9 | 3.6 | 15.4 | 9 | 1 |
| 990303 | 74922 | 11240 | 0.25 | 1.00 | 199.9 | 52.4 | 18.9 | 9 | 7 |
| 000324 | 36745 | 11627 | 0.08 | 2.10 | 58.7 | 26.4 | 18.8 | 36 | 10 |
| 000523 | 49912 | 11687 | 0.41 | 1.01 | 269.1 | 80.6 | 8.6 | 24 | 9 |
| a Peak count rate in the 25–300 keV band, in units of cnt cm-2 s-1. | |||||||||
| b Hardness ratio of the peak count rates in the 50–300 keV to that in the 25–50 keV band. | |||||||||
| c Coordinates. d Error radius. e Duration. | |||||||||
| f Number of 1.024 s bins where the signal exceeds 50 per cent of the peak value. | |||||||||

2 Search for soft GRBs in the BATSE records
We have performed the scan of BATSE DISCLA records available at FTP archive at Goddart Space Flight Center 333FTP archive at the Goddart Space Flight Center is available at ftp://cossc.gsfc.nasa.gov/compton/data/batse/daily for time period since July 6, 1998 till May 26, 2000 (TJDs 11000-11699, files for TJDs 11047, 11048, 11354, 11355-11359, 11519-11521 are missing). The applied algorithm and technique is described in Stern et al. (2001). Only the 25–100 keV range (1 and 2 channels) was checked. The 1024 ms time resolution DISCLA data are not suitable for studies of short ( s) GRBs and we did not consider 1 bin events. This allows us to avoid scintillation from heavy nuclei and soft gamma-ray repeater (SGR) outbursts. We excluded also events with location in the vicinity of Galactic center, the Sun, four known SGRs and other persistent sources and events that appeared near and below Earth horizon. We recorded only new GRBs missing in the catalogs of Paciesas et al. (1999) and Stern et al. (2001).
We have found and classified as GRBs 21 new events. Table 1 present their time identificator, intensity, hardness, location and duration. In the previous scan in 50–300 keV (Stern et al., 2001) for the same time period we have detected about 800 long GRBs. Hardness-intensity diagram (Fig. 1) shows that although GRBs of a new sample are softer on average, the samples do overlap. Actually 13 out of 21 GRBs in a new sample (Table 1) and 23 of 800 long GRBs in the old sample (Stern et al., 2001, Table 2) have the peak count rate in 25–50 keV higher than that in the 50–300 keV band. According to this somewhat arbitrary criterion we consider these 36 events as a sample of soft long (2 s) BATSE GRBs.
| Date | Seconds | TJDa | HRc | ||||||
| of TJD | deg | deg | deg | s | |||||
| 980924 | 54262 | 11080b | 0.95 | 0.93 | 61.8 | 22.0 | 8.8 | 10 | 2 |
| 981015 | 46766 | 11101c | 1.36 | 0.69 | 122.9 | 22.1 | 5.4 | 34 | 6 |
| 981115 | 21438 | 11132b | 0.80 | 0.80 | 284.0 | 10.0 | 10.6 | 4 | 1 |
| 981117 | 11629 | 11134a | 0.41 | 0.98 | 217.6 | 65.7 | 23.7 | 8 | 3 |
| 981118 | 2533 | 11135a | 0.48 | 0.97 | 186.9 | 60.6 | 23.0 | 6 | 2 |
| 981128 | 74360 | 11145c | 0.18 | 0.97 | 60.3 | 38.4 | 33.2 | 36 | 3 |
| 981204 | 37850 | 11151a | 0.16 | 1.00 | 53.4 | 55.9 | 21.5 | 9 | 3 |
| 981222 | 58180 | 11169b | 0.30 | 0.89 | 145.9 | 67.1 | 28.7 | 11 | 5 |
| 990112 | 7066 | 11190a | 0.20 | 0.63 | 118.6 | 45.6 | 17.7 | 85 | 14 |
| 990207 | 55697 | 11216e | 0.49 | 0.95 | 152.9 | 9.7 | 16.7 | 17 | 2 |
| 990218 | 73752 | 11227b | 0.35 | 0.98 | 72.9 | 37.7 | 17.8 | 89 | 7 |
| 990413 | 32497 | 11281d | 0.39 | 0.94 | 302.1 | 55.5 | 12.8 | 6 | 6 |
| 990506 | 42666 | 11304c | 0.19 | 0.89 | 186.9 | 9.6 | 21.3 | 61 | 15 |
| 990610 | 56705 | 11339c | 0.45 | 0.99 | 105.7 | 16.6 | 8.4 | 109 | 18 |
| 990915 | 58755 | 11436c | 0.64 | 0.78 | 273.2 | 21.9 | 5.0 | 50 | 12 |
| 991006 | 68176 | 11457b | 0.76 | 0.99 | 104.0 | 11.7 | 3.8 | 73 | 27 |
| 991201 | 1802 | 11513a | 0.09 | 0.98 | 167.9 | 10.9 | 12.3 | 19 | 13 |
| 991217 | 37909 | 11529b | 0.36 | 0.49 | 64.8 | 12.7 | 16.8 | 8 | 1 |
| 991231 | 28492 | 11543a | 0.22 | 0.96 | 39.3 | 32.3 | 11.3 | 14 | 5 |
| 000114 | 51441 | 11557a | 1.17 | 0.99 | 107.4 | 25.3 | 3.8 | 5 | 2 |
| 000206 | 74873 | 11580g | 0.22 | 0.98 | 255.7 | 78.5 | 10.7 | 26 | 7 |
| 000405 | 77386 | 11639b | 0.92 | 0.96 | 226.9 | 52.5 | 2.1 | 35 | 7 |
| 000416 | 52380 | 11650c | 0.17 | 0.70 | 258.5 | 65.7 | 14.7 | 9 | 5 |
| a Litera next to TJD means a name in the uniform catalog of Stern et al. (2001). | |||||||||
| b Peak count rate in the 25–300 keV band, in units of cnt cm-2 s-1. | |||||||||
| c Hardness ratio of the peak count rates in the 50–300 keV to that in the 25–50 keV band. | |||||||||
| d Coordinates. e Error radius. f Duration. | |||||||||
| g Number of 1.024 s bins where the signal exceeds 50 per cent of the peak value. | |||||||||
These 36 soft GRBs have typical light curves, last up to about 100 s and do not demonstrate any significant anisotropy on the sky. Soft BATSE GRBs selected with the above criterion constitute about 5% of observed long GRB sample (about 20 per year with peak fluxes down to ph cm-2 s-1).
Our scan (as well as an alternative scan Kommers et al. 2001) in the BATSE records in the 25–50 keV range has yielded surprisingly small number of new soft GRBs. Moreover, there are no events with hardness ratio (HR) below 0.3, while much softer events like outbursts of Vela X-1 can be confidently detected (see Fig. 1). We have considered sample of 50 events classified by Kommers et al. (2001) as unknown because of their softness. When excluding short events they again have except two events from the direction to Vela X-1.
Why do not we see softer GRBs despite the fact that there exist X-ray dominated bursts with peak energy below the BATSE window? We calculated the BATSE detector response to estimate the dependence between the incident photon spectrum and the observed hardness ratio (see Fig. 2). We approximated GRB spectra with the Band function (Band et al., 1993) and folded them with the BATSE Detector Response Matrix (DRM) (Pendleton et al., 1999). The low hardness ratio () of our soft events is consistent with a wide variety of spectral parameters , low energy and high energy spectral indices and , in particular, with keV and (see Fig. 1 and 2). It is also evident that the sufficient condition for a GRB to give and thus to look as a typical GRB in the BATSE data (with larger signal above 50 keV) is , independently on the . A combination of a low and a very steep would give the hardness ratio below 0.3 which we do not observe. The fact that all events with have evident non-GRB origin (solar flares, Vela X-1 pulsar, etc.) implies that a spectral cutoff below 15 keV may be a distinguishing feature to separate non-GRB sources.

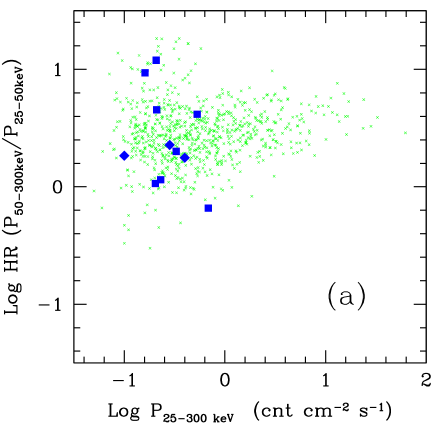
3 GRB spectra as observed by BATSE/BeppoSAX/HETE-2
BeppoSAX observed 20 X-ray dominated GRBs which were detected by Wide Field Camera (2–26 keV), but did not activate the trigger of the Gamma-Ray Monitor (40–400 keV). Their counterparts were found in the BATSE records for almost all observable events (Kippen et al., 2001; in ’t Zand et al., 2003). Most of them were detected earlier as classic GRBs by our scan of BATSE data in 50–300 keV band (Stern et al., 2001). It turns out that these events have a high hardness ratio similar to typical GRBs (see Fig. 3a). The hardness ratio 100–300/50–100 keV for common BeppoSAX/BATSE events shows a similar picture: 7 out of 8 events have a typical hardness for weak GRBs and one event is softer. Thus this distribution is also consistent with the extrapolated hardness-intensity trend for long GRBs (Kippen et al., 2001). These facts support our conclusion that most of the X-ray dominated GRBs should have a hard tail with in the BATSE window 25–1000 keV (see Fig. 2).
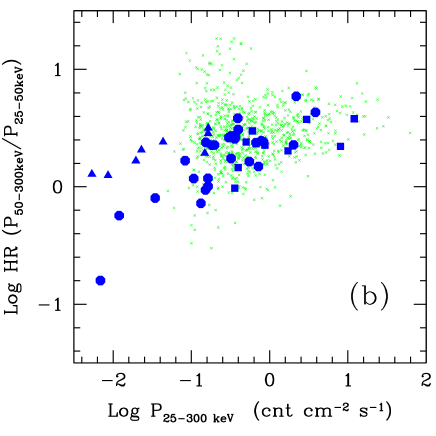
HETE-2 observed 45 GRBs in the 2–400 keV band and their spectral fits are given in Sakamoto et al. (2005). In order to check how HETE-2 results are related to our data we folded HETE-2 spectra with the BATSE detector response matrix and obtained corresponding counts in BATSE channels (see Fig. 3b). The fraction of soft events in the HETE-2 sample is about 3 times larger than in the BATSE sample which can be explained by different instrument responses. But only 1 out of 45 HETE-2 events gives a lower hardness ratio than we see in the BATSE GRB sample. Nine out of 45 HETE-2 events are below the BATSE sensitivity threshold. The BATSE sample, however, represents probably the whole GRB spectral variety.
Sakamoto et al. (2005) fitted HETE-2 spectra by three functions: a power-law, a power-law with the exponential cutoff and the Band function. They started from a power-law fit and used a more parametric expression only if the fit was inconsistent with the data at 0.01 significance level. From Fig. 3b one can see that the power-law fit was acceptable only for weak events. Relatively bright bursts gave good power-law with exponential cutoff fits. However, this does not mean that they could not be fitted by the Band function. According to our results, the existence of GRBs with sharp spectral cutoff is questionable for events with low . Indeed, the events with 10–20 keV would give a very low hardness ratio which we do not observe. Note that, as shown by Preece et al. (1999), only few percents of GRBs with high are better described by a power-law with the exponential cutoff. If the dispersion in is due to variations in the redshift/blueshift in the source, then the spectral shape would be stable and our conclusion could refer to all GRBs.
4 Conclusions
-
1.
Despite the wealth of the X-ray dominated GRBs observed by Ginga, BeppoSAX and HETE-2 the number of soft GRBs in the BATSE data is relatively small. The fraction of events with the count rate in 25–50 keV higher than that above 50 keV is 5 per cent (20 per year with flux down to 0.1 ph cm-2 s-1).
-
2.
The hardness distribution of the X-ray dominated GRBs in the BATSE band is consistent with that of weak classic GRBs. In the case of a low , the main fraction of GRBs should have a relatively hard high-energy tail with a power-law slope . Only a few per cent of the X-ray rich GRBs have a tail with , but still harder than the exponential one. This fact clarifies the deficiency of soft events in the BATSE data.
-
3.
An exponential cutoff in the GRB spectra, if exists, is probably a rare phenomenon. Therefore, a spectral cutoff with the e-folding energy below keV may be a distinguishing feature to separate the non-GRB events.
Acknowledgments
We are grateful to Robert Preece and Geoffrey Pendleton for the code of the BATSE detector response matrix. We thank Kevin Hurley for providing us IPN data on our soft GRB sample. This research has made use of data obtained through the High Energy Astrophysics Science Archive Research Center Online Service, provided by the NASA/Goddard Space Flight Center. The work is supported by NORDITA Nordic project in high energy astrophysics in the INTEGRAL era, Russian Foundation for Basic Research (grant 04-02-16987), and Russian Foundation of Science Support (Y.T.).
References
- Band et al. (1993) Band D. et al. , 1993, ApJ, 413, 281
- Gehrels et al. (2004) Gehrels N. et al., 2004, ApJ, 611, 1005
- in ’t Zand et al. (2003) in ’t Zand J., Heise J., Kippen R., Woods P., Guidorzi C., Montanari E., Frontera F., 2003, in Piro L., Frontera F., Masetti N., Feroci M., eds, ASP Conf. Series 312, Third Rome workshop on gamma-ray bursts in the afterglow era, Astron. Soc. Pac., San Francisco, p. 18
- Kippen et al. (2001) Kippen R. M., Woods P. M., Heise J., in’t Zand J., Preece R. D., Briggs M. S., 2001, in Costa E., Frontera F., Hjorth J., eds, Gamma-Ray Bursts in the Afterglow Era. Berlin, Springer, p. 22
- Kommers et al. (2001) Kommers J., Lewin W.H.G., Kouveliotou C., van Paradijs J., Pendleton G.N., Meegan C.A., Fishman G.J., 2001, ApJS, 134, 385
- Metzger et al. (1974) Metzger,A. E., Parker R. H., Gilman D., Peterson L. E., Trombka J. I., 1974, ApJ, 194, L19
- Paciesas et al. (1999) Paciesas W.S. et al., 1999, ApJS, 122, 465
- Pendleton et al. (1999) Pendleton G.N. et al., 1999, ApJ, 512, 362
- Preece et al. (1999) Preece R.D., Briggs M.S., Mallozzi R.S., Pendleton G. N., Paciesas W.S., Band D.L., 2000, ApJS, 126, 19
- Sakamoto et al. (2005) Sakamoto T. et al., 2005, ApJ, 629, 311
- Smith et al. (2002) Smith D.A. et al., 2002, ApJS, 141, 415
- Sommer et al. (1994) Sommer M. et al., 1994, ApJ, 422, L63
- Stern et al. (2001) Stern B. E., Tikhomirova Y., Kompaneets D., Svensson R., Poutanen J., 2001, ApJ, 563, 80
- Strohmayer et al. (1998) Strohmayer T. E., Fenimore E. E., Murakami T., Yoshida A., 1998, ApJ, 500, 873
- Trombka et al. (1974) Trombka J. I., Eller E. L., Schmadebeck R. L., Adler I., Metzger A. E., Gilman D., Gorenstein P., Bjorkholm P., 1974, ApJ, 194, L27
- Wheaton et al. (1973) Wheaton Wm. A. et al., 1973, ApJ, 185, L57