XMM-Newton observations of the Ori cluster.
II. Spatial and spectral analysis of the full EPIC field
††thanks: Based on observations obtained with XMM-Newton, an ESA science
mission with instruments and contributions directly funded by ESA Member
States and NASA
We present the results of an XMM-Newton observation of the young ( Myr) cluster around the hot star Orionis. In a previous paper we presented the analysis of the RGS spectrum of the central hot star; here we discuss the results of the analysis of the full EPIC field. We have detected 175 X-ray sources, 88 of which have been identified with cluster members, including very low-mass stars down to the substellar limit. We detected eleven new possible candidate members from the 2MASS catalogue. We find that late-type stars have a median , i.e. very close to the saturation limit. We detected significant variability in % of late-type members or candidates, including 10 flaring sources; rotational modulation is detected in one K-type star and possibly in another 3 or 4 stars. Spectral analysis of the brightest sources shows typical quiescent temperatures in the range keV and keV, with subsolar abundances , similar to what is found in other star-forming regions and associations. We find no significant difference in the spectral properties of classical and weak-lined T Tauri stars, although classical T Tauri stars tend to be less X-ray luminous than weak-lined T Tauri stars.
Key Words.:
open clusters and associations: individual: Ori – stars: activity – stars: coronae – stars: pre-main sequence – stars: late-type – X-rays: stars1 Introduction
The $σ$~Ori cluster was discovered by ROSAT (Wolk 1996; Walter et al. 1997) around the O9.5V binary star $σ$~Ori~AB (which results from two components separated by 0.2). It belongs to the Orion OB1b association and is located at a distance of pc (from Hipparcos, ESA 1997). In addition to several hot stars, it is known to contain more than 100 likely pre-main sequence (PMS) late-type stars within of Ori (Wolk 1996; Sherry et al. 2004), as well as several brown dwarfs and planetary-mass objects (Béjar et al. 1999, 2001, 2004; Zapatero Osorio et al. 2000; Caballero et al. 2004). The estimated age of the cluster is Myr (Zapatero Osorio et al. 2002; Oliveira et al. 2002; Sherry et al. 2004).
We have observed the Ori cluster using XMM-Newton. The observation was centered on the hot star Ori AB, in order to obtain both a high-resolution RGS spectrum of the central source and EPIC imaging data and low-resolution spectra over the whole field. The analysis of the RGS and EPIC spectra of the hot star Ori AB has been presented in a previous paper (Sanz-Forcada et al. 2004, hereafter referred to as Paper I), together with the analysis of the EPIC spectra of other three nearby bright sources that could potentially contaminate the RGS spectrum of Ori AB. Of these, only the B2Vp star $σ$~Ori~E was found to significantly affect the RGS spectrum: its EPIC spectrum allowed us to correct for its contribution, and therefore to derive the emission measure distribution and elemental abundances of Ori AB. We found that Ori AB has a much softer spectrum than the other sources, consistently with a wind origin, however the RGS spectrum shows no evidence for line broadenings and shifts with velocities km s-1, as could be produced by strong winds; the low line ratio in the Ne and O He-like triplets indicates either high density (i.e. magnetic confinement either close to or far from the star) or, more likely, a strong UV radiation field (i.e. emission close to the star where the wind is however too weak to produce shocks).
In Paper I we also reported the detection of a strong flare from the magnetic hot star Ori E, which is not expected from models of X-ray emission from winds. Based on the characteristics of the flare and of the quiescent emission, whose spectrum is harder than that of Ori AB and consistent with those of late-type stars, we argued that the flare and most of the quiescent emission is most likely due to an unseen late-type companion, although emission from the magnetic hot star itself cannot be excluded (see discussion in Paper I).
In this paper we present the analysis of the full EPIC field, in order to derive the X-ray properties of the other members or candidates of the Ori cluster. The paper is organized as follows. X-ray observations and data analysis are described in Sect. 2. In Sect. 3 we discuss the X-ray properties of cluster members and compare our results with those of other star forming regions and young open clusters. Spectral analysis of the brightest sources is presented in Sect. 4. Discussion and conclusions are given in Sect. 5.
2 Observations and data analysis
XMM-Newton observations of the Ori cluster, centered on the hot star Ori AB, were carried out as part of the Guaranteed Time of one of us (R.P.) using both the EPIC MOS and PN cameras and the RGS instrument. The observation (ID 0101440301) started at 21:47 UT on March 23, 2002 and ended at 9:58 UT on March 24, 2002, for a total duration of 43 ks. The EPIC cameras were operated in Full Frame mode using the thick filter.
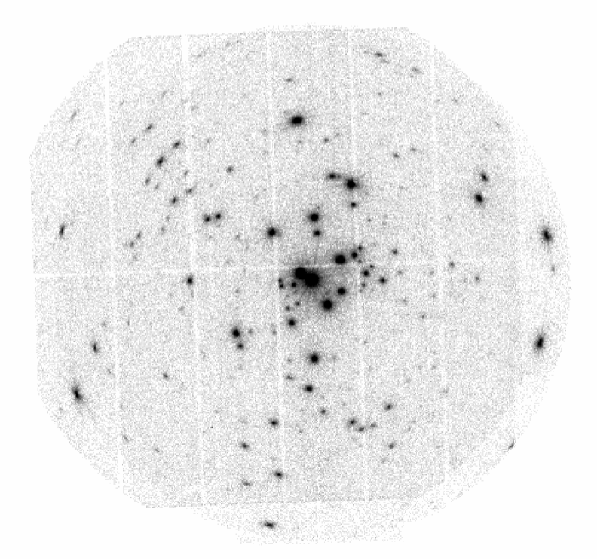
Data analysis was carried out using the standard tasks in SAS v.5.4.1. The analysis of the RGS data has been discussed in Paper I and will not be repeated here. EPIC calibrated and cleaned event files were derived from the raw data using the standard pipeline tasks emchain and epchain and then applying the appropriate filters to eliminate noise and bad events. The event files have also been time filtered in order to exclude a few short periods of high background due to proton flares; the final effective exposure time is 41 ks for each MOS and 36 ks for the PN. We limited our analysis to the keV energy band, since events below 0.3 keV are mostly unrelated to bona-fide X-rays, while above 7.8 keV only background is present. The combined EPIC (MOS1+MOS2+PN) image in the keV energy band is shown in Fig. 1. Exposure maps for each instrument in the same energy band were created using the task eexpmap.
Source detection was performed both on the individual datasets and on the merged MOS1+MOS2+PN dataset using the Wavelet Detection algorithm developed at INAF-Osservatorio Astronomico di Palermo (Damiani et al. 1997, Damiani et al., in preparation), adapted to the EPIC case. From the comparison of the count rates of common sources detected on the individual datasets, we derived a median ratio of PN to MOS count rates of ; this value was then used as a scaling factor for the PN exposure map in the detection on the summed dataset, in order to take into account the different sensitivities of the PN and MOS cameras. This implies a resulting MOS equivalent exposure time of ks for the merged dataset. Count rates derived from the detection on the summed dataset are MOS equivalent count rates.
We used a significance detection threshold of , chosen in order to have at most one spurious detection, and determined from a set of 100 simulations of pure background datasets with the same number of counts as the observation. After removing a few obviously spurious detections (due to hot pixels, to the point spread function structure of the central bright source, and to out-of-time events) we obtained a total of 175 sources, three of which were detected only on a single instrument dataset (two on MOS and one on PN).
2.1 The optical catalogue
The Ori cluster has been the subject of several studies after its discovery by ROSAT (Walter et al. 1997). Wolk (1996) performed follow-up UBVRI photometry down to within 30 from Ori, finding candidate PMS stars, and obtained medium-resolution spectroscopy for a few of them. Recently, Sherry et al. (2004) extended the survey to an area of deg2 around the hot star down to . Several deep optical and infrared surveys of the cluster, with limiting magnitude , have led to the discovery of several very-low mass stars and brown dwarfs as well as of a number of planetary-mass objects (Béjar et al. 1999, 2001, 2004; Zapatero Osorio et al. 2000; Caballero et al. 2004). Additional photometric RI surveys down to have been performed by Scholz & Eislöffel (2004) and Kenyon et al. (2005). Low- and medium-resolution spectroscopic observations are available for a subsample of low-mass stars and brown dwarfs (Béjar et al. 1999; Barrado y Navascués et al. 2001, 2003; Martín et al. 2001; Zapatero Osorio et al. 2002; Kenyon et al. 2005; Burningham et al. 2005).

We constructed our optical catalogue by including all stars from the above-mentioned studies, plus a few additional H emission line stars from Weaver & Babcock (2004) and the hot stars from the studies of the Orion OB association by Warren & Hesser (1977) and Brown et al. (1994). After cross-correlating the data from the available studies, we obtain a total of 266 stars falling in the XMM field of view. About 40% of the late-type stars in the catalogue have spectroscopic membership information based on radial velocity, lithium or other youthness indicators. For the remaining stars only photometry or at most H measurements are avalaible: in these cases, we have assigned a photometric membership based on their position in different colour-magnitude diagrams, rejecting as members those stars falling below the 10 Myr isochrone in at least two diagrams. For stars without a spectroscopically-determined spectral type, we derived spectral types from their , or colours using the transformations by Kenyon & Hartmann (1995) and Leggett et al. (2001). In total, there are 218 probable or candidate members in our catalogue, including 8 early-type (O-B-A) stars, two late F-G type stars, 143 K- and early M-type stars (M4), and 65 very-low mass stars and brown dwarfs with spectral type later than M5111Note that, at the age of Ori, the substellar limit lies around spectral type M5–M6, depending on the adopted model isochrones (see e.g. Zapatero Osorio et al. 2002).
Most of the stars in our optical catalogue have counterparts in the 2MASS All-Sky Point Source Catalogue (Cutri et al. 2003): for these stars we used their 2MASS coordinates in order to have accurate positions.
| NX | RAX | DECX | Sign. | Count rate | 2MASS | |||
|---|---|---|---|---|---|---|---|---|
| (J2000) | (cts/ks) | () | ||||||
| 14 | 5:38:15.63 | 2:42:05.5 | 12.9 | J05381552-0242051 | 0.36 | 16.33 | ||
| 42 | 5:38:31.07 | 2:34:02.8 | 7.0 | J05383098-0234038 | 1.00 | 14.92 | 0.91 | |
| 50 | 5:38:33.05 | 2:39:27.2 | 8.2 | J05383302-0239279 | 1.30 | 14.59 | 0.89 | |
| 91 | 5:38:48.47 | 2:36:42.3 | 6.6 | J05384828-0236409 | 1.86 | 12.04 | 0.90 | |
| 101 | 5:38:50.97 | 2:27:44.4 | 6.4 | J05385101-0227456 | 2.35 | 14.28 | 0.95 | |
| 103 | 5:38:51.80 | 2:36:02.6 | 28.2 | J05385173-0236033 | 0.84 | 12.91 | 0.88 | |
| 116 | 5:38:59.13 | 2:34:15.5 | 7.7 | J05385884-0234131 | 3.71 | 15.86 | 0.97 | |
| 148 | 5:39:13.58 | 2:37:37.8 | 10.4 | J05391346-0237391 | 1.31 | 13.41 | 0.91 | |
| 151 | 5:39:15.89 | 2:36:49.7 | 7.4 | J05391582-0236507 | 1.15 | 13.25 | 1.03 | |
| 153 | 5:39:17.12 | 2:41:17.6 | 22.7 | J05391699-0241171 | 0.59 | 14.29 | 0.92 | |
| 175 | 5:39:40.24 | 2:43:07.9 | 7.5 | J05393998-0243097 | 3.04 | 10.65 | 1.12 | |
| NX | RAX | DECX | Sign. | Count rate | Optical ID | Notes | |||
| (J2000) | (cts/ks) | () | |||||||
| 41 | 5:38:30.06 | 2:23:36.6 | 26.1 | r053829-0223 | 1.66 | 12.27 | 0.43 | ||
| 46 | 5:38:32.21 | 2:32:43.6 | 13.7 | GSC2 S02003215575 | 0.62 | ||||
| 47 | 5:38:32.70 | 2:31:16.1 | 6.4 | 2MASS J05383268-0231156 | 1.29 | ||||
| 56 | 5:38:34.30 | 2:34:59.9 | 21.9 | r053834-0234 | 1.63 | 13.88 | 0.43 | ||
| 114 | 5:38:57.20 | 2:31:25.5 | 7.2 | 4771-1071 | 1.74 | 12.10 | 0.40 | ||
| 119 | 5:38:59.61 | 2:45:08.6 | 38.3 | 4771-0026 | 0.68 | 11.69 | 0.34 | ||
| 120 | 5:38:59.65 | 2:35:27.9 | 9.1 | 2MASS J05385930-0235282 | 3.83 | ||||
| 123 | 5:39:01.19 | 2:33:37.8 | 13.8 | GSC2 S02003215312 | 4.70 | ||||
| 125 | 5:39:01.58 | 2:38:57.0 | 132.8 | HD 37525 | 0.67 | 8.07 | |||
| 169 | 5:39:30.72 | 2:38:28.7 | 10.1 | SWW 222 | 1.93 | 15.30 | 1.32 | ||
| : probable non member on the basis of photometry | |||||||||
| : non member from proper motion (Warren & Hesser 1977) | |||||||||
| : non member from radial velocity (Burningham et al. 2005) | |||||||||
2.2 Source identification
In order to find optical counterparts to our X-ray source list, we have determined the optimal search radius by constructing the cumulative distribution of the offsets between X-ray and optical position, following Randich & Schmitt (1995). We chose a search radius of , for which less than two spurious identifications are expected. After correlating the X-ray source list with the optical catalogue, we found a median offset of in right ascension between the X-ray and optical positions; we therefore corrected the X-ray positions, and repeated the identification process. We found 88 sources with at least one cluster member or candidate within (including two double identifications); these sources are listed in Table A together with their optical properties. The position of detected members in the and colour-magnitude diagrams are shown in Fig. 2. X-ray detections delineate very clearly the cluster sequence, confirming the importance of X-ray emission as a membership indicator for young stars.
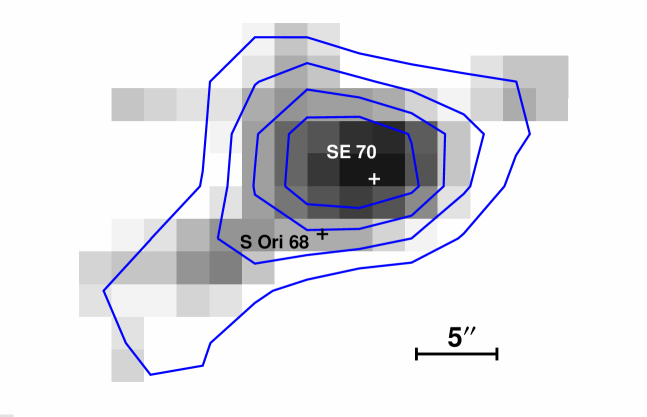
Of the detected members, three are OB stars, i.e. Ori AB (O9.5V), Ori E (B2Vp) and HD~294272 (B9.5III), and one is an A8V star (HD~37564). We have detected the two FG-type stars, % of K-type stars and % of early-M stars ( M5). Seven sources (%) have been identified with very low-mass stars and brown dwarfs of spectral type later than M5. However, in two cases, the identification is ambiguous, since there is another early-M star falling inside the identification radius. One of these cases is source NX 67, which is identified with SE 70 ( M4) at , and S Ori~68, a planetary-mass object of spectral type L5.0 (Béjar et al. 2001), at a distance of . This source underwent a flare during the observation, with an increase in the count rate by a factor of and a total duration of ks (see Sect. 3.2, Fig. 7). Inspection of the X-ray image (Fig. 3) shows that the bulk of the X-ray emission, and therefore the flare, is associated with SE 70, although we cannot exclude the presence of a very weak contribution from S Ori 68 itself. Unfortunately the statistics outside of the flare is too low to allow us to derive any information on the relative contribution of the two objects to the quiescent X-ray source. In the analysis of Sect. 3.1 we have therefore assigned all the X-ray flux to SE 70, while taking for S Ori 68 the same value as upper limit to its emission.
The other source with two possible counterparts is NX 167, which has been identified with S Ori~J053926.8-022614, a M6 star, at 3.9, and SE 94 ( M2) at 3.2. In this case, it is not possible to identify which star is the most probable X-ray emitting one; we have therefore equally divided the X-ray flux between them.
The faintest star with a certain X-ray detection is the candidate brown dwarf S Ori~25, which has a spectral type M7.5 (Barrado y Navascués et al. 2003) and an estimated mass of (Muzerolle et al. 2003). Its X-ray luminosity in the 0.3–8 keV band is erg s-1 (see Sect. 3.1), corresponding to , i.e. close to the saturation limit.
For the remaining 124 late-type (F to M) cluster members and candidates with no associated X-ray source we determined 3 upper limits at the optical positions using the Wavelet algorithm. Their X-ray and optical properties are given in Table A.
Six additional X-ray sources have been identified with probable cluster non members from our optical catalogue, including an early-type star (HD 37525, B5V) which was rejected as member of the OB association by Warren & Hesser (1977) on the basis of proper motion. Interestingly, this source underwent a flare at the end of the observation, after hrs of quiescent emission; an analysis of its quiescent PN spectrum shows high temperatures (0.6 and 1.3 keV), similar to those found for the B2Vp star Ori E (Paper I) and for late-type stars (see Sect. 4), suggesting that the emission might originate from an unseen late-type companion. Of the other non members, one (SWW 222) has a radial velocity inconsistent with cluster membership (Burningham et al. 2005), while the others have been rejected on the basis of photometry only. These X-ray sources are listed in Table 2.
In order to increase the number of identifications, we have also cross-correlated the X-ray source list with the 2MASS and the GSC2.2 catalogues, finding 13 counterparts from 2MASS and 2 from GSC2. Eleven of the 2MASS counterparts have photometry consistent with cluster membership, and are therefore considered as possible candidate members of the cluster; we list them in Table 1. The other identified X-ray sources are given in Table 2.
For the remaining 66 sources (listed in Table B) we did not find any known counterpart in any astronomical catalogue. This number is consistent with the expected number of extragalactic X-ray sources () in the direction of Ori, derived using the relations by Hasinger et al. (2001) and Tozzi et al. (2001).

3 Results
3.1 X-ray luminosities
In order to derive X-ray luminosities, we have computed a conversion factor in the 0.3–8 keV band using the results of the PN and MOS1 spectral fits of late-type stars (see Sect. 4). The conversion factor has been determined by comparing the count rates obtained from the Wavelet algorithm on the summed dataset with the unabsorbed X-ray flux derived from the best-fit models, excluding the few sources with absorption higher than the mean value cm-2, derived from the mean reddening (Lee 1968; Brown et al. 1994), and then taking the median value. The derived conversion factor, valid for the summed and MOS datasets, is CF erg cm-2 cnt-1, with an uncertainty of % ( standard deviation). For the source detected only in the PN we derived in the same way a median conversion factor CF erg cm-2 cnt-1 for the PN count rates. We applied these factors to all stars for which no spectral analysis can be performed, assuming that all of them have the mean absorption, since individual absorption measures are generally not available. For stars having cm-2, as found for some sources, this will underestimate the X-ray luminosity by a factor of . For the stars with spectral fits (Table 3 and Paper I) we used instead the fluxes determined from the PN or MOS1 (if PN is not available) best-fit models. Finally, X-ray luminosities have been derived using the Hipparcos cluster distance of 352 pc.
The sensitivity in the center of the field (from 3 upper limits) is erg s-1, and decreases to erg s-1 at 13 offaxis, and to erg s-1 where only MOS is present.
Fig. 4 shows and as a function of the colour for cluster members and candidates. For early-type stars, we find for the O9.5 star Ori AB, consistent with the typical value () found for hot stars (Pallavicini et al. 1981; Berghöfer et al. 1997), while for the other early-type stars and for the F7 star. For late-type stars there is a general trend of decreasing with increasing colour, although there is a scatter of more than one order of magnitude at each colour. Correspondingly, is nearly constant, as observed in other young clusters and star-forming regions (SFRs; e.g. Feigelson et al. 2002; Flaccomio et al. 2003b, d). The median value is for detected stars, and taking into account also upper limits, i.e. very close to the saturation limit. This value is consistent with the results obtained for other SFRs of similar age (e.g. Flaccomio et al. 2003d). There are a few stars lying significantly above the saturation value : this is generally due to the presence of flares or to strong variability during the observation.
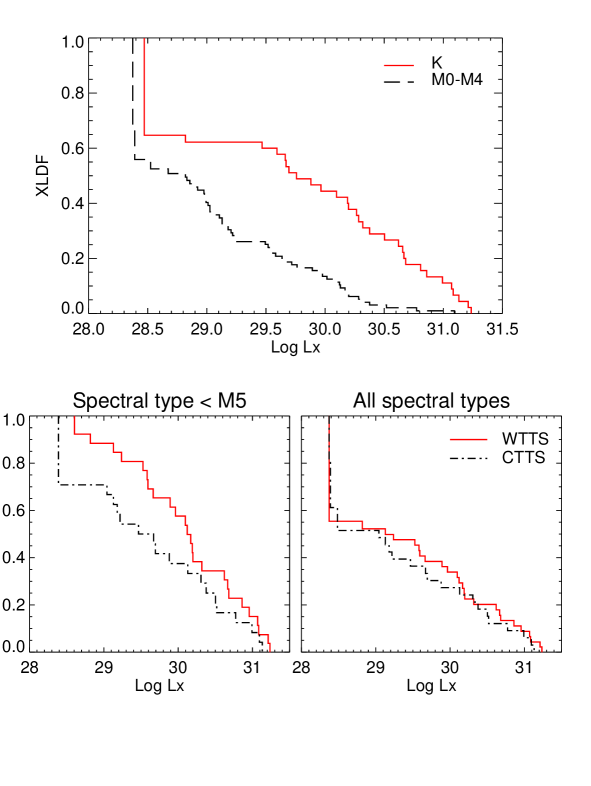
In Fig. 5 we show the X-ray luminosity distribution function (XLDF) for K and early-M stars (upper panel). The XLDF confirms the decrease of X-ray luminosity with spectral type: K-type stars are clearly more luminous than M-type stars, with a median erg s-1 for K stars, an order of magnitude higher than the median erg s-1 for M-type stars.
For the subsample of stars with available H measurements we also compared the XLDFs for classical (CTTS) and weak-lined (WTTS) T Tauri stars. We have classified stars as CTTS or WTTS using the H EW criterium derived by Barrado y Navascués & Martín (2003), which depends on spectral type. In the bottom panels of Fig. 5 we plot the XLDFs for CTTS and WTTS separately for stars ealier than M5, and for stars and brown dwarfs of all spectral types. In the first case, the two distributions are clearly different, with a median erg s-1 for WTTS and erg s-1 for CTTS. As a check, we have performed a series of two-sample tests, as implemented in asurv Rev. 1.1 (Lavalley et al. 1992), finding a probability that the two distributions are drawn from the same population. If one considers all stars and brown dwarfs, the two distributions do not appear to be significantly different, although CTTS are still a factor of less luminous (median ) than WTTS (median ). In this latter case the two-sample tests are inconclusive, giving . The different results found in the two cases can be attributed to the higher number of upper limits in the full sample of stars and brown dwarfs: in fact, for spectral types later than M5 we detected only one CTTS out of 9 and none of the 19 WTTS, compared with a detection rate of 18/24 ( 75%) and 24/27 ( 90%) for CTTS and WTTS earlier than M5, respectively.
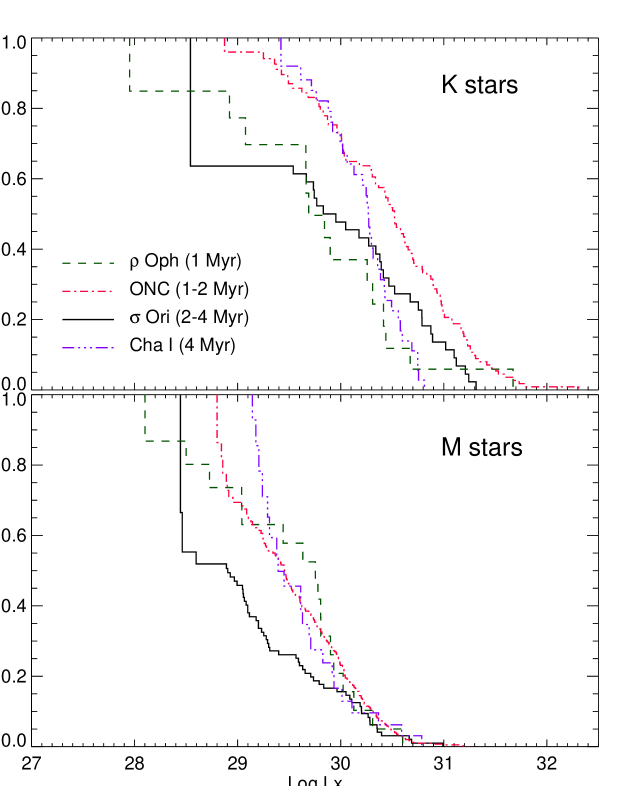
In Fig. 6 we compare the XLDFs of K and M-type stars of Ori with those of other SFRs and associations of similar age. We have used for the comparison the data of $ρ$~Oph (1 Myr), Orion Nebula Cluster (ONC, 1–2 Myr) and Chameleon~I (4 Myr) reanalyzed by Flaccomio et al. (2003d, see their paper for details). Since the luminosities derived by these authors are in the 0.1–4 keV band, we have computed an appropriate conversion factor using the same procedure described above, in order to derive luminosities in the same band. We find that, for K-type stars, the high-luminosity tail () is intermediate between that of ONC and those of Oph and Cha I, and the median luminosity appears to be significantly lower than ONC and Cha I (by a factor of ), but comparable to that of Oph. The two sample tests indicate that the XLDF is significantly different from that of ONC () but are inconclusive in the other cases. On the other hand, for M-type stars the high-luminosity tails of all the SFRs are comparable, but the median for Ori () is significantly lower than those of all the other SFRs (); the two-sample tests confirm that the XLDFs are not drawn by the same population, giving in all cases .


3.2 Variability
Light curves for all detected members or candidates have been extracted from the photon event lists using circular regions of radius centered on the source position, except for a few cases where we used smaller radii to avoid overlap with nearby close sources. Inspection of the light curves reveals that many of the detected members or candidates show significant variability during our observation, including the strong X-ray flare detected on the B2Vp star Ori E and discussed in Paper I. In order to quantify the variability of the sources, we have performed a Kolmogorov-Smirnov test on the unbinned photon arrival times, using data from PN, or from MOS for sources falling on PN CCD gaps or outside of the PN field of view. We find that % (29/84) of late-type members are variable at the 99% confidence level, and other 7 stars (8%) are possibly variable at the 95% level. In particular, 47% of the CTTS and 54% of the WTTS are variable at the 99% level. In addition, variability at the 99% level is detected in two of the 2MASS candidates of Table 1. Ten late-type sources show clear flares, including one of the 2MASS candidates, with increases in the count rates by factors of in hours and decay times of hours. The combined PN+MOS1+MOS2 light curves of these flaring sources (espressed as MOS equivalent count rates) are shown in Fig. 7. The other variable sources show generally low-level flare-like variability or slow variations. In Fig. 8 we show some examples of light curves of sources with strong variability not clearly attributable to flares. One source (NX 76) shows a steady decay by a factor of during the entire observation, that could be attributed either to the decay of a long-lasting flare or to rotational modulation. Sources NX 62 and NX 64 have very high temperatures (see Table 3), but their light curve does not show the typical behaviour of flares: in both cases a steady emission level for a few hours is observed after a slow rise or before a slow decay. A similar behaviour is observed for NX 79. All these light curves could be interpreted as due to rotational modulation of the emission from active, possibly flaring regions unevenly distributed on the stellar surface (Stelzer et al. 1999). A more evident modulation effect is instead present in source NX 70 (source #4 in Paper I), which shows two peaks followed by a similar decay trend. A fit of the light curve with a simple sinusoidal model gives a period of hours, with an amplitude variation of % around the mean. The folded light curve is shown in the bottom right panel of Fig. 8, where we have marked with different symbols data points belonging to different periods: there is a perfect overlap between the light curves in the two periods. We caution, however, that, having data available only for slightly more than one period, these results are not conclusive, and we cannot completely exclude that the observed variability is due to the occurrence of two similar flaring events rather than to rotational modulation.
4 Spectral analysis
For the detected cluster members or candidates having at least 500 cts in the PN or MOS1 we performed spectral analysis. We excluded sources falling on CCD gaps, that have an effective low number of counts despite their derived high count rate from the wavelet detection. A detailed PN and MOS spectral analysis of the four bright central sources has already been performed in Paper I; however, we have reanalyzed the spectra of the two central K-type stars (NX 65 source #3 of Paper I, and NX 70 source #4) in order to compare in a consistent way their properties with those of the other late-type sources discussed in this paper.
PN and/or MOS1 spectra have been extracted from the same circular regions used for the light curves. Background spectra for each source were extracted from a nearby circular region free from other X-ray sources and on the same CCD chip, using the same extraction radius as the corresponding source region. Response matrices and ancillary files were generated for each source using the standard SAS tasks rmfgen and arfgen. Spectra have been rebinned to have at least 20 counts per bin, and were fitted in XSPEC v.11.3.0 in the energy range keV, using a two-temperature APEC v.1.3.0 model with variable global abundance. For most of the weakest sources with cts, acceptable fits were found with only one temperature component. The hydrogen column density was generally kept fixed at the value cm-2, derived from the measured reddening . In a few cases however this led to an unacceptable fit at low energies, and therefore we left the column density as a free parameter, obtaining best-fit values of cm-2 for quiescent sources, i.e. higher by about one order of magnitude, and even higher values ( cm-2) for three flaring sources. We note that the eight sources needing a higher column density are either CTTS or stars with known IR excess; the only exception is source NX 145, identified with the star 4771-1038, a WTTS with no IR excess (Oliveira et al. 2004).
| NX | /dof | Inst. | CTT/ | Notes | |||||||
| (keV) | ( cm-3) | WTT | |||||||||
| 2 | 0.56/59 | 9.10 | M | CTT? | |||||||
| 3 | 0.62/74 | 11.55 | M | WTT? | |||||||
| 7 | 0.67/34 | 3.99 | P | CTT | flare | ||||||
| 8 | 0.63/80 | 3.05 | P | ||||||||
| 0.97/24 | 2.64 | M | |||||||||
| 34 | 0.51/21 | 0.61 | P | ||||||||
| 39 | 0.59/39 | 0.82 | P | ||||||||
| 49 | 0.64/60 | 1.24 | P | ||||||||
| 61 | 0.47/19 | 1.60 | P | CTT | IR exc.,flare | ||||||
| 62 | 0.50/80 | 8.14 | M | WTT | |||||||
| 64 | 0.57/131 | 2.82 | P | WTT | no IR exc. | ||||||
| 6.59 | 0.51/40 | 2.53 | M | ||||||||
| 65 | 0.69/298 | 7.89 | P | WTT | |||||||
| 0.74/111 | 9.49 | M | |||||||||
| 69 | 0.62/43 | 2.22 | P | CTT | IR exc. | ||||||
| 70 | 0.81/283 | 6.60 | P | CTT | |||||||
| 0.68/95 | 7.25 | M | |||||||||
| 76 | 0.70/70 | 1.29 | P | ||||||||
| 0.42/20 | 1.29 | M | |||||||||
| 78 | 0.67/133 | 3.23 | P | WTT | |||||||
| 0.89/40 | 3.05 | M | |||||||||
| 79 | 0.72/177 | 4.32 | P | ||||||||
| 0.88/52 | 4.05 | M | |||||||||
| 81 | 0.62/57 | 1.60 | P | flare | |||||||
| 90 | 0.56/181 | 10.91 | P | WTT | IR exc. | ||||||
| 0.73/66 | 12.07 | M | |||||||||
| 92 | 0.70/54 | 1.07 | P | ||||||||
| 93 | 0.51/74 | 1.36 | P | CTT | no IR exc. | ||||||
| 0.45/22 | 1.41 | M | |||||||||
| 104 | 0.37/28 | 1.04 | P | WTT | |||||||
| 106 | 0.56/31 | 0.89 | P | WTT | |||||||
| 109 | 0.74/58 | 4.86 | M | WTT | flare | ||||||
| 110 | 0.68/20 | 3.12 | M | WTT | |||||||
| 122 | 0.44/26 | 0.62 | P | WTT? | |||||||
| 132 | 0.40/30 | 0.84 | P | WTT | no IR exc. | ||||||
| 138 | 0.68/42 | 2.14 | P | CTT? | |||||||
| 145 | 0.44/36 | 1.40 | P | WTT | no IR exc. | ||||||
| 149 | 0.51/19 | 0.99 | P | WTT | IR exc.?,flare | ||||||
| 150 | 0.69/22 | 0.59 | P | A8V | |||||||
| 156 | 0.81/38 | 1.29 | P | ||||||||
| 170 | 0.34/24 | 1.03 | P | ||||||||
| 172 | 0.85/105 | 6.07 | P | WTT | G5, no IR exc. | ||||||
| 174 | 0.54/24 | 8.38 | P | CTT | IR exc.,flare | ||||||
| : hydrogen column density in units of cm-2. Where no value is given, it was kept fixed at cm-2 | |||||||||||
| : unabsorbed X-ray flux in the keV band, in units of erg cm-2 s-1 | |||||||||||
| : instrument from which the spectrum was extracted (P for PN, M for MOS1) | |||||||||||
| : was kept fixed to the PN fit value since it was not constrained by the MOS1 fit | |||||||||||


The resulting best-fit parameters are given in Table 3, and a sample of the spectra together with the best-fit models are shown in Fig. 9 for quiescent sources (with high and low absorption) and in Fig. 10 for the three flaring CTT stars with higher absorption. We find typical quiescent temperatures of keV and keV, in agreement with the results found for other young clusters and SFRs (e.g Feigelson & Montmerle 1999). In two cases (NX 62 and NX 64) temperatures up to keV are found, although it is not clear from their light curves whether these sources are flaring during the observation (see Fig. 8). Emission measures range between and cm-3, with . In all cases we find subsolar abundances, with most stars having , as commonly observed in active stars. Somewhat higher abundances () are found for three flaring sources. For the small subsample of WTTS and CTTS we find no significant difference in the coronal parameters of the two classes: in particular we do not find the higher spread in CTTS abundances with respect to WTTS found in L1551 by Favata et al. (2003).
Particularly interesting is source NX 174, identified with V603~Ori, a Class II star with strong IR excess and source of the protostellar jet HH 445 (Oliveira & van Loon 2004). This source underwent a strong flare during the observation: the spectrum is quite hot, with keV, showing an evident Fe 6.7 keV line, and the emission is strongly suppressed below 1.5 keV, implying a column density cm-2, i.e. two orders of magnitude higher than the mean cluster absorption.
5 Discussion and conclusions
In this paper we have presented the spatial analysis of an XMM-Newton observation of the Ori cluster centered on the hot star Ori AB. We have detected half of the early-type (O-A) stars, including Ori AB, 65% of F-K stars and 50% of early M (i.e. M0–M4) stars above a detection limit of erg s-1. Our detection rates for late-type stars are lower than what observed in other SFRs and very young clusters, where % of late-type stars are generally detected above similar levels (e.g. Garmire et al. 2000; Preibisch & Zinnecker 2001; Flaccomio et al. 2003a, d). A possible explanation for this discrepancy might be contamination of our optical sample by non-members. While other regions have well established membership lists, in the case of Ori only % of the candidate and probable members have been confirmed spectroscopically. On the other hand, it is well known that PMS stars are powerful X-ray emitters, with luminosities times higher than older late-type stars (Feigelson & Montmerle 1999), and the presence of strong X-ray emission is generally used to identify new members of SFRs and young clusters. It is therefore likely that most of the undetected candidates might turn out to be older field stars rather than young cluster members. In particular, there are 45 undetected cluster candidates that have been selected on the basis of photometry only: if most, or all, of them were indeed non-members, we would raise the detection rate of late-type stars to %, bringing our results in agreement with other observations. Optical spectroscopic observations are needed (and in fact have been recently obtained by us using the multi-object spectrograph FLAMES at the VLT; data analysis is in progress) in order to determine the membership status of these stars and to check whether the lower detection rate found in Ori is due to the inclusion of non-members in the sample, or it reflects a true difference from other SFRs.
We have found that for late-type stars declines towards later spectral types, while is nearly constant, as commonly observed in other young clusters and SFRs. The spread of orders of magnitude observed at all colours in both and is consistent with earlier results (e.g. Feigelson & Montmerle 1999; Preibisch & Zinnecker 2002). The median is , i.e. very close to the saturation limit. This value is higher than the value of generally found for young ( Myr) SFRs (Preibisch & Zinnecker 2001; Feigelson et al. 2002, 2003; Skinner et al. 2003; Flaccomio et al. 2003d), but is consistent with the observed increase of with age for stars with , reaching the saturation value of at Myr (Flaccomio et al. 2003d; Stelzer et al. 2004).
The comparison of the XLDFs of Ori late-type stars with those of other SFRs of similar age shows that the median X-ray luminosity of Ori late-type stars is significantly lower than the other SFRs. Our results appear to be in disagreement with Flaccomio et al. (2003d), who found no evidence for a significant evolution of the median X-ray luminosity of pre-main sequence stars with up to Myr. However, this disagreement could be significantly reduced, or removed, if we consider the higher percentage of upper limits in our sample and the likely contamination by non-members, as discussed above. For example, if we exclude all undetected candidate members with only photometry available, the XLDF of Ori becomes similar to the other ones, in agreement with the lack of PMS evolution found by Flaccomio et al. (2003d).
About 40% of the detected members show significant variability, with % undergoing strong flares during our observation. Strong variability is commonly observed in up to 50% of PMS stars in SFRs and very young clusters. The frequency of flares is comparable to what found e.g. in IC~348 (Preibisch & Zinnecker 2002), NGC~1333 (Getman et al. 2002) and NGC~2264 (Ramírez et al. 2004), but it is much lower than in Oph, where % of T Tauri stars were found to be flaring by XMM-Newton in an observation of comparable duration (Ozawa et al. 2005). In addition to typical stellar flares, with a rapid rise followed by a slow decay, some sources show slower systematic variations, with some evidence for periodic variability, as observed also in other SFRs (Preibisch & Zinnecker 2002; Skinner et al. 2003): such variations have been generally attributed to the effect of rotational modulation of active regions coming in and out of view as the star rotates (see, e.g. Stelzer et al. 1999).
Spectral analysis of the brightest sources indicates that the coronae of late-type stars in the Ori cluster have typical temperatures of keV and keV, with emission measure ratios of . In a few cases temperatures up to 7 keV have been found even in the absence of clear flares. Our results are in very good agreement with the coronal temperatures generally found in SFRs (Feigelson & Montmerle 1999; Imanishi et al. 2002; Favata et al. 2003; Preibisch & Zinnecker 2004; Stelzer et al. 2004). In addition, we find for most stars a strongly subsolar metallicity (), consistent with the results found in other SFRs (Imanishi et al. 2002; Favata et al. 2003; Ozawa et al. 2005), and in active late-type coronae.
A long debated question in the study of PMS stars is whether there is a difference between the X-ray properties of CTTS and WTTS, i.e. whether X-ray emission is influenced by the presence of an accretion disk. Observations of SFRs have shown no significant difference in the X-ray luminosity of CTTS and WTTS when using as a discriminant the presence of infrared excess, indicative of a circumstellar disk (Preibisch & Zinnecker 2001; Getman et al. 2002; Feigelson et al. 2002, 2003; Gagné et al. 2004), while CTTS appear to be significantly less luminous than WTTS when using accretion indicators such as H or CaII emission (Stelzer & Neuhäuser 2001; Preibisch & Zinnecker 2002; Flaccomio et al. 2003c; Feigelson & Lawson 2004; Stassun et al. 2004). The latter results are confirmed by our observations: using a selection in terms of H emission, we find in fact that the X-ray emission from CTTS is significantly weaker than WTTS.
For the small subsample of bright WTTS and CTTS for which we were able to perform spectral analysis, we find no significant difference in the temperatures and metallicity of the two classes. Both CTTS and WTTS show temperatures up to keV, and metallicities . In L1551 Favata et al. (2003) found similar temperatures but a higher metallicity spread in CTTS with respect to WTTS, which is not confirmed by our data. We stress, however, that both their sample and ours are very small, preventing us to draw definite conclusions on possible abundance differences between the two classes. The high temperatures we find for CTTS are in constrast with the results obtained from high-resolution observations of TW~Hya, whose corona shows a very low temperature ( MK) and high density ( cm-3) that have been interpreted as due to X-ray emission from an accretion shock (Kastner et al. 2002; Stelzer & Schmitt 2004); however, other high-resolution observations of CTTS have shown the presence of hotter plasma (Schmitt et al. 2005; Argiroffi et al. 2005; Pallavicini et al. 2005), similar to what found in WTTS (Kastner et al. 2004; Argiroffi et al. 2004; Scelsi et al. 2005), suggesting a magnetic origin for X-ray emission.
Finally, we clearly detected 5 very low-mass objects and brown dwarf candidates down to M7.5, with the possible detection of other two objects with ambiguous identification. X-ray luminosities range between and erg s-1, with . Two of the candidate brown dwarfs (S Ori~3 and S Ori 25) show significant variability, while a flare is detected in SWW~203 ( NX 147), a very-low mass star of spectral type M5 (Fig. 7). Several brown dwarfs and very-low mass stars have been detected in SFRs by ROSAT (Neuhäuser et al. 1999; Mokler & Stelzer 2002), Chandra (Imanishi et al. 2001; Preibisch & Zinnecker 2001; Feigelson et al. 2002; Gagné et al. 2004) and XMM-Newton (Stelzer et al. 2004; Ozawa et al. 2005), with erg s-1 and . Variability and flares, similar to those observed in late-type stars, have also been detected in several brown dwarfs. Our results are therefore consistent with previous observations.
Two of the very-low mass stars in our sample had been previously detected by ROSAT, i.e. S Ori 3 and S Ori J053926.8-022614 (Mokler & Stelzer 2002), with luminosities consistent with the ones derived here. We note however that S Ori J053926.8-022614 is very close to the M2 cluster member SE 94, and its identification is ambiguous: from the XMM-Newton data it is not possible to determine which of the two stars is really responsible for the X-ray emission (see Sect. 2.2). At the time of the ROSAT observation SE 94 was not known, and the observed X-ray emission was attributed entirely to S Ori J053926.8-022614.
To conclude, the XMM-Newton observations of the cluster around Ori reported in this paper are consistent with what is typically found in SFRs and very young clusters. The coronal temperatures, metallicities, ratios and variability of the PMS stars in the Ori cluster are similar to those typically observed in SFRs and clusters in the age range Myr. The median X-ray luminosity and the detection rate of late-type stars in Ori, however, are lower than in clusters of similar age, but this could be due to significant contamination by non-members. Although we found evidence of strong absorption in the spectra of some CTTS, and their X-ray luminosities are typically lower than those of WTTS, we do not find significant differences in the coronal temperatures and metallicities of CTTS with respect to WTTS. Our limited data sample does not support the view that CTTS as a class have all low coronal temperatures and high densities as found from high-resolution XMM-Newton and Chandra observations of the CTT star TW Hya. While the latter behaviour has been interpreted as due to an accretion shock, our sample shows evidence for surface magnetic activity in at least some CTTS, similarly to what is typically observed in WTT stars.
Acknowledgements.
We thank the anonymous referee for his/her comments, and E. Flaccomio for useful comments and discussions. EF and RP acknowledge partial support from Ministero dell’Istruzione, Università e Ricerca (MIUR). JSF acknowledges support by the ESA Research Fellows program. This publication makes use of data products from the Two Micron All Sky Survey, which is a joint project of the University of Massachusetts and the Infrared Processing and Analysis Center/California Institute of Technology, and of the Guide Star Catalogue-II, which is a joint project of the Space Telescope Science Institute and INAF-Osservatorio Astronomico di Torino.References
- Argiroffi et al. (2004) Argiroffi, C., Drake, J. J., Maggio, A., et al. 2004, ApJ, 609, 925
- Argiroffi et al. (2005) Argiroffi, C., Maggio, A., Peres, G., Stelzer, B., & Neuhäuser, R. 2005, A&A, 439, 1149
- Baraffe et al. (1998) Baraffe, I., Chabrier, G., Allard, F., & Hauschildt, P. H. 1998, A&A, 337, 403
- Barrado y Navascués et al. (2003) Barrado y Navascués, D., Béjar, V. J. S., Mundt, R., et al. 2003, A&A, 404, 171
- Barrado y Navascués & Martín (2003) Barrado y Navascués, D. & Martín, E. L. 2003, AJ, 126, 2997
- Barrado y Navascués et al. (2001) Barrado y Navascués, D., Zapatero Osorio, M. R., Béjar, V. J. S., et al. 2001, A&A, 377, L9
- Béjar et al. (2001) Béjar, V. J. S., Martín, E. L., Zapatero Osorio, M. R., et al. 2001, ApJ, 556, 830
- Béjar et al. (1999) Béjar, V. J. S., Zapatero Osorio, M. R., & Rebolo, R. 1999, ApJ, 521, 671
- Béjar et al. (2004) Béjar, V. J. S., Zapatero Osorio, M. R., & Rebolo, R. 2004, AN, 325, 705
- Berghöfer et al. (1997) Berghöfer, T. W., Schmitt, J. H. M. M., Danner, R., & Cassinelli, J. P. 1997, A&A, 322, 167
- Brown et al. (1994) Brown, A. G. A., de Geus, E. J., & de Zeeuw, P. T. 1994, A&A, 289, 101
- Burningham et al. (2005) Burningham, B., Naylor, T., Littlefair, S. P., & Jeffries, R. D. 2005, MNRAS, 356, 1583
- Caballero et al. (2004) Caballero, J. A., Béjar, V. J. S., Rebolo, R., & Zapatero Osorio, M. R. 2004, A&A, 424, 857
- Cutri et al. (2003) Cutri, R. M., Skrutskie, M. F., van Dyk, S., et al. 2003, 2MASS All-Sky Catalog of Point Sources
- Damiani et al. (1997) Damiani, F., Maggio, A., Micela, G., & Sciortino, S. 1997, ApJ, 483, 350
- ESA (1997) ESA. 1997, The Hipparcos and Tycho catalogues, ESA SP-1200
- Favata et al. (2003) Favata, F., Giardino, G., Micela, G., Sciortino, S., & Damiani, F. 2003, A&A, 403, 187
- Feigelson et al. (2002) Feigelson, E. D., Broos, P., Gaffney, J. A., I., et al. 2002, ApJ, 574, 258
- Feigelson et al. (2003) Feigelson, E. D., Gaffney, J. A., I., Garmire, G., Hillenbrand, L. A., & Townsley, L. 2003, ApJ, 584, 911
- Feigelson & Lawson (2004) Feigelson, E. D. & Lawson, W. A. 2004, ApJ, 614, 267
- Feigelson & Montmerle (1999) Feigelson, E. D. & Montmerle, T. 1999, ARA&A, 37, 363
- Flaccomio et al. (2003a) Flaccomio, E., Damiani, F., Micela, G., et al. 2003a, ApJ, 582, 382
- Flaccomio et al. (2003b) Flaccomio, E., Damiani, F., Micela, G., et al. 2003b, ApJ, 582, 398
- Flaccomio et al. (2003c) Flaccomio, E., Micela, G., & Sciortino, S. 2003c, A&A, 397, 611
- Flaccomio et al. (2003d) Flaccomio, E., Micela, G., & Sciortino, S. 2003d, A&A, 402, 277
- Gagné et al. (2004) Gagné, M., Skinner, S. L., & Daniel, K. J. 2004, ApJ, 613, 393
- Garmire et al. (2000) Garmire, G., Feigelson, E. D., Broos, P., et al. 2000, AJ, 120, 1426
- Getman et al. (2002) Getman, K. V., Feigelson, E. D., Townsley, L., et al. 2002, ApJ, 575, 354
- Hasinger et al. (2001) Hasinger, G., Altieri, B., Arnaud, M., et al. 2001, A&A, 365, L45
- Imanishi et al. (2001) Imanishi, K., Tsujimoto, M., & Koyama, K. 2001, ApJ, 563, 361
- Imanishi et al. (2002) Imanishi, K., Tsujimoto, M., & Koyama, K. 2002, ApJ, 572, 300
- Kastner et al. (2004) Kastner, J. H., Huenemorder, D. P., Schulz, N. S., et al. 2004, ApJ, 605, L49
- Kastner et al. (2002) Kastner, J. H., Huenemorder, D. P., Schulz, N. S., Canizares, C. R., & Weintraub, D. A. 2002, ApJ, 567, 434
- Kenyon et al. (2005) Kenyon, M. J., Jeffries, R. D., Naylor, T., Oliveira, J. M., & Maxted, P. F. L. 2005, MNRAS, 356, 89
- Kenyon & Hartmann (1995) Kenyon, S. J. & Hartmann, L. 1995, ApJS, 101, 117
- Lavalley et al. (1992) Lavalley, M., Isobe, T., & Feigelson, E. 1992, in Astronomical Data Analysis Software and Systems, ed. D. M. Worrall et al., ASP Conf. Ser. No. 25, 245
- Lee (1968) Lee, T. A. 1968, ApJ, 152, 913
- Leggett et al. (2001) Leggett, S. K., Allard, F., Geballe, T. R., Hauschildt, P. H., & Schweitzer, A. 2001, ApJ, 548, 908
- Martín et al. (2001) Martín, E. L., Zapatero Osorio, M. R., Barrado y Navascués, D., Béjar, V. J. S., & Rebolo, R. 2001, ApJ, 558, L117
- Mokler & Stelzer (2002) Mokler, F. & Stelzer, B. 2002, A&A, 391, 1025
- Muzerolle et al. (2003) Muzerolle, J., Hillenbrand, L., Calvet, N., Briceño, C., & Hartmann, L. 2003, ApJ, 266, 592
- Neuhäuser et al. (1999) Neuhäuser, R., Briceño, C., Comerón, F., et al. 1999, A&A, 343, 883
- Oliveira et al. (2002) Oliveira, J. M., Jeffries, R. D., Kenyon, M. J., Thompson, S. A., & Naylor, T. 2002, A&A, 382, L22
- Oliveira et al. (2004) Oliveira, J. M., Jeffries, R. D., & van Loon, J. T. 2004, MNRAS, 347, 1327
- Oliveira & van Loon (2004) Oliveira, J. M. & van Loon, J. T. 2004, A&A, 418, 663
- Ozawa et al. (2005) Ozawa, H., Grosso, N., & Montmerle, T. 2005, A&A, 429, 963
- Pallavicini et al. (2005) Pallavicini, R., Franciosini, E., Maggio, A., Scelsi, L., & Sanz-Forcada, J. 2005, Adv. Sp. Res., in press
- Pallavicini et al. (1981) Pallavicini, R., Golub, L., Rosner, R., et al. 1981, ApJ, 248, 279
- Preibisch & Zinnecker (2001) Preibisch, T. & Zinnecker, H. 2001, AJ, 122, 866
- Preibisch & Zinnecker (2002) Preibisch, T. & Zinnecker, H. 2002, AJ, 123, 1613
- Preibisch & Zinnecker (2004) Preibisch, T. & Zinnecker, H. 2004, A&A, 422, 1001
- Ramírez et al. (2004) Ramírez, S. V., Rebull, L., Stauffer, J., et al. 2004, AJ, 127, 2659
- Randich & Schmitt (1995) Randich, S. & Schmitt, J. H. M. M. 1995, A&A, 298, 115
- Sanz-Forcada et al. (2004) Sanz-Forcada, J., Franciosini, E., & Pallavicini, R. 2004, A&A, 421, 715
- Scelsi et al. (2005) Scelsi, L., Maggio, A., Peres, G., & Pallavicini, R. 2005, A&A, 432, 671
- Schmitt et al. (2005) Schmitt, J. H. M. M., Robrade, J., Ness, J.-U., Favata, F., & Stelzer, B. 2005, A&A, 432, L35
- Scholz & Eislöffel (2004) Scholz, A. & Eislöffel, J. 2004, A&A, 419, 249
- Sherry et al. (2004) Sherry, W. H., Walter, F. M., & Wolk, S. J. 2004, AJ, 128, 2316
- Siess et al. (2000) Siess, L., Dufour, E., & Forestini, M. 2000, A&A, 358, 593
- Skinner et al. (2003) Skinner, S., Gagné, M., & Belzer, E. 2003, ApJ, 598, 375
- Stassun et al. (2004) Stassun, K. G., Ardila, D. R., Barsony, M., Basri, G., & Mathieu, R. D. 2004, AJ, 127, 3537
- Stelzer et al. (2004) Stelzer, B., Micela, G., & Neuhäuser, R. 2004, A&A, 423, 1029
- Stelzer & Neuhäuser (2001) Stelzer, B. & Neuhäuser, R. 2001, A&A, 377, 538
- Stelzer et al. (1999) Stelzer, B., Neuhäuser, R., Casanova, S., & Montmerle, T. 1999, A&A, 344, 154
- Stelzer & Schmitt (2004) Stelzer, B. & Schmitt, J. H. M. M. 2004, A&A, 418, 687
- Tozzi et al. (2001) Tozzi, P., Rosati, P., Nonino, M., et al. 2001, ApJ, 562, 42
- Walter et al. (1997) Walter, F. M., Wolk, S. J., Freyberg, M., & Schmitt, J. H. M. M. 1997, Mem. Soc. Astr. It., 68, 1081
- Warren & Hesser (1977) Warren, W. H., J. & Hesser, J. E. 1977, ApJS, 34, 115
- Weaver & Babcock (2004) Weaver, W. B. & Babcock, A. 2004, PASP, 116, 1035
- Wolk (1996) Wolk, S. J. 1996, PhD thesis, Univ. New York at Stony Brook
- Zapatero Osorio et al. (2000) Zapatero Osorio, M. R., Béjar, V. J. S., Martín, E. L., et al. 2000, Science, 290, 103
- Zapatero Osorio et al. (2002) Zapatero Osorio, M. R., Béjar, V. J. S., Pavlenko, Y., et al. 2002, A&A, 384, 937
Appendix A X-ray and optical properties of cluster members and candidates
[x]rcrrlcrcclll
X-ray sources with at least one cluster member or
candidate within 5. NX is a running identification number for the
X-ray sources. The column labeled “Sign.” indicates the significance of
detection. Optical identifications are from the following sources: 4771-…,
r05…, p05… Wolk (1996); SE Scholz & Eislöffel (2004); SWW Sherry et al. (2004);
S Ori, J05… Béjar et al. (1999, 2001, 2004); Zapatero Osorio et al. (2002); Caballero et al. (2004): note
that we have dropped the S Ori prefix in front of the J05… names; K
Kenyon et al. (2005). The flag in the column labeled ”C/W” indicates whether the
star is a probable/possible CTTS or WTTS
NX RAX DECX Sign. Count
rate Optical ID
SpT C/
(J2000) (cts/ks) () W
\endfirstheadcontinued.
NX RAX DECX Sign. Count
rate Optical ID
SpT C/
(J2000) (cts/ks) () W
\endhead \endfoot
: spectroscopically-determined spectral types from
the literature are marked with an asterisk. The other spectral types have
been
estimated from the , or
colours using the relations by Kenyon & Hartmann (1995) and Leggett et al. (2001)
: unabsorbed X-ray luminosity in the keV
band. Values marked with a have been derived from the PN or MOS1
spectral fits
reported in Table 3 and in
Paper I
: source #3 in Paper I
: source #4 in Paper I
: source detected on the PN only. The reported count
rates are PN count rates. was derived using the conversion
factor for PN
(see Sect. 3.1)
\endlastfoot1 5:37:51.62 2:35:23.6 21.5 SWW 125 2.48 13.34 1.22 1.45 M2 30.02
2 5:37:53.03 2:33:33.7 104.9 4771-0775 1.65 10.69 0.42 0.70 K0∗ 31.13† C?
3 5:37:54.44 2:39:27.8 122.0 4771-0921 2.22 10.04 0.51 0.78 K0∗ 31.24† W?
4 5:38:00.85 2:45:09.4 17.2 SWW 140 2.93 14.54 1.77 1.81 M4 29.98
6 5:38:06.52 2:28:48.9 5.4 4771-0950 1.11 10.70 0.61 F7 28.82 W?
7 5:38:06.77 2:30:22.9 50.8 SWW 113 1.02 13.14 0.94 1.38 M0 30.77† C
8 5:38:07.94 2:31:31.0 102.3 4771-0854 0.38 11.45 0.64 0.88 K4 30.66†
9 5:38:08.33 2:35:57.5 20.4 SWW 41 1.29 13.76 1.32 1.62 M2 29.53 W?
11 5:38:13.22 2:26:07.9 9.1 SE 3 1.39 14.10 1.57 1.62 M3 29.20
17 5:38:17.88 2:40:49.4 9.1 J053817.8-024050 0.63 14.98 1.83 1.78 M4 28.98
19 5:38:18.39 2:35:38.0 9.9 J053818.2-023539 0.97 17.96 2.23 2.51 M5 28.97
20 5:38:20.29 2:38:01.3 15.7 J053820.1-023802 0.42 14.33 1.69 1.75 M4.0∗ 29.13 W
25 5:38:23.35 2:44:14.6 8.6 J053823.3-024414 1.10 15.19 1.73 1.73 M3 28.92
26 5:38:23.59 2:41:33.9 9.1 J053823.6-024132 2.28 14.93 1.81 1.64 M4 28.98
31 5:38:26.52 2:34:28.7 31.7 4771-1021 0.46 12.10 0.50 0.68 K2 29.66
32 5:38:27.22 2:45:09.1 24.2 4771-0041 2.03 12.82 0.82 0.87 K7.0∗ 29.67 C
33 5:38:27.62 2:35:02.6 7.0 J053827.5-023504 1.60 14.41 1.42 1.58 M3.5∗ 29.18 C
34 5:38:27.75 2:43:00.5 39.7 SWW 87 1.36 13.67 1.33 1.48 M3 29.96†
39 5:38:29.19 2:36:02.7 62.6 SWW 177 0.35 14.04 1.18 1.40 M2 30.08†
44 5:38:31.66 2:35:14.8 28.3 r053831-0235 0.18 13.49 1.11 1.97 M0.0∗ 29.58 W
49 5:38:32.97 2:35:39.6 74.7 r053832-0235b 0.59 12.88 0.83 1.34 K7 30.27†
52 5:38:33.36 2:36:17.6 22.1 SWW 130 1.42 13.47 1.26 1.42 M2 29.49
53 5:38:33.90 2:44:13.8 30.9 4771-1095 1.84 11.47 0.81 1.34 K5∗ 29.88 C
54 5:38:34.03 2:36:37.5 10.5 r053833-0236 1.84 13.72 1.52 1.74 M3.5∗ 29.04 C
55 5:38:34.20 2:34:15.5 39.7 HD 294272 4.54 8.57 B9.5∗ 29.76
60 5:38:35.74 2:31:52.2 59.6 r053835-0231 2.83 12.45 0.79 1.15 K5∗ 30.20 W
61 5:38:35.88 2:43:49.5 40.3 4771-1026 2.14 11.99 0.72 1.55 K3∗ 30.38† C
62 5:38:36.01 2:30:43.3 209.2 4771-1097 0.67 12.47 0.81 1.23 K6.0∗ 31.08† W
64 5:38:38.28 2:36:38.2 123.3 r053838-0236 0.60 12.38 0.86 1.22 K8.0∗ 30.62† W
65 5:38:38.54 2:34:55.5 252.1 4771-1147 0.75 10.88 0.65 0.97 K0∗ 31.07† W
67 5:38:39.13 2:28:00.4 9.7 SE 70 2.60 16.99 1.78 1.72 M4 29.11
S Ori 68 4.72 23.78 3.60 L5.0∗ W
68 5:38:39.76 2:40:19.5 10.4 p053839-0240 0.95 15.50 1.77 1.75 M4 28.98
69 5:38:40.35 2:30:17.5 62.6 r053840-0230 1.10 12.80 0.94 1.29 M0.0∗ 30.52† C
70 5:38:41.34 2:37:22.3 224.3 r053841-0237 0.78 12.77 0.87 1.31 K3∗ 30.99† C
71 5:38:41.46 2:36:43.7 9.2 p053841-0236 0.81 14.52 1.36 1.53 M3 29.03
75 5:38:43.38 2:32:00.5 12.5 SWW 144 0.88 14.12 1.75 1.88 M4 28.82
76 5:38:43.63 2:33:25.7 83.1 SWW 36 0.38 13.09 1.06 1.37 M1 30.28†
78 5:38:44.27 2:40:19.7 137.5 4771-1051 0.77 12.33 0.79 0.97 K7.5∗ 30.68† W
79 5:38:44.36 2:32:33.7 162.5 4771-1055 0.34 12.04 0.86 1.16 K8 30.81†
80 5:38:44.86 2:36:00.2 479.2 Ori AB 0.24 4.07 O9.5∗ 31.74†
81 5:38:45.40 2:41:59.7 72.1 SWW 97 1.00 13.46 1.16 1.47 M1 30.38†
82 5:38:46.10 2:45:25.1 5.4 J053845.9-024523 1.98 15.52 1.84 1.96 M4 28.86
84 5:38:47.26 2:35:39.9 312.7 Ori E 0.81 6.49 B2p∗ 31.46†
87 5:38:47.56 2:35:24.7 25.4 SWW 78 0.54 12.86 0.99 1.12 M1 29.76
88 5:38:47.99 2:37:19.7 25.0 SWW 102 0.55 13.02 1.18 1.00 K5∗ 29.59 W
89 5:38:48.05 2:30:39.3 5.5 S Ori 6 4.88 15.53 2.00 1.88 M5 28.83
90 5:38:48.18 2:27:13.3 166.7 4771-0899 1.14 11.35 0.82 1.19 K7.0∗ 31.21† W
92 5:38:48.76 2:36:16.7 59.5 SWW 35 0.51 13.37 0.87 1.26 M1 30.20†
93 5:38:49.26 2:38:23.5 93.0 r053849-0238 1.28 12.96 1.03 1.57 M0.5∗ 30.31† C
94 5:38:49.27 2:41:25.3 13.9 SWW 205 0.78 13.23 1.50 1.56 M3 28.99
97 5:38:49.90 2:41:23.4 15.2 SWW 200 0.75 14.21 1.37 1.46 M3 29.03
98 5:38:50.19 2:37:34.4 28.0 SWW 18 1.38 14.83 1.69 1.78 M4 29.56
100 5:38:50.54 2:26:47.0 7.6 SE 34 1.08 14.10 1.48 1.60 M3 29.01
102 5:38:51.53 2:36:20.7 39.7 r053851-0236 0.25 13.38 0.87 0.94 K9 29.69 C
104 5:38:52.07 2:46:43.9 52.2 4771-0080 0.57 12.78 0.80 1.26 K7 30.19† W
105 5:38:53.15 2:38:53.1 17.6 SWW 166 0.57 12.78 1.07 1.16 M1 29.23
106 5:38:53.20 2:43:53.5 55.5 SWW 47 1.24 13.49 1.08 1.26 M1 30.12† W
109 5:38:53.63 2:33:23.0 159.2 4771-1049 2.39 11.57 0.73 0.96 K5∗ 30.86† W
110 5:38:54.19 2:49:29.4 50.8 4771-0119 0.41 11.73 0.58 0.90 K2∗ 30.67† W
111 5:38:55.13 2:28:58.9 5.9 SE 77 1.79 15.50 1.76 1.70 M4 28.83
117 5:38:59.23 2:47:14.1 23.7 r053859-0247 0.82 12.36 0.69 1.04 K5 29.76
118 5:38:59.32 2:33:49.3 6.8 SWW 227 2.09 14.83 1.26 1.94 M0 28.39 C?
122 5:39:00.65 2:39:39.9 49.5 4771-1056 1.01 12.43 0.49 0.77 K1∗ 29.97† W?
124 5:39:01.24 2:36:39.2 11.1 K 9 0.38 15.11 1.56 1.59 M3 28.90
126 5:39:02.89 2:29:55.7 30.2 SWW 28 0.53 14.21 1.51 1.60 M3 29.72
131 5:39:05.30 2:33:00.2 7.2 SWW 175 0.64 15.02 1.55 1.63 M3 28.52
132 5:39:05.49 2:32:30.7 52.2 4771-1075 0.40 12.66 0.87 1.11 K7.0∗ 30.10† W
137 5:39:07.69 2:28:21.5 11.5 r053907-0228 1.92 14.37 1.45 1.49 M3.0∗ 29.24 W
138 5:39:07.77 2:32:39.7 56.0 4771-1092 1.24 12.63 0.81 1.33 K5∗ 30.50† C
140 5:39:09.21 2:39:59.4 5.0 S Ori 25 2.87 17.16 2.17 2.27 M7.5∗ 28.48 C?
144 5:39:11.66 2:31:06.0 26.6 SWW 195 0.98 13.45 0.95 1.46 K5∗ 30.13 C
145 5:39:11.74 2:36:03.3 60.8 4771-1038 0.54 12.93 0.95 1.31 K8∗ 30.32† W
147 5:39:12.74 2:30:07.7 12.0 SWW 203 4.95 14.69 2.00 2.08 M5 29.31
149 5:39:14.60 2:28:33.4 36.5 J053914.5-022834 0.55 14.85 1.52 1.51 M3.5∗ 30.17† W
150 5:39:15.18 2:31:37.9 39.4 HD 37564 0.52 8.17 0.19 A8∗ 29.94†
154 5:39:17.41 2:25:44.2 7.7 SE 51 2.28 14.18 1.15 1.28 M2 29.22 C?
156 5:39:18.22 2:29:28.7 58.9 4771-0598 0.85 11.41 0.47 0.69 K1 30.28†
157 5:39:18.97 2:30:55.6 15.1 4771-0910 2.53 12.58 0.84 1.18 K3∗ 29.47 C
159 5:39:20.62 2:27:37.8 26.1 J053920.5-022737 1.58 13.52 1.29 1.37 M2.0∗ 29.89 W
160 5:39:21.08 2:30:33.8 24.3 S Ori 3 0.44 15.40 1.98 2.11 M6 29.75
161 5:39:23.02 2:33:34.3 23.5 r053923-0233 1.56 14.19 1.21 1.36 M2.0∗ 29.66 W
164 5:39:24.48 2:34:02.7 16.9 SWW 127 1.39 14.28 1.25 1.30 M2 29.52
165 5:39:25.33 2:38:24.3 11.1 SWW 135 2.34 12.83 0.95 1.52 M0 29.13 C?
167 5:39:26.73 2:26:17.4 9.6 SE 94 3.18 14.81 1.17 2.37 M2 29.46
J053926.8-022614 3.92 18.66 1.41 M6
170 5:39:32.68 2:39:45.2 42.8 r053932-0239 1.23 12.23 0.81 1.41 M0 30.19†
172 5:39:36.77 2:42:17.4 72.8 r053936-0242 1.99 9.11 0.40 0.65 G5∗ 30.96† W
173 5:39:37.28 2:26:54.7 10.7 SWW 163 2.62 12.98 0.91 1.28 M0 29.64
174 5:39:39.96 2:33:16.8 40.3 V603 Ori 1.01 14.40 2.18 M2 31.09† C
[x]lccrccllrr
upper limits for undetected late-type cluster members
or candidates. Optical identifications are from the same sources as in
Table A, with the addition of two stars from Burningham et al. (2005, B)
Name RA DEC SpT C/ Count rate
(J2000) W (cts/ks)
\endfirstheadcontinued.
Name RA DEC I RI IJ SpT C/ Count rate
(J2000) W (cts/ks)
\endhead\endfoot
: see note to Table A
: upper limits higher than 10 cts/ks are due to the presence of a very close
bright X-ray source and are therefore
overestimated
: unabsorbed X-ray luminosity in the keV band
\endlastfoot4771-0961 5:38:02.21 2:29:55.6 12.99 0.69 1.16 K5 0.44 28.64
4771-0706 5:38:10.65 2:32:57.4 12.55 0.65 1.12 K4 0.32 28.50
r053812-0232 5:38:12.60 2:33:01.5 12.92 0.73 0.46 K6 0.30 28.47
r053838-0226 5:38:38.56 2:26:44.8 13.33 0.65 1.03 K4 0.37 28.56
p053834-0239 5:38:34.79 2:39:30.0 11.91 1.04 1.47 M1 0.47 28.67
p053834-0232 5:38:34.85 2:32:52.2 10.75 0.54 0.86 K3 0.37 28.56
4771-0740 5:38:39.62 2:26:49.7 12.04 0.52 0.82 K2∗ 0.37 28.56
4771-1030 5:38:44.80 2:33:57.6 11.09 0.67 1.08 K5 0.33 28.51
4771-1090 5:38:46.05 2:43:47.8 13.12 0.74 1.15 K6 0.35 28.54
4771-1057 5:38:48.53 2:44:17.8 12.25 0.51 0.77 K2 0.38 28.57
p053854-0240 5:38:54.35 2:40:03.0 16.05 1.58 1.74 M3 0.24 28.37
4771-0645 5:39:09.87 2:25:47.9 12.11 0.50 0.74 K2 0.49 28.68
4771-0668 5:39:11.21 2:25:49.1 11.76 0.57 0.80 K3 0.55 28.73
p053925-0231 5:39:25.34 2:31:43.7 13.75 0.81 1.32 K7 0.41 28.61
4771-0579 5:39:30.43 2:35:07.3 12.71 0.74 1.10 K5 0.46 28.66
p053933-0236 5:39:33.44 2:36:41.9 12.73 0.64 0.88 K4 0.48 28.67
p053938-0233 5:39:38.32 2:33:05.4 12.35 0.54 0.79 K3 C? 0.77 28.88
p053939-0231 5:39:39.82 2:31:21.8 12.89 0.76 1.05 K8∗ C 0.74 28.86
SE 5 5:38:14.30 2:25:05.5 17.52 1.57 1.65 M3 0.43 28.63
SE 14 5:38:23.33 2:25:34.6 15.69 1.53 2.01 M3 0.42 28.62
SE 16 5:38:23.77 2:22:39.8 18.76 2.09 1.82 M5 0.75 28.87
SE 39 5:39:02.29 2:23:47.3 18.01 1.93 1.76 M5 0.46 28.66
SE 56 5:38:49.64 2:45:26.9 14.85 1.56 1.61 M3 0.37 28.56
SE 97 5:39:27.73 2:28:08.4 18.48 M3 0.55 28.73
SWW 4 5:38:36.88 2:36:43.2 14.97 1.74 1.93 M4 0.39 28.58
SWW 7 5:39:25.61 2:34:04.2 14.96 1.75 1.76 M4 0.53 28.72
SWW 11 5:38:37.45 2:50:23.6 14.66 1.77 1.85 M4 1.48 29.16
SWW 15 5:38:43.87 2:37:06.8 14.80 1.79 1.96 M4 0.51 28.70
SWW 25 5:38:41.60 2:30:28.9 14.39 1.45 1.55 M3 0.53 28.72
SWW 29 5:38:47.19 2:34:36.8 14.64 1.45 M3 0.35 28.54
SWW 31 5:38:39.03 2:45:32.2 14.58 1.34 1.67 M3 0.39 28.58
SWW 40 5:38:18.25 2:48:14.3 14.15 1.39 1.39 M3 2.11 29.32
SWW 45 5:39:26.77 2:42:58.3 15.52 1.73 2.34 M5 0.68 28.83
SWW 48 5:38:42.28 2:37:14.8 13.06 0.98 1.29 M1 63.91 30.80
SWW 50 5:38:31.41 2:36:33.8 13.80 1.29 1.63 M2 C? 0.31 28.48
SWW 53 5:37:58.40 2:41:26.2 15.36 1.84 2.07 M4∗ 0.67 28.82
SWW 71 5:38:55.44 2:41:29.7 13.59 1.39 1.42 M3 0.24 28.37
SWW 77 5:39:02.98 2:41:27.2 14.11 1.29 1.67 M2 W? 0.47 28.67
SWW 79 5:38:39.65 2:30:21.1 14.85 2.42 M5 16.11 30.20
SWW 86 5:38:40.54 2:33:27.6 14.54 1.65 1.74 M4 0.28 28.44
SWW 88 5:38:05.67 2:40:19.4 14.07 1.27 1.30 M2 0.60 28.77
SWW 98 5:38:13.16 2:45:51.0 13.47 1.18 1.40 M2 C? 0.47 28.67
SWW 103 5:38:23.08 2:36:49.4 15.72 1.42 1.92 M4 0.26 28.41
SWW 122 5:39:03.57 2:46:27.0 14.37 1.45 1.53 M3 W? 0.41 28.61
SWW 129 5:39:08.78 2:31:11.5 14.97 1.63 1.93 M4 0.33 28.51
SWW 174 5:37:54.86 2:41:09.2 15.40 1.69 1.90 M4 0.97 28.98
SWW 181 5:37:52.21 2:33:38.0 14.41 1.33 1.48 M2 W 148.74 31.17
SWW 188 5:38:28.48 2:46:17.0 15.06 1.20 1.24 M2 0.63 28.79
SWW 226 5:38:18.17 2:43:34.8 16.00 1.52 1.32 M3 0.38 28.57
SWW 230 5:38:42.86 2:38:52.5 14.92 1.11 1.24 M2 0.27 28.42
SWW 232 5:38:19.33 2:32:04.2 15.99 1.29 M3 0.27 28.42
S Ori 1 5:39:11.83 2:27:41.0 15.08 1.70 1.47 M4 0.78 28.89
S Ori 2 5:39:26.33 2:28:37.7 15.26 1.80 1.76 M4 0.57 28.75
S Ori 4 5:39:39.32 2:32:25.2 15.23 2.16 1.79 M5 0.70 28.84
S Ori 5 5:39:20.24 2:38:25.9 15.40 1.86 1.79 M5 0.34 28.52
S Ori 7 5:39:08.22 2:32:28.4 15.63 2.07 1.83 M4-5 0.44 28.64
S Ori 8 5:39:08.09 2:28:44.8 15.74 1.87 1.60 M4 0.49 28.68
S Ori 11 5:39:44.33 2:33:02.8 16.39 2.04 2.10 M6.0∗ W? 0.98 28.98
S Ori 12 5:37:57.46 2:38:44.4 16.28 1.87 2.05 M6.0∗ W? 0.74 28.86
S Ori 14 5:39:37.60 2:44:30.5 16.75 1.94 2.37 M6 0.86 28.93
S Ori 15 5:38:48.10 2:28:53.6 16.39 1.97 1.92 M5.5∗ W? 0.38 28.57
S Ori 16 5:39:15.10 2:40:47.6 16.62 1.91 1.95 M5 0.30 28.47
S Ori 17 5:39:04.49 2:38:35.4 16.95 1.88 2.18 M6.0∗ W? 0.28 28.44
S Ori 18 5:38:25.68 2:31:21.7 16.61 1.91 1.94 M5 0.27 28.42
S Ori 21 5:39:34.33 2:38:46.9 17.25 2.02 2.43 M6 0.50 28.69
S Ori 22 5:38:35.36 2:25:22.2 16.88 2.04 2.24 M6.0∗ W? 0.49 28.68
S Ori 27 5:38:17.42 2:40:24.3 17.03 2.16 2.20 M7.0∗ W 0.30 28.47
S Ori 28 5:39:23.19 2:46:55.8 17.14 2.05 1.81 M5 0.71 28.84
S Ori 29 5:38:29.61 2:25:14.2 17.02 2.00 2.18 M6.5∗ C? 0.41 28.61
S Ori 30 5:39:13.08 2:37:50.9 17.29 1.71 2.05 M6∗ W? 1.18 29.06
S Ori 31 5:38:20.88 2:46:13.3 17.23 2.35 2.04 M7.0∗ W? 0.51 28.70
S Ori 35 5:37:55.60 2:33:05.3 17.61 2.25 2.39 M6 0.99 28.99
S Ori 36 5:39:26.85 2:36:56.2 17.71 1.88 2.25 M6 0.40 28.59
S Ori 39 5:38:32.44 2:29:57.3 17.67 2.09 2.23 M6.5∗ W? 0.31 28.48
S Ori 41 5:39:38.49 2:31:13.1 18.44 2.43 1.73 M6 0.65 28.81
S Ori 42 5:39:23.41 2:40:57.5 19.04 2.47 2.31 M7.5∗ C 0.37 28.56
S Ori 43 5:38:13.95 2:35:01.5 19.05 2.38 M7 3.71 29.56
S Ori 44 5:38:07.13 2:43:21.0 19.39 2.31 2.16 M7.0∗ W? 0.41 28.61
S Ori 47 5:38:14.62 2:40:15.4 20.49 2.40 2.96 L1.5∗ C? 0.28 28.44
S Ori 50 5:39:10.80 2:37:15.0 20.48 2.88 M9.0∗ W 0.40 28.60
S Ori 51 5:39:03.20 2:30:20.0 20.23 2.85 M9.0∗ C? 0.35 28.54
S Ori 53 5:38:25.10 2:48:03.0 21.17 3.28 M9.0∗ W 0.76 28.87
S Ori 58 5:39:03.60 2:25:36.0 21.90 3.30 L0.0∗ C? 0.42 28.62
S Ori 60 5:39:37.50 2:30:42.0 22.76 3.62 L2.0∗ C? 0.77 28.88
S Ori 62 5:39:42.10 2:30:31.0 23.03 3.58 L2.0∗ C? 0.86 28.93
S Ori 65 5:38:26.10 2:23:05.0 23.24 3.34 L3.5∗ W 0.51 28.70
S Ori 69 5:39:18.10 2:28:55.0 23.89 3.63 T0∗ 0.56 28.74
S Ori 70 5:38:10.10 2:36:26.0 25.03 4.75 T5.5∗ 0.34 28.52
S Ori 71 5:39:00.20 2:37:06.0 20.02 2.69 L0∗ C 0.24 28.37
J053805.5-023557 5:38:05.52 2:35:57.1 17.66 2.10 2.38 M6 0.36 28.55
J053811.9-024557 5:38:11.90 2:45:56.8 15.72 1.87 1.80 M5 0.48 28.67
J053816.0-023805 5:38:16.10 2:38:04.9 15.19 1.57 1.61 M4 0.81 28.90
J053820.5-023409 5:38:20.50 2:34:09.0 14.36 1.71 1.71 M4.0∗ C? 0.33 28.51
J053821.3-023336 5:38:21.38 2:33:36.3 17.58 2.13 2.22 M5 0.31 28.48
J053825.4-024241 5:38:25.43 2:42:41.3 16.86 1.80 1.98 M4 0.34 28.52
J053826.2-024041 5:38:26.23 2:40:41.3 16.93 2.13 2.02 M8.0∗ W? 0.24 28.37
J053826.8-022846 5:38:26.84 2:38:46.0 16.12 1.90 2.01 M5 0.25 28.39
J053829.0-024847 5:38:28.97 2:48:47.3 16.81 1.99 M6∗ W? 0.72 28.85
J053833.9-024508 5:38:33.88 2:45:07.8 15.98 1.89 1.73 M4 0.61 28.78
J053834.5-024109 5:38:34.60 2:41:08.8 14.72 1.46 1.62 M4 0.30 28.47
J053836.7-024414 5:38:36.69 2:44:13.7 14.32 1.76 1.78 M4 0.45 28.65
J053838.6-024157 5:38:38.59 2:41:55.9 16.52 1.82 1.96 M5 0.27 28.42
J053844.4-024037 5:38:44.48 2:40:37.6 17.28 2.32 2.48 M6 0.44 28.64
J053844.4-024030 5:38:44.49 2:40:30.5 15.02 1.49 1.66 M3 48.79 30.68
J053847.5-022711 5:38:47.54 2:27:12.0 14.46 1.74 M5.0∗ W 106.85 31.02
J053848.1-022401 5:38:48.19 2:44:00.8 16.13 1.91 2.06 M5 0.38 28.57
J053849.2-022358 5:38:49.29 2:23:57.6 16.27 1.74 1.91 M4.0∗ C 0.45 28.65
J053849.5-024934 5:38:49.50 2:49:34.0 20.08 2.80 M7 0.95 28.97
J053850.6-024244 5:38:50.61 2:42:42.9 15.84 1.85 2.00 M5 0.29 28.46
J053853.8-024459 5:38:53.82 2:44:58.9 17.78 2.08 2.33 M6 0.33 28.51
J053902.1-023501 5:39:01.94 2:35:02.9 16.41 1.96 M4 0.25 28.39
J053909.9-022814 5:39:10.01 2:28:11.6 16.48 1.63 1.88 M5.0∗ W? 0.41 28.61
J053911.4-023333 5:39:11.40 2:33:32.8 16.42 1.89 1.97 M5.0∗ W? 0.45 28.65
J053912.8-022453 5:39:12.89 2:24:53.8 19.42 2.61 M6.0∗ W 1.53 29.18
J053922.2-024552 5:39:22.25 2:45:52.4 17.05 1.73 M4 0.50 28.69
J053929.4-024636 5:39:29.40 2:46:36.0 19.73 2.55 M6 0.72 28.85
J053936.4-023626 5:39:36.40 2:36:26.0 18.46 2.52 M6 0.52 28.71
J053943.2-022343 5:39:43.19 2:32:43.3 14.70 1.64 1.67 M4 1.32 29.11
K 8 5:38:50.78 2:36:26.8 15.06 2.00 1.95 M4 4.98 29.69
K 50 5:38:51.00 2:49:14.0 16.79 1.79 1.75 M4 0.98 28.98
K 62 5:37:52.07 2:36:04.7 17.30 1.91 2.16 M5 0.70 28.84
K 65 5:38:39.76 2:32:20.3 17.58 1.89 2.69 M5 0.30 28.47
B 3.01-67 5:38:46.85 2:36:43.5 15.28 1.88 2.06 M5 0.53 28.72
B 2.03-233 5:39:40.58 2:39:12.3 17.29 1.60 1.89 M4 0.74 28.86
Appendix B Unidentified X-ray sources
[x]rccrr
X-ray sources with no known counterpart within
. Sources 59 and 130 have been detected on one MOS only.
The column labeled “Sign.” indicates the significance of detection
NX RAX DECX Sign. Count rate
(J2000) (cts/ks)
\endfirstheadcontinued.
NX RAX DECX Sign. Count rate
(J2000) (cts/ks)
\endhead \endfoot \endlastfoot5 5:38:03.76 -2:27:27.8 8.2 1.220.25
10 5:38:10.83 -2:35:59.6 7.3 0.650.14
12 5:38:13.86 -2:35:09.1 23.2 3.710.30
13 5:38:14.36 -2:32:39.2 7.1 0.780.16
15 5:38:16.99 -2:26:10.1 6.1 0.930.22
16 5:38:17.69 -2:40:00.4 5.7 0.390.11
18 5:38:17.84 -2:36:53.0 10.3 1.010.16
21 5:38:21.90 -2:24:25.6 15.6 4.330.51
22 5:38:22.22 -2:43:48.6 6.6 0.650.15
23 5:38:22.34 -2:28:50.1 16.1 2.300.26
24 5:38:22.72 -2:24:48.7 6.6 0.810.23
27 5:38:24.19 -2:37:10.6 12.4 1.180.16
28 5:38:25.02 -2:30:57.1 7.6 0.740.15
29 5:38:25.27 -2:35:36.2 14.4 1.490.17
30 5:38:26.15 -2:29:09.8 25.0 4.180.33
35 5:38:28.54 -2:32:30.6 6.4 0.540.12
36 5:38:28.59 -2:23:59.5 7.9 1.600.32
37 5:38:28.78 -2:32:55.7 9.0 0.850.15
38 5:38:28.91 -2:46:00.6 9.6 1.440.24
40 5:38:29.74 -2:25:45.9 11.8 1.820.27
43 5:38:31.20 -2:44:01.9 17.9 2.810.28
45 5:38:31.89 -2:40:54.1 7.1 0.570.12
48 5:38:32.82 -2:23:29.5 8.1 1.610.30
51 5:38:33.25 -2:26:50.0 6.4 0.780.18
57 5:38:34.69 -2:39:15.2 5.8 0.490.12
58 5:38:35.27 -2:34:37.7 107.9 35.620.88
59 5:38:35.29 -2:44:17.6 5.2 0.930.41
63 5:38:37.54 -2:42:51.4 8.0 0.800.16
66 5:38:38.65 -2:30:19.4 14.2 1.560.23
72 5:38:41.57 -2:28:18.5 20.7 3.190.29
73 5:38:42.16 -2:43:15.4 30.5 5.450.36
74 5:38:42.29 -2:42:27.6 6.9 0.540.12
77 5:38:43.86 -2:34:50.2 5.6 0.630.18
83 5:38:46.64 -2:43:11.3 6.5 0.690.15
85 5:38:47.26 -2:44:21.5 9.0 1.010.17
86 5:38:47.37 -2:28:23.8 9.8 0.980.17
95 5:38:49.66 -2:40:27.3 12.5 1.180.16
96 5:38:49.71 -2:25:01.3 17.4 3.740.39
99 5:38:50.14 -2:36:53.4 7.7 0.580.12
107 5:38:53.28 -2:38:31.6 7.3 0.460.10
108 5:38:53.32 -2:45:50.9 6.9 0.920.19
112 5:38:55.11 -2:27:51.6 7.8 1.000.19
113 5:38:55.16 -2:31:01.5 7.0 0.510.11
115 5:38:58.27 -2:38:51.3 16.6 1.820.19
121 5:39:00.52 -2:40:51.5 7.0 0.670.14
127 5:39:03.19 -2:35:00.8 7.1 0.570.12
128 5:39:03.34 -2:23:03.8 7.6 1.610.32
129 5:39:03.35 -2:47:31.4 5.5 0.650.18
130 5:39:04.91 -2:41:47.5 5.8 1.030.39
133 5:39:05.63 -2:27:22.2 5.0 0.690.18
134 5:39:05.72 -2:43:16.6 6.4 0.540.15
135 5:39:06.90 -2:30:49.7 6.7 0.720.18
136 5:39:07.05 -2:33:41.5 12.5 1.310.24
139 5:39:08.52 -2:44:22.3 5.7 0.610.15
141 5:39:09.56 -2:23:40.9 6.7 0.970.29
142 5:39:10.94 -2:26:35.5 7.1 1.230.26
143 5:39:11.13 -2:36:46.6 6.7 0.730.16
146 5:39:12.64 -2:26:09.2 5.2 1.910.45
152 5:39:16.50 -2:32:37.2 12.2 1.830.24
155 5:39:17.54 -2:33:13.8 14.0 2.140.27
158 5:39:18.90 -2:45:23.2 12.2 2.290.33
162 5:39:23.66 -2:34:48.0 9.2 1.470.25
163 5:39:24.13 -2:28:21.9 16.0 3.790.44
166 5:39:26.00 -2:44:43.7 10.7 2.270.36
168 5:39:29.49 -2:41:02.0 13.4 2.260.32
171 5:39:36.21 -2:28:25.2 6.5 2.010.51