Mapping the Large Scale Structure of the Universe111Appeared in Science, Vol. 309, p. 564 (2005)
In a large scale view of the universe, galaxies are the basic unit of structure. A typical bright galaxy may contain 100 billion stars and span tens of thousands of light years, but the empty expanses between the galaxies are much larger still. Galaxies are not randomly distributed in space, but instead reside in groups and clusters, which are themselves arranged in an intricate lattice of filaments and walls, threaded by tunnels and pocked with bubbles. Two ambitious new surveys, the Two-Degree Field Galaxy Redshift Survey (2dFGRS) and the Sloan Digital Sky Survey (SDSS), have mapped the three-dimensional distribution of galaxies over an unprecedented range of scales (1, 2). Astronomers are using these maps to learn about conditions in the early universe, the matter and energy contents of the cosmos, and the physics of galaxy formation.
Galaxies and large scale structure form by the gravitational amplification of tiny primordial fluctuations in the density of matter. The inflation hypothesis ascribes the origin of these fluctuations to quantum processes during a period of exponential expansion that occupied the first millionth-of-a-billionth-of-a-trillionth of a second of cosmic history. Experiments over the last decade have revealed the imprint of these fluctuations as part-in-100,000 intensity modulations of the cosmic microwave background (CMB), which records the small inhomogeneities present in the universe half a million years after the big bang. While the visible components of galaxies are made of “normal” baryonic matter (mostly hydrogen and helium), the gravitational forces that drive the growth of structure come mainly from dark matter, which is immune to electromagnetic interactions.
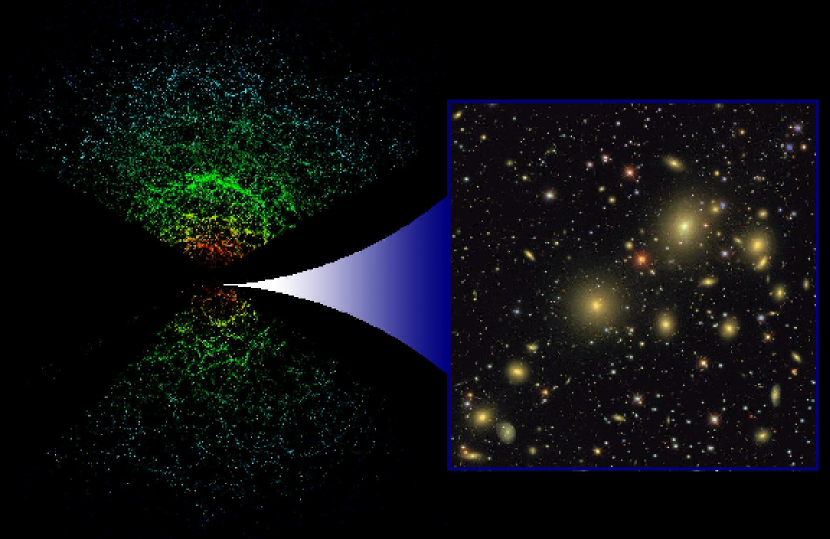
By combining precise, quantitative measurements of present-day galaxy clustering with CMB data and other cosmological observations, astronomers hope to test the inflation hypothesis, to pin down the physical mechanisms of inflation, to measure the amounts of baryonic and dark matter in the cosmos, and to probe the nature of the mysterious “dark energy” that has caused the expansion of the universe to accelerate over the last 5 billion years. The 2dFGRS, completed in 2003, measured distances to 220,000 galaxies, and the SDSS is now 80% of the way to its goal of 800,000 galaxies (see figure). The key challenge in interpreting the observed clustering is the uncertain relation between the distribution of galaxies and the underlying distribution of dark matter. If the galaxy maps are smoothed over tens of millions of light years, this relation is expected to be fairly simple: variations in galaxy density are constant multiples of the variations in dark matter density. Quantitative analysis in this regime has focused on the power spectrum, which characterizes the strength of clustering on different scales (3, 4). In geographic terms, the power spectrum describes the contributions of mountain ranges, isolated peaks, and rolling hills to the cosmic landscape. The shape of the dark matter power spectrum is a diagnostic of the inflation model, which predicts the input spectrum from the early universe, and of the average dark matter density, which controls the subsequent gravitational growth. Recent analyses have also detected subtle modulations of the power spectrum caused by baryonic matter, which undergoes acoustic oscillations in the early universe because of its interaction with photons (4, 5).
To go further, one would like to know the precise amplitude of dark matter clustering, not just the variation of clustering with scale. Unfortunately, the factor relating galaxy and dark matter densities depends on aspects of galaxy formation that are difficult to model theoretically. One observational approach to isolating dark matter clustering uses weak gravitational lensing, in which the dark matter surrounding nearby galaxies subtly distorts the apparent shapes of the distant galaxies behind them. Another approach uses the probabilities of different configurations of galaxy triples to pick out the characteristic, elongated-triangle signature of anisotropic gravitational collapse. Applications of these two methods to the SDSS and the 2dFGRS, respectively, imply that the clustering strength of bright, Milky Way-type galaxies is similar to that of the underlying dark matter (6, 7).
On smaller scales, the relation between galaxies and dark matter becomes more complex, and it is different for different types of galaxies. Redder galaxies composed of older stars reside primarily in clusters, the dense urban cores of the galaxy distribution. Younger, bluer galaxies populate the sprawling, filamentary suburbs. Current efforts to model galaxy clustering in this regime focus on the “halo occupation distribution,” a statistical description of the galaxy populations of gravitationally bound “halos” of dark matter. Depending on its mass, an individual dark halo may play host to a single bright galaxy, a small group of galaxies, or a rich cluster.
By combining theoretical predictions for the masses and clustering of halos with precise measurements of the clustering of galaxies, one can infer the halo occupation distribution for different classes of galaxies empirically. Theoretical models of galaxy formation predict a strong dependence of halo occupation on galaxy luminosity and color, and the initial results from the 2dFGRS and the SDSS show good qualitative agreement with these predictions (8, 9). Increased precision and measurements for more galaxy classes will test the predictions in much greater detail, and they will sharpen our understanding of the physical processes that produce visible galaxies in the first place and determine their observable properties. By deriving the relation between galaxies and dark matter from the clustering data themselves, halo occupation methods also allow new cosmological model tests that take advantage of precise measurements on small and intermediate scales.
The large scale clustering results from the 2dFGRS and the SDSS, in combination with CMB measurements and other cosmological data, support the predictions of a simple inflation model in a universe that contains 5% normal matter, 25% dark matter, and 70% dark energy (10). However, several analyses that incorporate smaller scale clustering suggest that either the matter density or the matter clustering amplitude is lower than this “concordance” model predicts, by 30-50% (11, 12, 13). This tension could reflect systematic errors in the measurements or the modeling, but it could also signal some departure from the simplest models of primordial fluctuations or dark energy. For example, if inflation produces gravity waves that contribute to observed CMB fluctuations, then naive extrapolation of these fluctuations would overpredict the level of matter clustering today. Alternatively, evolution of the dark energy component can affect the amount of growth since the CMB epoch. As the SDSS moves towards completion, improved clustering measurements and analyses may restore the consensus on a “vanilla” cosmological model, or they may provide sharper evidence that our theoretical recipe for the universe is still missing a key ingredient.
References
-
1.
M. Colless et al., Mon. Not. Roy. Ast. Soc., 328, 1039 (2001)
-
2.
D. G. York et al., Astron. J., 120, 1579 (2000)
-
3.
M. Tegmark et al., Astrophys. J., 606, 702 (2004)
-
4.
S. Cole et al., Mon. Not. Roy. Ast. Soc., submitted, preprint astro-ph/0501174
-
5.
D. J. Eisenstein et al., Astrophys. J., submitted, preprint astro-ph/0501171
-
6.
E. Sheldon et al., Astron. J., 127, 2544 (2004)
-
7.
L. Verde et al., Mon. Not. Roy. Ast. Soc., 335, 432 (2002)
-
8.
F. C. van den Bosch, X. Yang, H. J. Mo, Mon. Not. Roy. Ast. Soc., 340, 771 (2003)
-
9.
I. Zehavi et al., Astrophys. J., in press, preprint astro-ph/0408569
-
10.
Convergence on this model from several independent lines of evidence was the 2003 Science “Breakthrough of the Year”; C. Seife, Science, 302, 2038 (2003)
-
11.
F. C. van den Bosch, H. J. Mo, X. Yang, Mon. Not. Roy. Ast. Soc., 345, 923 (2003)
-
12.
N. A. Bahcall et al., Astrophys. J., 585, 182 (2003)
-
13.
J. Tinker, D. H. Weinberg, Z. Zheng, I. Zehavi, Astrophys. J., in press, preprint astro-ph/0411777