A Soft X-ray Transient in the M31 Bulge
Abstract
We have examined a probable soft X-ray transient source in the M31 bulge at R.A.=0:42:41.814 0.08′′, Dec. = 41:16:35.86 0.07′′. On the three occasions we observed the source, its spectrum was soft ( keV). The brightest detection of the source was 2004 July 17 with a 0.3–7 keV luminosity of 5 erg s-1. The only previous detection of the source was in 1979 by the Einstein observatory. The multiple detections over 25 years suggest the duty cycle of the source is in the range 0.02–0.06. Coordinated HST ACS imaging before, during, and after the outburst revealed no variable optical source within the position errors of the X-ray source. The optical data place a firm upper limit on the brightness of the counterpart of the X-ray outburst of , suggesting the binary has a period days. The X-ray spectrum and lack of bright stars at the source location indicate the source was a soft transient event occurring in a low-mass X-ray binary, making this source a good black hole candidate in M31.
1 Introduction
Low-mass X-ray binaries (LMXBs) that exhibit bright, soft, transient X-ray outbursts often contain stellar-mass black hole primaries (McClintock & Remillard, 2004 and references therein). X-ray observations of these objects only tell part of the story, as their orbital periods and masses are typically determined through observations of their optical counterparts.
Observations with Chandra and XMM-Newton have provided discoveries of many bright transient X-ray sources in M31 in the past few years (Trudolyubov et al., 2001; Osborne et al., 2001; Kong et al., 2002; Williams et al., 2004, and many others). However, the optical properties of such events in M31 have received attention only recently.
Combined optical/X-ray studies of X-ray transients constrains their orbital periods. Through continued monitoring of the bulge of M31 with the Chandra X-ray Observatory (Chandra) and Hubble Space Telescope (HST), we have discovered several bright, soft, transient X-ray sources (Williams et al., 2004, 2005a, 2005b, 2005d, 2005c). In some cases, the coordinated optical observations of these transient events has led to the identification of probable optical counterpart candidates (Williams et al., 2004, 2005a, 2005b, 2005c). In other cases, the observations have led to meaningful upper limits on the optical luminosities of the X-ray transient during outburst (Williams et al., 2005d). As the sample of such systems grows, it will become possible to perform statistical tests, using properties such as the luminosity and period distribution of the sample to test models of binary formation and evolution.
Herein we report an outburst from a transient X-ray source in the M31 bulge. Coordinated optical observations of the source reveal no variable optical counterpart candidate and show that its optical counterpart must have been fainter than . Section 2 details our observations and analysis techniques. Section 3 gives the results of the analysis. Section 4 discusses the implications of the results, and § 5 provides the conclusions from our work.
2 Data
2.1 X-ray
We obtained six observations with the Chandra ACIS-I between January 2004 and November 2004 relevant to this study. The observation identification numbers, dates, pointings, roll angles, and exposure times of these observations are given in Table 1. Although the observations were taken for 5 ks each, the effective exposure was reduced by 20% because the data were taken in “alternating readout mode” in order to avoid pileup for any bright transient source.
All of these observations were reduced in an identical fashion using CIAO 3.1. We created exposure maps for the images using the task merge_all,111http://cxc.harvard.edu/ciao/ahelp/merge_all.html and we found and measured positions and count rates of the sources in the images using the CIAO task wavdetect.222http://cxc.harvard.edu/ciao3.0/download/doc/detect_html_manual/Manual.html. These data sets each had 3 detection limits of 2.210-3 ct s-1, corresponding to 0.3–10 keV luminosities of 21036 erg s-1 for a typical LMXB system in M31. The background-subtracted count rates are provided in Table 1.
We searched our source lists for new sources brighter than 1.51037 erg s-1 that had not appeared in earlier Chandra images or on recently published lists of X-ray sources in M31. We focus here on one such source which appeared on 15-Aug-2004 at R.A.=0:42:41.814, Dec. = 41:16:35.86. The source is coincident with an X-ray source seen by the Einstein HRI in January 1979 called TF 47 with a 0.2–4 keV luminosity of 1.51037 erg s-1 (Trinchieri & Fabbiano, 1991). It has not been detected since that outburst. We give this source the formal name CXOM31 J004241.8+411635 and the short name r1-36 using the naming conventions spelled out in Table 2 of Williams et al. (2004). This source is 0.65′ northwest of the M31 nucleus.
We aligned the coordinate system of the X-ray images with the optical images of the Local Group Survey (LGS; Massey et al., 2001). The positions of X-ray sources with known globular cluster counterparts were aligned with the globular cluster centers in the LGS images using the IRAF333IRAF is distributed by the National Optical Astronomy Observatory, which is operated by the Association of Universities for Research in Astronomy, Inc., under cooperative agreement with the National Science Foundation. task ccmap. The precise alignment errors for the observations, which were applied in determining the X-ray error ellipse, are given in Table 2.
The position errors of the source on the X-ray images was measured using the IRAF task imcentroid. These errors were all 0.1′′ and are also provided in Table 2. The final position and errors on the position were calculated by adding the alignment and position errors for each measurement in quadrature and then taking the weighted mean of the three independent position measurements.
Finally, the spectra of r1-36 were extracted using the CIAO task psextract,444http://cxc.harvard.edu/ciao/ahelp/psextract.html binning the spectrum in energy so that each bin contained 20 counts. We then fit each spectrum using CIAO 3.1/Sherpa, trying both a power-law with absorption and a disk blackbody model with absorption. All of the errors reported are 1 unless otherwise specified. Errors in the spectral fits were obtained with the covariance routine in Sherpa. Luminosity errors take into account the normalization errors in the spectral fitting, but count rate errors do not. Results are discussed in § 3.
2.2 Optical
We obtained three sets of images containing the position of r1-36 with the Advanced Camera for Surveys (ACS) aboard HST. The first data set, pointed at R.A.=00:42:43.86, Dec.=41:16:30.1 with an orientation of 55 degrees, was taken on 23-Jan-2004 in an attempt to detect a different transient source. This dataset fortuitously contained the position of r1-36 before it became active. The second, pointed at R.A.=00:42:41.50, Dec.=41:17:00.0 with an orientation of 220 degrees, was taken 15-Aug-2004 while the X-ray source was active. The final observations, pointed at R.A.=00:42:41.50, Dec.=41:17:05.0 with an orientation of 116 degrees, was taken 22-Nov-2004 after the X-ray source faded.
All three data sets were obtained through the F435W ( equivalent) filter using the ACS 4-point box dither pattern in order to allow us to recover the best possible spatial resolution. The total exposure time for each set was 2200 s. Each epoch was combined in an identical manner using the PyRAF555PyRAF is a product of the Space Telescope Science Institute, which is operated by AURA for NASA. task multidrizzle,666multidrizzle is a product of the Space Telescope Science Institute, which is operated by AURA for NASA. http://stsdas.stsci.edu/pydrizzle/multidrizzle which has been optimized to process ACS imaging data. The task removes cosmic ray events and geometric distortions, and it combines the dithered frames together into one final photometric image in units of counts per second. We utilized the capabilities of this task to improve the sampling of the final images to 0.025′′ pixel-1.
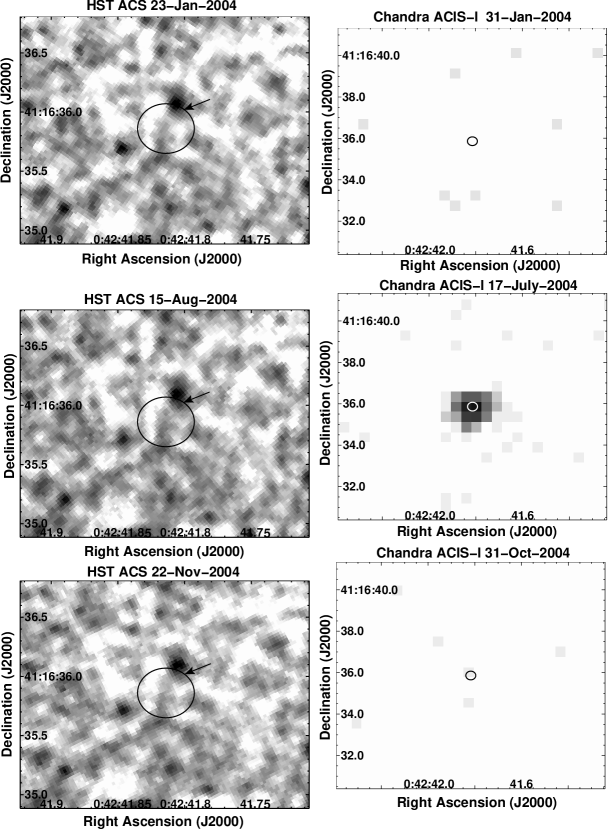
Each final image was aligned with the LGS reference frame using stars common to both images. The adjustment of the coordinate systems of the images was performed using the IRAF task ccmap. In all cases, the rms errors of the alignment were smaller than 1 ACS pixel. The excellent agreement between the independently aligned frames can be seen in Figure 1.
Photometry was performed on the relevant sections of the final images using DAOPHOT II and ALLSTAR (Stetson et al., 1990). The count rates measured (0.25′′ radius aperture) were converted to VEGA magnitudes ( equivalent) using the conversion formulas provided in the ACS Data Handbook777http://www.stsci.edu/hst/acs/documents/handbooks/DataHandbookv2/ACS_longdhbcover.html.
The crowding this close to the M31 nucleus limited the depth to which we could resolve individual stars. The limitations of the photometry were investigated by comparing the results for the same section of sky in the second and third ACS data sets. Figure 2 shows the percentage of stars detected in only one data set as a function of magnitude within 9′′ of the position of r1-36. The results show that confusion begins to limit the completeness of the data at , and the completeness decreases to 50% at .
3 Results
3.1 X-ray
We determined the position of r1-36 by taking the weighted mean of the position determination from the three independent detections. The errors for each of the three position measurements were calculated by taking the root-sum-square of the imcentroid error of the position on the detector and the ccmap alignment error with the LGS coordinate system. All of these errors are provided in Table 2, resulting in a final position and 1 error of R.A.=0:42:41.8140.08′′, decl.=41:16:35.860.07′′. This position is shown with the 3 error ellipses on Figure 1.
The X-ray lightcurve of r1-36 is shown in Figure 3. This lightcurve, which shows a slow decrease in X-ray flux followed by a sharp drop after 3 months, clearly did not follow a strict exponential decay (the best fitting exponential has =23). However, in the 26 days between the final detection and the first non-detection, the flux decreased by a factor of at least 9. This final decay therefore had an -folding decay time of at most 12 days if exponential decay is assumed. This type of decay is not unique. Similar decay patterns have been seen in some Galactic outbursts, such as the second half of the 1998–1999 outburst of XTE J1550-564 (Sobczak et al., 2000).
Source r1-36 is a second detection of the transient X-ray source TF 47. This source has not been detected since the Einstein era, when it was detected in only a single epoch of observations with the HRI (1979 January; Trinchieri & Fabbiano, 1991). Two detected outbursts of this source over all of the epochs of Einstein, Rosat, XMM, and Chandra observations constrain the duty cycle of the transient. Assuming that the transient was active for about the same length of time when it appeared in 1979 as it was during this outburst (3 months), the transient was active for at least 6 months over the past 25 years, giving a lower limit to the duty cycle of 0.02. At the same time, all of the Chandra observations of M31 to date have observed 1999 October–2002 August and 2003 November–2004 November without seeing the source active more than this one time. The longest gaps in these observations were 4 months. Assuming no outbursts were missed during this monitoring period, we can infer an upper limit on the duty cycle of 0.06. Therefore the duty cycle of r1-36 is likely 0.02–0.06.
The X-ray spectra of the three detections of r1-36 were all well-fitted by absorbed disk blackbody and absorbed power-law models. They all show that the spectrum is softer than those of high-mass X-ray binaries, which typically show hard spectra dominated by power-laws of index closer to 1, The best-fitting indexes were ; such values are in the range for LMXBs in the thermal-dominant state (2–5; see Table 4.4 in McClintock & Remillard, 2004) suggesting that the system is an LMXB containing an accreting compact object. The absorption values in these fits were quite high for soft bright M31 X-ray sources, which typically have N cm-2 (Shirey et al., 2001). Because the absorption values for the power-law fits were unusually high, we did not consider a power-law the appropriate model for fitting our data from r1-36. However, for completeness, the results from the power-law fits are given in Table 3.
In the disk blackbody fits (see Table 4), the measured absorption was within the errors of the known foreground absorption toward M31 [51020 cm-2 for (Predehl & Schmitt, 1995; Schlegel et al., 1998)]. We therefore fixed the absorption to this value for all three detections. These fits yielded temperatures similar to those of Galactic LMXBs in outburst (McClintock & Remillard, 2004) and indicated a decrease in temperature as the X-ray flux faded. The best-fitting parameter values, along with the improved fitting statistics, suggest that a disk blackbody is the physical process responsible for most of the X-ray emission from r1-36.
We provide all of the details of the disk blackbody spectral fits in Table 4. The fits yield an unabsorbed 0.3–7 keV X-ray luminosity during the 15-Aug-2004 HST observation of 5 erg s-1. This luminosity does not shed light as to the nature of the accreting compact object because it is below the Eddington limit for both neutron stars and black holes. However, the observed decay of the X-ray flux and disk temperature are hallmarks of the decline of black hole transients in the thermal dominant state (e.g. Ebisawa et al., 1994; Sobczak et al., 2000; Park et al., 2004; McClintock & Remillard, 2004).
3.2 Optical
The coordinated images of the region of interest are shown on the left side of Figure 1. Each image is shown next to the most contemporaneous X-ray image, and the 3 position error ellipse for the position of r1-36 is drawn on each image. The analysis of these images is severely hampered by crowding, as demonstrated by the unresolved structure in all three images. There is no obvious bright star in the error ellipse, consistent with the X-ray spectrum in suggesting that the source is an LMXB.
The DAOPHOT analysis of the optical data did not reveal any resolved stars inside the error ellipse brighter than . No star in or near the error ellipse shows a significant increase in brightness during the epoch when the X-ray source was active. The only star detected in the 15-Aug-2004 observation (when r1-36 was active) inside the error ellipse is marked with the arrows on Figure 1 at R.A.=00:42:41.803, Dec.=41:16:36.00. This sole resolved star is blended with the bright star 0.1′′ to the north, outside the error ellipse. The star inside the ellipse was measured to be brightest in the 15-Aug-2004 observation, with . This star was also detected in the 23-Jan-2004 observation (when r1-36 was quiescent), but it was slightly fainter (). It was not detected by DAOPHOT in the 22-Nov-2004 observation.
The low-significance brightness increase and disappearance of this star make it the only optical counterpart candidate for r1-36, but the variability detection is not reliable. The increase in brightness is only 1.6. Furthermore, the results of our completeness study, shown in Figure 2, indicate that the completeness begins to decrease at , and is only 80% at , providing a 1/5 chance that such a star will be missed in the analysis. Therefore the fact that it was missed in 1 out of 3 images is not unexpected. On the other hand, as this was the only star detected in the 3 error ellipse in the 15-Aug-2004 data, it provides a reliable upper-limit of for the optical brightness of the X-ray transient during outburst.
For the purpose of determining an upper limit to the optical luminosity of the outburst, we assume that the counterpart candidate with was the counterpart. With N cm-2 (see Table 4), applying the relation of Predehl & Schmitt (1995) and a standard extinction law, we find . Assuming -M=24.47, the absolute magnitude was . Assuming an intrinsic color of [the mean of the Galactic LMXB catalog of Liu et al. (2001)], we find , or an upper-limit of .
Our measurements allow us to provide a rough prediction of the orbital period of r1-36 using the empirical relation between X-ray luminosity, optical luminosity, and orbital period for Galactic LMXBs determined by van Paradijs & McClintock (1994). This relation has been tested for more recent transient events and for observations separated by up to 3 weeks by Williams et al. (2005a, d), showing that it provides reliable orbital period predictions even for events with complex multiwavelength lightcurves. In addition, since r1-36 shows a decay curve reminiscent of the second-half of the 1998-1999 outburst of XTE J1550-564, we tested the relation for this case. The second half of that outburst had an X-ray luminosity of erg s-1 (for a distance of 5.32.3 kpc; Orosz et al., 2002), and the optical counterpart showed . Applying the extinction of (Orosz et al., 2002) gives M. These numbers would yield a period prediction of 1 day. This limit is correct, as the true period is 1.55 days.
In the case of r1-36, if we insert the optical luminosity of and the unabsorbed 0.3–7 keV X-ray luminosity of 51037 erg s-1 into the van Paradijs & McClintock (1994) relation, we obtain a prediction for the orbital period of 1.7 days. Therefore, assuming r1-36 is an LMXB similar to those in our own Galaxy and that the true counterpart was no brighter than the only star detected within the 3 error ellipse during the outburst, the predicted upper-limit for the period of the system is 5.2 days.
4 Discussion: Source Classification
Ideally we would like to fully classify the transient X-ray source r1-36. While its observed properties show that it is an LMXB in M31, the current observations do not allow a final conclusion to be drawn as to whether the primary member of the binary is a neutron star or black hole. Nevertheless, the similarities between r1-36 and X-ray binaries known to contain black holes make it a good black hole candidate.
First of all, the source is most likely in M31. At the flux levels observed (510-13 erg cm-2 s-1), the number of background sources is 1 per square degree (extrapolating the results of Hasinger et al., 1998 to brighter fluxes). With our ACIS field covering 0.07 deg2, the probability that this source is in the background is 7%. The source is also unlikely to be in the foreground. The disk blackbody spectral fits provide a normalization value that, given the distance to the source, indicates (where is the inner radius of the accretion disk in km and is the inclination of the disk). If the source is at the distance of M31 (780 kpc), km, physically reasonable for a compact object. On the other hand, if the source is in the foreground (10 kpc), km, quite small for any accreting object, even for high inclination angles. Together, these results suggest the source is in M31.
The source is likely an LMXB, as suggested by the significant variability, spectrum, and lack of high-mass stellar counterpart candidates. The current data set allows either a neutron star or black hole primary. There are spectral characteristics that could discern between the two, such as a blackbody component indicative of a neutron star envelope (Tanaka & Shibazaki, 1996). Unfortunately, our spectra are not of sufficient quality to reliably detect such additional components. Our spectra of r1-36 are soft, are well-fitted by a disk blackbody model, and indicate a peak luminosity of 51037 erg s-1. LMXBs with black hole primaries and those with neutron star primaries can both have soft disk blackbody spectral components and peak luminosities of 1037–1038 erg s-1 (Tanaka & Shibazaki, 1996). Our X-ray spectra therefore allow the presence of either type of compact object.
While we cannot be certain about the nature of the compact object in r1-36, it certainly could contain a black hole. Most known transient X-ray binaries containing neutron stars are HMXBs with Be secondaries. Source r1-36 has a softer spectrum and a fainter secondary than such HMXB transients. In addition, more than half of Galactic transient LMXBs contain black holes (McClintock & Remillard, 2004; Tanaka & Shibazaki, 1996). Furthermore, with the exception of GRS 1915+105, which has remained active since its discovery in 1992, all LMXBs with dynamically-confirmed black hole primaries are transient sources (McClintock & Remillard, 2004).
Finally, the X-ray decay pattern of r1-36 mimics typical decays of black hole binaries but differs from typical decays of neutron star binaries. The inner disk temperature of r1-36 decays from 1.2 keV to 0.8 keV; similarly, black hole binaries in the thermal dominant state have very comparable disk temperatures (e.g., see Table 4 in McClintock & Remillard, 2004) that invariably decay smoothly and monotonically (e.g., Ebisawa et al., 1994; Sobczak et al., 1999, 2000; Park et al., 2004). In contrast, neutron star binaries appear to exhibit constant or non-monotonic temperatures as they decay in the soft state. For example, Aquila X-1 showed a constant inner disk temperature of 2.3 keV during the thermal dominant phase of its 2000 outburst (Maitra & Bailyn, 2004), and the temperature of 4U 1630-47 first declined rapidly and thereafter fluctuated irregularly around a value of 0.7 keV during most of its decline phase (Tomsick & Kaaret, 2000). These comparisons indicate that r1-36 has more in common with known black hole binaries than with neutron star binaries.
Succinctly, our data set cannot reliably determine the nature of the primary in the M31 LMXB X-ray transient r1-36. On the other hand, the data show that r1-36 is not similar to most X-ray binaries known to contain neutron stars, which are persistent and/or have high-mass secondaries. The data also show that r1-36 is similar to most X-ray binaries known to contain black holes, which are transient, have low-mass secondaries, and exhibit similar luminosity and temperature decay patterns. These similarities make r1-36 a good black hole candidate in M31.
5 Conclusions
We have studied a recent outburst of the X-ray transient source TF 47 (Trinchieri & Fabbiano, 1991), which we have detected on three occasions with Chandra. We call this most recent outburst CXOM31 J004241.8+411635, or r1-36. This second detected outburst from this source suggests its duty cycle is in the range 0.02–0.06.
The soft X-ray spectrum of the source indicates that it is likely an LMXB. Spectral fits suggest the X-rays came from a hot accretion disk with an inner edge temperature of 1 keV. The absorption-corrected 0.3–7 keV luminosity of the source during the outburst was 51037 erg s-1.
ACS observations before, during, and after the outburst set a limit of for the counterpart to the system. This fact supports the argument that the secondary is low-mass. The X-ray luminosity and optical upper-limit during outburst suggest the period of the binary system is 5.2 days.
The X-ray spectrum and optical data show that r1-36 is a transient LMXB in M31. This evidence does not allow a reliable conclusion as to the nature of the primary, as neither the spectrum nor the luminosity of r1-36 rule out the possibility that the accreting compact object is a neutron star. In the Galaxy, these types of sources have a higher probability of containing a black hole than do HMXBs or persistent bright X-ray sources. In addition, the X-ray decay properties of r1-36 bear a stronger resemblance to black hole binaries than to neutron star binaries. Therefore, while there is no conclusive evidence that r1-36 contains a black hole, it is a good black hole candidate.
Out of 6 transient X-ray sources likely to be LMXBs whose optical luminosities have been studied so far (Williams et al., 2004, 2005a, 2005b, 2005d, 2005c), this is the fourth one with a predicted orbital period estimate of less than a few days. The three others are s1-86 (Williams et al., 2005a), r2-71 (Williams et al., 2005d), and r3-127 (Williams et al., 2005c). Together, these results begin to hint that at least half of the transient LMXB sources in the M31 bulge may be rather short period systems with small accretion disks. While the statistics of a sample of 6 are clearly limited, the orbital period distribution (inferred from the X-ray/optical luminosity ratio distribution) does not appear grossly different from that of similar systems in the Galaxy (e.g. Orosz, 2002).
Support for this work was provided by NASA through grant number GO-9087 from the Space Telescope Science Institute and through grant number GO-3103X from the Chandra X-Ray Center. MRG acknowledges support from NASA LTSA grant NAG5-10889. SSM acknowledges the support of the HRC contract NAS8-03060. JEM acknowledges the support of NASA grant NNG0-5GB31G.
References
- Bevington & Robinson (2003) Bevington, P. R., & Robinson, D. K. 2003, Data reduction and error analysis for the physical sciences (Boston, MA: McGraw-Hill)
- Ebisawa et al. (1994) Ebisawa, K., et al. 1994, PASJ, 46, 375
- Hasinger et al. (1998) Hasinger, G., Burg, R., Giacconi, R., Schmidt, M., Trumper, J., & Zamorani, G. 1998, A&A, 329, 482
- Kong et al. (2002) Kong, A. K. H., Garcia, M. R., Primini, F. A., Murray, S. S., Di Stefano, R., & McClintock, J. E. 2002, ApJ, 577, 738
- Liu et al. (2001) Liu, Q. Z., van Paradijs, J., & van den Heuvel, E. P. J. 2001, A&A, 368, 1021
- Maitra & Bailyn (2004) Maitra, D., & Bailyn, C. D. 2004, ApJ, 608, 444
- Massey et al. (2001) Massey, P., Hodge, P. W., Holmes, S., Jacoby, G., King, N. L., Olsen, K., Saha, A., & Smith, C. 2001, in American Astronomical Society Meeting, Vol. 199, 13005
- McClintock & Remillard (2004) McClintock, J. E., & Remillard, R. A. 2004, in Compact Stellar X-ray Sources (astro-ph/0306213)
- Orosz (2002) Orosz, J. A. 2002, in IAU Conf. Proc. 212: A Massive Star Odyssey, from Main Sequence to Supernova, astro-ph/0209041
- Orosz et al. (2002) Orosz, J. A., et al. 2002, ApJ, 568, 845
- Osborne et al. (2001) Osborne, J. P., et al. 2001, A&A, 378, 800
- Park et al. (2004) Park, S. Q., et al. 2004, ApJ, 610, 378
- Predehl & Schmitt (1995) Predehl, P., & Schmitt, J. H. M. M. 1995, A&A, 293, 889
- Schlegel et al. (1998) Schlegel, D. J., Finkbeiner, D. P., & Davis, M. 1998, ApJ, 500, 525
- Shirey et al. (2001) Shirey, R., et al. 2001, A&A, 365, L195
- Sobczak et al. (1999) Sobczak, G. J., McClintock, J. E., Remillard, R. A., Bailyn, C. D., & Orosz, J. A. 1999, ApJ, 520, 776
- Sobczak et al. (2000) Sobczak, G. J., McClintock, J. E., Remillard, R. A., Cui, W., Levine, A. M., Morgan, E. H., Orosz, J. A., & Bailyn, C. D. 2000, ApJ, 544, 993
- Stetson et al. (1990) Stetson, P. B., Davis, L. E., & Crabtree, D. R. 1990, in ASP Conf. Ser. 8: CCDs in astronomy, 289
- Tanaka & Shibazaki (1996) Tanaka, Y., & Shibazaki, N. 1996, ARA&A, 34, 607
- Tomsick & Kaaret (2000) Tomsick, J. A., & Kaaret, P. 2000, ApJ, 537, 448
- Trinchieri & Fabbiano (1991) Trinchieri, G., & Fabbiano, G. 1991, ApJ, 382, 82
- Trudolyubov et al. (2001) Trudolyubov, S. P., Borozdin, K. N., & Priedhorsky, W. C. 2001, ApJ, 563, L119
- van Paradijs & McClintock (1994) van Paradijs, J., & McClintock, J. E. 1994, A&A, 290, 133
- Williams et al. (2004) Williams, B. F., Garcia, M. R., Kong, A. K. H., Primini, F. A., King, A. R., Di Stefano, R., & Murray, S. S. 2004, ApJ, 609, 735
- Williams et al. (2005a) Williams, B. F., Garcia, M. R., Kong, A. K. H., Primini, F. A., & Murray, S. S. 2005a, ApJ, 620, 723
- Williams et al. (2005b) Williams, B. F., Garcia, M. R., McClintock, J. E., Kong, A. K. H., Primini, F. A., & Murray, S. S. 2005b, ApJ, 628, 382
- Williams et al. (2005c) Williams, B. F., Garcia, M. R., McClintock, J. E., Primini, F. A., & Murray, S. S. 2005c, ApJ, accepted
- Williams et al. (2005d) Williams, B. F., Garcia, M. R., Primini, F. A., McClintock, J. E., & Murray, S. S. 2005d, ApJ, accepted
| ObsID | Date | R.A. (J2000) | Dec. (J2000) | Roll (deg.) | Exp.aaThe exposure time of the observation in ks. | CtsbbThe number of background-subtracted counts from r1-36 in the detection. Non-detections are given a value of 9 counts for a 3 upper limit. | RateccThe count rate of r1-36 in units of ct s-1. |
|---|---|---|---|---|---|---|---|
| 4681 | 31-Jan-2004 | 00 42 44.4 | 41 16 08.3 | 305.55 | 4.1 | 9 | 0.0022 |
| 4682 | 23-May-2004 | 00 42 44.4 | 41 16 08.3 | 79.99 | 3.9 | 9 | 0.0023 |
| 4719 | 17-Jul-2004 | 00 42 44.3 | 41 16 08.4 | 116.83 | 4.1 | 328 | 0.0800.004 |
| 4720 | 02-Sep-2004 | 00 42 44.3 | 41 16 08.4 | 144.80 | 4.1 | 161 | 0.0590.005 |
| 4721 | 04-Oct-2004 | 00 42 44.3 | 41 16 08.4 | 180.55 | 4.1 | 207 | 0.0500.004 |
| 4722 | 31-Oct-2004 | 00 42 44.3 | 41 16 08.4 | 225.99 | 3.9 | 9 | 0.0053 |
| ObsID | R.A. (J2000) | aaRandom position errors were measured using the IRAF task imcentroid. (′′) | bbErrors in the alignment between the X-ray image and the LGS coordinate system were measured using the IRAF task ccmap. (′′) | (′′) | Dec. (J2000) | (′′) | (′′) | (′′) |
|---|---|---|---|---|---|---|---|---|
| 4719 | 0:42:41.813 | 0.06 | 0.12 | 0.13 | 41:16:35.77 | 0.06 | 0.12 | 0.13 |
| 4720 | 0:42:41.816 | 0.08 | 0.14 | 0.16 | 41:16:35.82 | 0.08 | 0.07 | 0.11 |
| 4721 | 0:42:41.812 | 0.07 | 0.14 | 0.16 | 41:16:36.01 | 0.07 | 0.10 | 0.13 |
| MeanddThe mean position and errors were calculated using standard statistics for combining multiple measurements (Bevington & Robinson, 2003). | 0:42:41.814 | 0.08 | 41:16:35.86 | 0.07 |
| ObsID | RangeaaThe energy range over which the spectrum was fitted. (keV) | bbThe absorption column, in units of 1020 cm-2. Values with no errors are from fits with fixed absorption. | ccThe best-fitting photon index of the spectrum. | ddThe quality of the fit is given by showing the value of and the number of degrees of freedom () in the fit. | eeThe probability that the fitted model represents the true intrinsic spectrum (based on the value of ). | ffThe absorption-corrected 0.3–7 keV luminosity of the source in units of erg s-1, taking into account the uncertainties in the spectral fit. |
|---|---|---|---|---|---|---|
| 4719 | 0.35–5 | 198 | 2.00.2 | 8.93/12 | 0.71 | 7.71.5 |
| 4720 | 0.35–3.5 | 3613 | 2.50.3 | 6.43/5 | 0.27 | 8.02.4 |
| 4721 | 0.35–3.5 | 3911 | 3.00.3 | 5.44/7 | 0.61 | 2.50.7 |
| ObsID | Range (keV)aaThe energy range over which the spectrum was fitted. | bbThe absorption column, in units of 1020 cm-2. Values with no errors are from fits with fixed absorption. | TinccThe temperature of the inner edge of the accretion disk. (keV) | Rin cosddThe radius of the inner edge of the accretion disk in km multiplied by the square-root of the cosine of the inclination of the disk, assuming the source is at a distance of 780 kpc. | eeThe quality of the fit is given by showing the value of and the number of degrees of freedom () in the fit. | ffThe probability that the fitted model represents the true intrinsic spectrum (based on the value of ). | ggThe absorption-corrected 0.3–7 keV luminosity of the source in units of erg s-1, taking into account the uncertainties in the spectral fit. |
|---|---|---|---|---|---|---|---|
| 4719 | 0.35–5 | 05 | 1.20.1 | 103 | 7.24/12 | 0.84 | 5.11.9 |
| 4719 | 0.35–5 | 5 | 1.20.1 | 103 | 8.09/13 | 0.84 | 5.31.7 |
| 4720 | 0.35–3.5 | 78 | 1.00.1 | 133 | 5.47/5 | 0.36 | 3.72.1 |
| 4720 | 0.35–3.5 | 5 | 1.00.1 | 123 | 5.56/6 | 0.47 | 3.61.4 |
| 4721 | 0.35–3.5 | 56 | 0.790.09 | 185 | 4.02/7 | 0.78 | 3.01.5 |
| 4721 | 0.35–3.5 | 5 | 0.800.07 | 184 | 4.02/8 | 0.85 | 3.01.0 |