Star–forming galaxies at intermediate redshifts: morphology, ages and sizes
Abstract
We present the analysis of the deepest near-UV image obtained with Hubble Space Telescope using the WFPC2(F300W) as part of the parallel observations of the Hubble Ultra Deep Field campaign. The U-band 10 limiting magnitude measured over 0.2 arcsec2 is mAB=27.5 which is 0.5 magnitudes deeper than that in the Hubble Deep Field North. We matched the U-band catalog with those in the ACS images (B, V, i, z) taken during the Great Observatories Origins Deep Survey observations of the Chandra Deep Field South and obtained photometric redshifts for 306 matched objects. We find that the UV-selected galaxies span all the major morphological types at 0.2 1.2. However, disks are more common at lower redshifts, 0.2 0.8. Higher redshift objects (0.7 1.2) are on average bluer than lower and have spectral type typical of starbursts. Their morphologies are compact, peculiar or low surface brightness galaxies. Despite the UV-selection, 13 objects have spectral types of early-type galaxies; two of them are spheroids with blue cores. The evolutionary synthesis code, Starburst99, was used to age-date the UV-selected galaxies which were found to have rest-frame colors typical of stellar populations with intermediate ages 100 Myr. The average half-light radius (rest-frame 1200–1800 Å) of the UV-selected galaxies at 0.661.5 is arcsec ( kpc). The UV-selected galaxies are on average fainter (MB=–18.430.13) than Lyman Break Galaxies (MB=–231). Our sample includes early-type galaxies that are presumably massive and forming stars only in their cores, as well as starburst-type systems that are more similar to the LBGs, although much less luminous. This implies that even the starbursts in our sample are either much less massive than LBGs or are forming stars at a much lower rate or both. The low surface brightness galaxies have no overlap with the LBGs and form an interesting new class of their own.
Subject headings:
galaxies:evolution:formation:starburst1. Introduction
Establishing how galaxies formed and evolved to become today’s galaxies remains one of the fundamental goals of theorists and observers. The fact that we see a snapshot of the universe as if it was frozen in time, prevents us from directly following the process of galaxy assembly, growth, ageing, and morphological metamorphosis with time. The alternative commonly pursued is to look for evolutionary signatures in surveys of large areas of the sky . Recently, Heavens et al. (2004) analyzed the ‘fossil record’ of the current stellar populations of 100,000 galaxies () from the Sloan Digital Sky Survey (SDSS) and noted a mass dependence on the peak redshift of star–formation. They claim that galaxies with masses comparable to a present-day L* galaxy appears to have experienced a peak in activity at . Objects of lower (present-day stellar) masses (M⊙) peaked at 0.5. Bell et al. (2004) using the COMBO-17 survey (Classifying Objects by Medium-Band Observations in 17 filters) found an increase in stellar mass of the red galaxies (i.e. early–types) by a factor of two since . Papovich et al. (2005) using the HDF-N/NICMOS data suggest an increase in the diversification of stellar populations by 1 which implies that merger–induced starbursts occur less frequently than at higher redshifts, and more quiescent modes of star-formation become the dominant mechanism. Simultaneously, around 1.4, the emergence of the Hubble–sequence galaxies seems to occur.
Connecting the star formation in the distant universe () to that estimated from lower redshift surveys, however, is still a challenge in modern astronomy. Using the Lyman break technique (e.g. Steidel et al. 1995), large samples of star–forming galaxies at have been identified and studied. Finding unobscured star forming galaxies in the intermediate redshift range () is more difficult since the UV light ( 1000–2000 Å) that comes from young and massive OB stars is redshifted into the near-UV. The near-UV detectors are less sensitive than optical ones which makes UV imaging expensive in telescope time. For instance, 30% of HST time in the Hubble Deep Field campaign was dedicated to the U-band (F300W - = 2920 Å), whereas the other 70% was shared between B, V, and I-bands. Inspite of this, the limiting depth reached in the U band is about a magnitude shallower than in the other bands.
Recently, Heckman et al. (2005) attempted to identify and study the local equivalents of Lyman break galaxies using images from the UV-satellite GALEX and spectroscopy from the SDSS. Amongst the UV luminous population, they found two kinds of objects: 1) massive galaxies that have been forming stars over a Hubble time which typically show morphologies of late-type spirals; 2) compact galaxies with identical properties to the Lyman break galaxy population at . These latter are genuine starburst systems that have formed the bulk of their stars within the last 1–2 Gyr.
Establishing the population of objects that contributes to the rise in the SFR with lookback time has strong implications to theories of galaxy evolution and can only be confirmed by a proper census of the galaxy population at the intermediate epoch (). In the present paper we identify a sample of intermediate redshift UV luminous galaxies and seek to understand their role in galaxy evolution. We have used data from the Great Observatories Origins Deep Survey (GOODS) in combination with an ultra deep UV image taken with HST/WFPC2 (F300W) to search for star-forming galaxies. The space-UV is the ideal wavelength to detect unobscured star-forming galaxies whereas the multiwavelength ACS images (B, V, i, z) are ideal for morphological analysis of the star-forming objects.
This paper is organized as follows: §2 describes the data processing, §3 presents the sample, §4 discusses redshifts, §5 presents various issues concerning their colors and age, §6 describes the morphological classification, §7 discusses the sizes while and presents comparison with Lyman Break Galaxies. Finally, §8 summarizes the main conclusions. Throughout this paper, we use a cosmology with , and . Magnitudes are given in the AB-system.
2. The Data
The Ultra Deep Field (UDF) provided the deepest look at the universe with HST taking advantage of the large improvement in sensitivity in the red filters that ACS provides. In parallel to the ACS UDF other instruments aboard HST also obtained deep images (Fig. 1). In this paper we analyze the portion of the data taken with the WFPC2 (F300W) which falls within the GOODS-S area (Orient 310/314); another WFPC2 image overlaps with the Galaxy Evolution From Morphology and SEDs (GEMS) survey area. Each field includes several hundred exposures with a total exposure time of 323.1 ks and 278.9 ks respectively. The 10 limiting magnitude measured over 0.2 arcsec2 is 27.5 magnitudes over most of the field, which is about 0.5 magnitudes deeper than the F300W image in the HDF-N and 0.7 magnitudes deeper than that in the HDF-S.
2.1. Data Processing
A total of 409 WFPC2/F300W parallel images, with exposure times ranging from 700 seconds to 900 seconds overlap partially with the GOODS-S survey area. Each of the datasets was obtained at one of two orientations of the telescope: (i) 304 images were obtained at Orient 314 and (ii) 105 images were obtained at Orient 310.
We downloaded all 409 datasets from the MAST data archive along with the corresponding data quality files and flat fields. By adapting the drizzle based techniques developed for data processing by the WFPC2 Archival Parallels Project (Wadadekar et al. 2005), we constructed a cosmic ray rejected, drizzled image with a pixel scale of 0.06 arcsec/pixel. Small errors in the nominal WCS of each individual image in the drizzle stack were corrected for by matching up to 4 star positions in that image with respect to a reference image.
Our drizzled image was then accurately registered with respect to the GOODS images by matching sources in our image with the corresponding sources in the GOODS data, which were binned from their original scale of 0.03 arcsec/pixel to 0.06 arcsec/pixel. Once the offsets between the WFPC2 image and the GOODS image had been measured, all 409 images were drizzled through again taking the offsets into account, so that the final image was accurately aligned with the GOODS images.
The WFPC2 CCDs have a small but significant charge transfer efficiency problem (CTE) which causes some signal to be lost when charge is transferred down the chip during readout. The extent of the CTE problem is a function of target counts, background light and epoch. Low background images (such as those in the F300W filter) at recent epochs are more severely affected. Not only sources, but also cosmic rays leave a significant CTE trail. We attempted to flag the CTE trails left by cosmic rays in the following manner: if a pixel was flagged as a cosmic ray, adjacent pixels in the direction of readout (along the Y-axis of the chip) were also flagged as cosmic-ray affected. The number of pixels flagged depended on the position of the cosmic ray on the CCD (higher row numbers had more pixels flagged). With this approach, we were able to eliminate most of the artifacts caused by cosmic-rays in the final drizzled image.
3. Catalogs
We detected sources on the U-band image using SExtractor (SE) version 2.3.2 (Bertin & Arnouts 1996). Our detection criterion was that a source must exceed a sky threshold in 12 contiguous pixels. We provided the weight image (which is an inverse variance map) output by the final drizzle process as a MAP-WEIGHT image to Sextractor with WEIGHT-TYPE set to MAP-WEIGHT. This computation of the weight was made according to the prescription of Casertano et al. (2000). It takes into account contributions to the noise from the sky background, dark current, read noise and the flatfield and thus correctly accounts for the varying S/N over the image, due to different number of overlapping datasets at each position. During source detection, the sky background was computed locally. A total of 415 objects were identified by SE.
Fig. 2 shows the cumulative galaxy counts using MAG-AUTO magnitudes (F300W) from SE. Only sources within the region of the image where we have full depth data were included in this computation.
4. Redshifts
Spectroscopic redshifts are available for 12 of the objects in the F300W catalog (taken from the ESO/GOODS-CDFS spectroscopy master catalog111 http://www.eso.org/science/goods/spectroscopy/CDFS-Mastercat/). For the remaining objects, we calculate photometric redshifts using a version of the template fitting method described in detail in Dahlen et al. (2005). The template SEDs used cover spectral types E, Sbc, Scd and Im (Coleman et al. 1980, with extension into UV and NIR-bands by Bolzonella et al. 2000), and two starburst templates (Kinney et al. 1996).
In addition to data from the F300W band, we use multi-band photometry for the GOODS-S field, from to bands, obtained with both and ground-based facilities (Giavalisco et al. 2004). As our primary photometric catalog, we use an ESO/VLT ISAAC -selected catalog including WFPC2 and ACS data, combined with ISAAC data. We choose this combination as our primary catalog due to the depth of the data and the importance to cover both optical and NIR-bands when calculating photometric redshifts. This catalog provides redshifts for 72 of the objects detected in the band. The two main reasons for this relatively low number is that part of the WFPC2 image lies outside the area covered by ACS+ISAAC, and that UV selected objects are typically blue and may therefore be too faint to be included in a NIR selected catalog. For these objects, we use a ground-based photometric catalog selected in the -band which includes ESO (2.2m WFI, VLT-FORS1, NTT-SOFI) and CTIO (4m telescope) observations covering . This adds 146 photometric redshifts. Finally, to derive photometric redshifts for objects that are too faint for inclusion in either of the two catalogs described above, we use ACS and WFPC2 photometry to obtain photometric redshifts. This adds 76 photometric redshifts to our catalog. In summary, we have spectroscopic redshifts for 12 objects and photometric redshifts for 294. Subsequent analysis in this paper, only includes the 306 sources with photometric or spectroscopic redshifts.
The remaining 109 objects in the catalog belong to one or more of the following four categories (i) outside the GOODS coverage area (ii) too faint for photometric redshifts to be determined, (iii) identified as stars (iv) are ‘single’ objects in the optical (and/or NIR) bands but are fragmented into multiple detections in the -band. In such cases, photometric redshifts are only calculated for the ‘main’ object. The redshift distribution of our sample is shown in Figure 3.
To investigate the redshift accuracy of the GOODS method, we compare the photometric redshifts with a sample of 510 spectroscopic redshifts taken from the ESO/GOODS-CDFS spectroscopy master catalog. We find an overall accuracy after removing a small fraction (3%) of outliers with . Since starburst galaxies, which constitute a large fraction of our sample, have more featureless spectra compared to earlier type galaxies with a pronounced 4000Å-break, we expect the photometric redshift accuracy to depend on galaxy type. Dividing our sample into starburst and non-starburst populations, we find 0.11 and 0.07, respectively. This shows that the photometric redshifts for starburst have a higher scatter, the increase is, however, not dramatic. Also, the distribution of the residuals (spectroscopic redshift – photometric redshift), has mean value that is close to zero for both, the starburst and the total population. Therefore, derived properties such as mean absolute magnitudes and mean rest-frame colors, should not be biased due to the photometric redshift uncertainty.
5. Colors
Using information from the photometric redshifts, rest-frame absolute magnitudes and colors are calculated using the recipe in Dahlen et al. (2005). The rest-frame U–B and B–V color distributions (Fig. 4) show a peak in the blue side of the distribution (U–B0.4 and B–V0.1). The majority of the objects that have these colors are actually in the high redshift bin and have as shown in Fig. 5. The bimodality in colors seen in the HDF-S (Wiegert, de Mello & Horellou 2004) is not seen in this sample which is UV-selected and deficient in red objects.
In Fig. 6, we show the rest-frame U–V color and V-band absolute magnitude of all galaxies with . The trend is similar to the one found recently by Bell et al. (2005) for 1,500 optically-selected galaxies using the 24 m data from the Spitzer Space Telescope in combination with COMBO-17, GEMS and GOODS. However, the 25 galaxies in our UV-selected sample, which are in the same redshift range, are on average redder (U–V=0.79 0.13 (median=0.83)) and fainter (MV=–19.1 0.32 (median=–19.3)) than the average values in Bell et al. of all visually-classified types. This is due to the low depth of the GEMS survey coverage (one HST orbit per ACS pointing) which was used to provide the rest-frame V-band data of their sample. The UV-selected galaxies we are analyzing have deeper GOODS multiwavelength data (3, 2.5, 2.5 and 5 orbits per pointing in B, V, i, z, respectively) which GEMS lacks whenever outside the GOODS field.
Fig. 7 shows the U–V color evolution produced using the new version of the evolutionary synthesis code, Starburst99 (Vazquez & Leitherer 2005) with no extinction correction. The new code (version 5.0) is optimized to reproduce all stellar phases that contribute to the integrated light of a stellar population from young to old ages. As seen from Fig. 7, the UV-selected sample has U–V colors typical of ages 100 Myr (U–V 0.3; average U–V=0.790.06). The 25 objects with , for example, have U–V typical of ages 108.4 to 1010 yr. Although we cannot rule out that these object might have had a different star formation history, and not necessarily produced stars continuously as adopted in the model shown, they do not have the U–V colors of young instantaneous bursts (106 yr) which have typically U–V –1.0 (Leitherer et al. 1999).
Vazquez & Leitherer (2005) have tested the predicted colors by comparing the models to sets of observational data. In Fig. 8 we reproduce their Fig. 19, a color-color plot of the super star clusters and globular clusters of NGC 4038/39 (The Antennae) by Whitmore et al. (1999) together with model predictions and our data of UV-selected galaxies. No reddening correction was applied to the clusters which can be as high as E(B-V)=0.3 due to significant internal reddening in NGC 4038/49. The clusters are divided into three distinct age groups (i) young, (ii) intermediate ages (0.25 – 1 Gyr) and (iii) old (10 Gyr). Vazquez & Leitherer analyzed the effects of age and metallicity in the color predictions and concluded that age-metallicity degeneracy in the intermediate-age range ( 200 Myr) is not a strong effect. This is the age when the first Asymptotic Giant Branch (AGB) stars influence the colors in their models. The vertical loop at (B–V) 0.0-0.3 is stronger at solar metallicity and is caused by Red Super Giants which are much less important at lower abundances. We interpret the large spread in the color–color plot of our sample as a combination of age, metallicity and extinction correction. The latter can bring some of the outliers closer to the model predictions, e.g. an E(B-V)=0.12 running parallel to the direction of metallicity and age evolution would bring more objects closer to the younger clusters with ages 0.25 Gyr.
6. Morphology
Classifying the morphology of faint galaxies has proved to be a very difficult task (e.g. Abraham et al. 1996; van den Bergh et al. 1996; Corbin et al. 2001; Menanteau et al. 2001) and automatized methods are still being tested (e.g. Conselice 2003, Lotz et al. 2005). In such a situation, spectral types which are obtained from the template fitting in the photometric redshift technique are a good morphology indicator (e.g. Wiegert, de Mello & Horellou 2004) and in combination with other indicators help constrain galaxies properties. In Fig. 9 we show the distribution of the spectral types of our sample. As expected in a UV-selected sample, the majority of the objects have SEDs typical of late-type and starburst galaxies. This trend does not uniformly hold if we separate the sample in redshift bins (Fig. 10). The lower redshift bin () has a mix of all types whereas the higher redshift bin has mostly (60%) starbursts.
The average absolute magnitudes for the different spectral types in the UV-selected sample are MB= –20.59 0.24 (E/Sa), MB= –18.61 0.17 (Sb-Sd-Im), MB= –17.80 0.16 (Starbursts). The median absolute magnitudes for these types of galaxies are MB= –20.52 (E/Sa), –18.71 (Sb-Sd-Im) and –17.62 (Starbursts) which are, except for the early-types, fainter than the GOODS-S sample MB = –20.6 (E/Sa), –19.9 (Sb-Sd), and –19.6 (starburst) (Mobasher et al. 2004). This difference is due to the magnitude limit (RAB 24) imposed in that sample selection, which was not used in our UV-selected sample; i.e. our UV-selected sample is probing fainter objects at the same redshift range (). Despite the fact that our sample is UV-selected, there are 13 objects with SEDs typical of early-type galaxies (E/Sa) at this redshift range. Two of them are clearly spheroids with blue cores (0.6–0.7, B–V0.7–0.8 and B–22) and are similar to the objects analyzed recently in Menanteau et al. (2005). These objects are particularly important since they can harbor a possible connection between AGN and star-formation.
Studies of the HDF-N has shown how difficult it is, to interpret galaxy morphology at optical wavelengths, when they are sampling the rest frame UV for objects at high redshifts. In the rest-frame near-UV galaxies show fragmented morphology, i.e. the star-formation that dominates the near-UV flux is not constant over the galaxy, but occurs in clumps and patchy regions (Teplitz et al. 2005). Therefore, rest-frame optical wavelengths give a better picture of the structure and morphology of the galaxies. We used the ACS (BVi) images to visually classify our sample and adopted the following classification: (1) elliptical/spheroid, (2) disk, (3) peculiar, (4) compact, (5) low surface brightness, (6) no ACS counterpart. Objects classified as compact have a clear nuclear region with many showing a tadpole morphology; objects classified as peculiar are either interacting systems or have irregular morphologies; objects classified as low-surface-brightness (lsb) do not show any bright nuclear region, and objects classified as (6) are outside the GOODS/ACS image. The distribution of types as a function of redshift is shown in Fig. 11 and reveals two interesting trends: (i) the decrease in the number of disks at and (ii) the increase in the number of compact and lsb galaxies at . Moreover, as seen in Fig. 12, there is a clear difference in the morphology of starbursts (dashed line in the figure) and non-starbursts. Starbursts tend to be compact, peculiar or lsb while the non-starbursts have all morphologies. Since our sample is UV-selected, star-forming disks are either less common at higher or there is a selection effect which is responsible for the trend. For instance, we could have missed faint disks which hosts nuclear starbursts and classified the object as compact. Deeper optical images are needed in order to test this possibility.
In Fig. 13 we compare our sample properties of colors and luminosity with typical objects from Bershady et al. (2000) which includes typical Hubble types, dwarf ellipticals and luminous blue compact galaxies at intermediate redshifts. Clearly, the UV-selected sample has examples of all types of galaxies. However, a populated region of the color-luminosity diagram with MB –18 and B–V 0.5 does not have counterparts either among the local Hubble types or among luminous blue compact galaxies. The average morphology of those objects is (type 4 is compact and type 5 is lsb), 38% are compact and 45% are lsb, the remaining 17% are either spheroids or disks. 87% of them have spectral types 4.33 (spectral types 4 and 5 are typical of Im and starbursts).
7. Sizes
We have used the half-light radii and the Petrosian radii to estimate the sizes of the galaxies following the steps described in Ferguson et al. (2004). Half-light radius was measured with SExtractor and the Petrosian radius was measured following the prescription adopted by the Sloan Digital Sky Survey (Stoughton et al. 2002). In order to estimate the overall size of galaxies, and not only the size of the star-forming region, we measured sizes as close to the rest-frame B band as possible, i.e. objects with 0.20.6 had theirs sizes measured in the F606W image, objects with 0.60.8 in the F775W image, and objects with 0.81.2 in the F850LP image. The correspondence between the two size measures was verified except for a few outliers: (i) three objects with rh 20 pixel (1 pixel = 0.06 arcsec/pixel) and Petrosian radius 50 pixel which are large spirals, and (ii) an object with rh 21 pixel and Petrosian radius 44 pixel which is a compact blue object very close to a low surface brightness object. The half-light radius of the latter object is over-estimated due to the proximity of the low surface brightness object.
In Fig. 14 we show the observed half-light radii (arcsec) distribution per redshift interval. The increase of small objects at 0.81.0 is related to what is seen in Fig.11 where the number of compact galaxies peaks at the same redshift interval, i.e. compacts have smaller sizes. The majority of the objects at 0.81.2 have rh 0.5 arcsec in the rest-frame B band. For comparison with high- samples which measure the sizes of galaxies at 1500 Å, we measured the half-light radius in the F300W images of all galaxies with 0.661.5, corresponding to rest frame wavelength in the range 1200–1800 Å. The average rh is arcsec ( kpc).
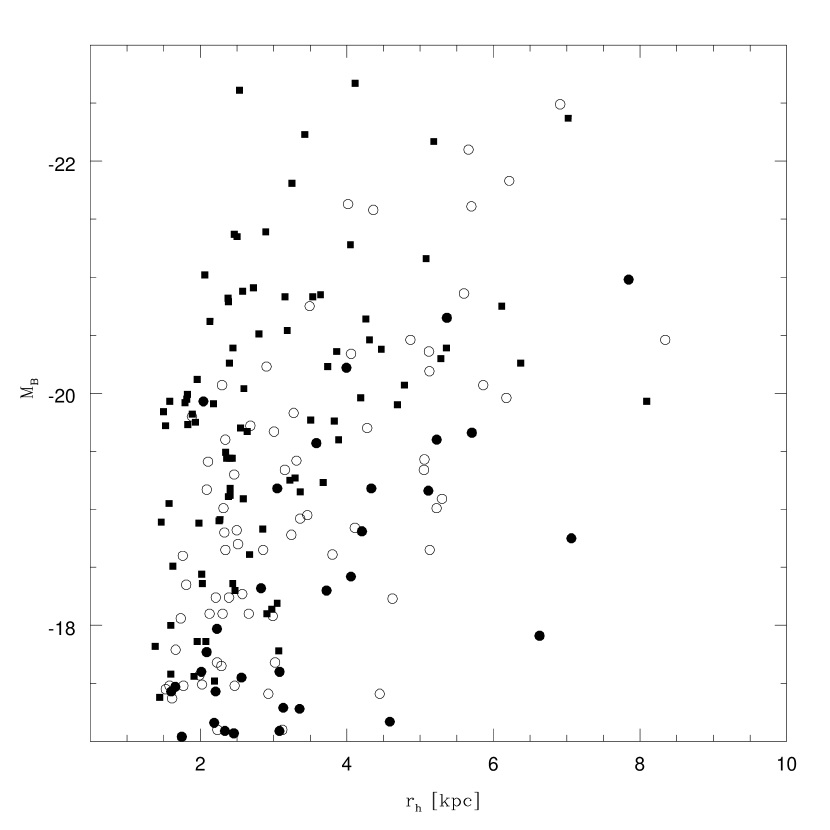
Fig. 15 shows the distribution of the derived half-light radii (kpc) as a function of the rest-frame B magnitudes. Five objects have rh 10 kpc and are not included in the figure. The broad range in size from relatively compact systems with radii of 1.5–2 kpc to very larger galaxies with radii of over 10 kpc agrees with the range in sizes of the luminous UV-galaxies at the present epoch (Heckman et al. 2005). We included in Fig. 15 the low– sample (0.7) from Papovich et al. (2005) which is selected from a near-infrared, flux-limited catalog of NICMOS data of the HDF-N. We have compared rh and MB for the two samples, ours and Papovich et al. (2005), using Kolmogorov-Smirnov (KS) statistics and found that the UV-selected and the NIR-selected samples are not drawn from the same distribution at the 98% confidence level (D=0.24 and D=0.26 for rh and MB, respectively - D is the KS maximum vertical deviation between the two samples). The median values of the UV-selected objects is rh=3.02 0.11 kpc and MB=–18.6 0.1 which are larger and fainter than the NIR-selected sample values of rh= 2.38 0.06 kpc MB=–19.11 0.07. This is due to a number of low surface brightness objects (36% or 16 out of 44) that are found in our sample which are faint (MB ) and large (rh 3 kpc). These objects are not easily detected in NIR but are common in our UV-selected sample due to the depth of the U-band image which can pick up star-forming LSBs.
It is interesting to see how the properties of galaxies in our sample compare with Lyman Break Galaxies at . Despite the fact that they are both UV-selected, LBGs belong to a class of more luminous objects. Typical MB of LBGs at 3 are –23.01 (Pettini et al. 2001) whereas our sample has average MB=–18.430.13. Three color composite images of the most luminous objects in our sample (MB –20.5) as shown in Fig. 16. There is clearly a wide diversity in morphology of these objects. Four of them are clearly early-type galaxies, three are disks showing either strong star formation or strong interaction, and two of them are what we called low surface brightness and compact. LBGs show a wide variety in morphology ranging from relatively regular objects to highly fragmented, diffuse and irregular ones. However, even the most regular LBGs show no evidence of lying on the Hubble sequence. LBGs are all relatively unobscured, vigourously star-forming galaxies that have formed the bulk of their stars in the last 1-2 Gyr. Our sample is clearly more varied: it includes early-type galaxies that are presumably massive and forming stars only in their cores, as well as starburst-type systems that are more similar to the LBGs, although much less luminous. This implies that even the starbursts in our sample are either much less massive than LBGs or are forming stars at a much lower rate or both. The low surface brightness galaxies have no overlap with the LBGs and form an interesting new class of their own.
8. Summary
We have identified 415 objects in the deepest near-UV image ever taken with HST reaching magnitudes as faint as mAB=27.5 in the F300W filter with WFPC2. We have used the GOODS multiwavelength images (B, V, i, z) to analyze the properties of 306 objects for which we have photometric redshifts (12 have spectroscopic redshifts). The main results of our analysis are as follows:
-
1.
UV-selected galaxies span all the major morphological types at 0.2 1.2. However, disks are more common at lower redshifts, 0.2 0.8.
-
2.
Higher redshift objects (0.7 1.2) are on average bluer than lower and have spectral type typical of starbursts. Their morphologies are compact, peculiar or low surface brightness galaxies.
-
3.
Despite of the UV-selection, 13 objects have spectral types of early-type galaxies; two of them are spheroids with blue cores.
-
4.
The majority of the UV-selected objects have rest-frame colors typical of stellar populations with intermediate ages 100 Myr.
-
5.
UV-selected galaxies are on average larger and fainter than NIR-selected galaxies at 0.7 1.4; the majority of the objects are low-surface-brightness.
-
6.
The UV-selected galaxies are on average fainter than Lyman Break Galaxies. The ten most luminous ones span all morphologies from early-types to low surface brightness.
References
- Abraham et al. (1996) Abraham, R.G., et al., 1996, MNRAS, 279, 47
- Bell et al. (2004) Bell, E. F., et al., 2004, ApJ, 608, 752
- Bershady et al. (2000) Bershady, M. A., Jangren, A., & Conselice, C. J. 2000, AJ, 119, 2645
- Bertin et al. (1996) Bertin, E., & Arnouts, S. 1996, A&AS, 117, 393
- Bolzonella et al. (2000) Bolzonella, M., Miralles, J. -M., & Pelló, R. 2000, A&A, 363, 476
- Casertano et al. (2000) Casertano, S., et al. 2000, AJ, 120, 2747
- Coleman et al. (1980) Coleman, G. D., Wu, C.-C., & Weedman, D. W. 1980, ApJS, 43, 393
- Conselice (2003) Conselice, C. J. 2003, ApJS, 147, 1
- Corbin et al. (2003) Corbin, M. R., Urban, A., Stobie, E., Thompson, R. I., & Schneider, G. 2001, ApJ, 551, 23
- Dahlen et al. (2005) Dahlen, T., et al. 2005, ApJ, 631, 126
- Ferguson et al. (2004) Ferguson, H. C., et al., 2004, ApJ, L107
- Giavalisco et al. (2004) Giavalisco, M., et al., 2004, ApJ, 600, L93
- Heavens et al. (2004) Heavens, A, Panter, B., Jimenez, R., & Dunlop, J. 2004, Nature, 428, 625
- Heckman et al. (2005) Heckman, T. M., et al., 2005, ApJ, 619, 35
- Kinney et al. (1996) Kinney, A. L., Calzetti, D., Bohlin, R. C., McQuade, K., Storchi-Bergmann, T., & Schmitt, H. R. 1996, ApJ, 467, 38
- Leitherer et al. (1999) Leitherer, C., et al. 1999, ApJS, 123, 3 (Starburst99)
- Lotz et al. (2005) Lotz, J. M., Primack, J., & Madau, P. 2005, AJ, 128, 163
- Madau (1996) Madau, P., et al. 1996, MNRAS, 283, 1388
- Menanteau (2001) Menanteau, F., Abraham, R.G., & Ellis, R.S. 2001, MNRAS, 322, 1
- Mobasher (2004b) Mobasher, B., et al., 2004, ApJ, 600, L143
- Papovich (2005) Papovich, C., et al., 2005 ApJ accepted (astro-ph 0501088)
- Pettini (2001) Pettini, M., et al., 2001, ApJ, 554, 981
- Steidel (1995) Steidel, C. C., Pettini, M., & Hamilton, D. 1995, AJ, 119, 2519
- Stought (2002) Stoughton, C., et al. 2002, AJ, 123, 485 (erratum 123, 3487)
- Teplitz (2005) Teplitz, H., et al. 2005 in preparation
- van (1996) van den Bergh, S., Abraham, R.G., Ellis, R.S., Tanvir, N.R., Santiago, B.X., Glazebrook, K.G., 1996, AJ, 112, 359
- Vazquez (2005) Vazquez, G. A., Leitherer, C. 2005, ApJ, 621, 695
- Wadadekar (2005) Wadadekar et al. 2005, PASP, submitted
- Whitmore (1999) Whitmore, B. C., et al., 1999, AJ, 118, 1551
- Wiegert (2004) Wiegert, T., de Mello, D. F., & Horellou, C. 2004, å, 426, 455