Properties of Resolved Star Clusters in M51
Abstract
We present a study of compact star clusters in the nearby pair of interacting galaxies NGC 5194/95 (M51), based on multifilter Hubble Space Telescope WFPC2 archival images. We have detected 400 isolated, resolved clusters in five HST WFPC2 fields of the two galaxy system. Due to our requirement that the clusters be detected based only on their morphology, which results in the selection of relatively isolated objects, we estimate that we are missing the majority (by a factor 4–6) of clusters younger than 10 Myr due to the extreme crowding in the spiral arms and star-forming regions. Hence we focus on the cluster population older than 10 Myr. An age distribution of the detected clusters shows a broad peak between 100–500 Myr, which is consistent with the crossing times of the companion galaxy NGC 5195 through the NGC 5194 disk estimated in both single and multiple-passage dynamical models. We estimate that the peak contains 2.2–2.5 times more clusters than expected from a constant rate of cluster formation over this time interval. While there is also evidence for individual peaks near 100 Myr and 500 Myr in the cluster age distribution (consistent with the predictions of multiple-passage models), this result requires verification. We estimate the effective radii of our sample clusters and find a median value of 3–4 pc. Additionally, we see correlations of (increasing) cluster size with cluster mass (with a best fit slope of ) at the level, and with cluster age () at the level. Finally, we report for the first time the discovery of faint, extended star clusters in the companion, NGC 5195, an SB0 galaxy. These have red [] colors, effective radii pc, and are scattered over the disk of NGC 5195. Our results indicate that NGC 5195 is therefore the third known barred lenticular galaxy to have formed so-called “faint fuzzy” star clusters.
Subject headings:
galaxies: individual (M 51) — galaxies: spiral — galaxies: evolution — galaxies: star clusters1. INTRODUCTION
Star cluster systems track the star formation histories of their host galaxies. While these star clusters have been relatively well studied in nearby starburst and strongly interacting galaxies (e.g., Meurer et al. 1995; Whitmore et al. 1999; also see compilations in Whitmore 2003; Larsen 2004), there remains much to learn concerning the properties of cluster systems in more “normal” environments, such as those found in spiral galaxies.
The M51 system (NGC 5194/95) is a famous, nearby interacting pair of galaxies. NGC 5194 is a grand design, Milky-Way-like (Sbc) spiral, and its close companion NGC 5195 is a dwarf barred spiral of early-type (SB0). NGC 5194 is almost face-on (with the eastern side tilted by an estimated 20 degrees; Tully (1974)), and shows several remarkable features in addition to the two grand-design spiral arms. These include faint extended tidal features deviating from the spiral arms (Burkhead, 1978), and a very long (90 kpc) HI tidal tail () extending to the west (Rots et al., 1990). While the optical spectrum of NGC 5194 is typical for Sbc galaxies, that of NGC 5195 shows strong Balmer absorption lines indicating star formation activity in the recent past (Kennicutt, 1998).
Given the crowded conditions in spiral disks due to on-going star formation, the excellent resolution provided by the Hubble Space Telescope (HST) is required to study the cluster populations in external spirals. Prior to the beginning of this study, the HST archive contained five distinct WFPC2 field pointings of the M51 system. Bik et al. (2003) and Bastian et al. (2005) have recently made detailed studies using observations from two of these pointings, including all available filters. Some NICMOS imaging is available for the very center of NGC 5194.
In this paper, we present a study of star clusters in the M51 system, based on the analysis of HST WFPC2 archive images of the five fields covering roughly 60% of the optically bright regions of the two galaxies. We do not repeat the Bastian et al. (2005) work here, but rather use different detection techniques in order to minimize contamination from blends in our final cluster sample, and include three additional WFPC2 fields to make a more general study of the M51 system. Because of this selection based on morphology and isolation, there is a strong bias in our sample against the young clusters (e.g., –20 Myr), which tend to form in very crowded regions.
This paper is organized as follows: Section 2 describes the data, reduction, cluster selection and photometry. §3 analyses the properties of the detected clusters including age, reddening, mass, size, and spatial distribution, and a discussion of the main results is presented in §4. Finally, a summary is provided in §5.
2. DATA, CLUSTER SELECTION, AND PHOTOMETRY
2.1. Data and Reduction
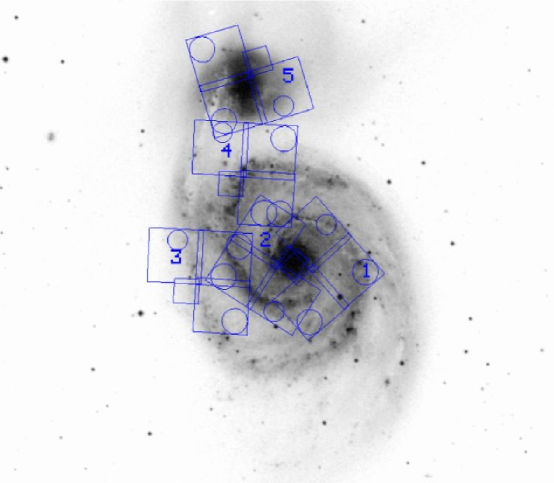
We have examined five archival HST WFPC2 pointings in M51. All have at least two filter observations. As with any study based on archival data, we are limited by the availability of filters, exposure times, and field pointings. Figure 1 shows the locations of the five fields overlaid on a Digitized Sky Survey image. The fields are numbered as in Table 1, which contains general data properties, such as the field identification, central right ascension (RA) and declination (DEC), and the number and exposures in the various filters. Surveyed fields in this study cover different environments, from the nuclear region to both arm and inter-arm regions, as well as some portions between NGC 5194 and its barred lenticular companion NGC 5195. The center of NGC 5194 is included in Fields 1 and 2 (on the PC chip) and the center of NGC 5195 is almost centered in Field 5.
Field 1 has UBVI and imaging, while Fields 2, 3, and 4 have BVI observations (Field 5 is only imaged in VI). Field 2 additionally has an band image, and partial overlap with band observations. All data was requested from the HST Archive with “on-the-fly” calibrations, which automatically use the best reference files for calibration. The WFPC2 pipeline steps include: bad pixel masking, A/D correction, bias and dark subtraction, and flat field correction.
Multiple individual images in a given filter were combined using the COMBINE task in STSDAS with the CRREJECT option in order to eliminate cosmic rays (CRs) and increase the signal-to-noise ratio. The IRAF task COSMICRAYS was then run on the combined images to eliminate remaining CRs and individual hot pixels. In order to correct for the well known geometric distortion in the WFPC2 CCDs, as well as the 34th row problem, each image was multiplied by a correction image.
We used the F656N filter observations to determine whether a source in Field 1 has associated emission (the presence of helps break the degeneracy between age and reddening which exists in analysis based only on broad-band colors). The flux was determined by using a scaled version of the band image of Field 1 to subtract continuum flux and reveal the sites of ionized gas emission. We estimated the continuum level from the I band images from several bright, isolated objects. Although the offset in wavelength between and the I band is not optimal, this technique is sufficient for our purposes, since emission drops off rapidly over the first several Myr in the lifetime of a cluster.
We adopt a distance to M51 of Mpc (distance modulus, ), determined from the planetary nebula luminosity function (Feldmeier, Ciardullo, & Jacoby, 1997). The corresponding linear scale is 40.7 pc arcsec-1. The HST WFPC2 has pixel sizes of in the three Wide Field CCDs, and in the Planetary Camera CCD. At the assumed distance, the four M51 fields (1–4) cover a range of (projected) galactocentric distances from the nucleus to (14.2 kpc), and a total area of square arcminutes (). The foreground reddening toward M51 is low (; Schlegel, Finkbeiner, & Davis, 1998).
2.2. Cluster Selection
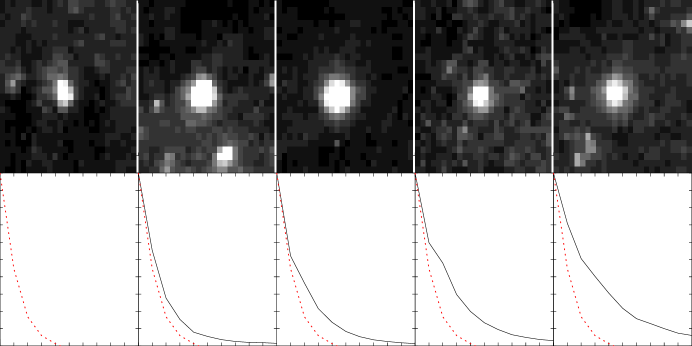
Images of nearby spiral galaxies contain individual stars (both foreground and residing in the host galaxy itself), background galaxies, star clusters, and numerous observational blends, where several objects are superposed. While a visual inspection of these blends clearly indicates the presence of two or more overlapping objects, they are often detected as a single object by the finding algorithm. Hence, detecting star clusters in the complex, crowded environments of nearby spirals is not trivial. However, within at least 10 Mpc, compact clusters can generally be detected based on their morphological properties in HST images. One goal of this work is to correlate cluster sizes with other properties; therefore we take a conservative approach and study only relatively isolated and well resolved clusters in M51. To accomplish this, we make use of the information in radial profiles of detected objects, plus other morphological criteria, in order to separate clusters from stars, background galaxies, and blends. Figure 2 shows band images and radial profiles of one star and four clusters in M51, as an example. We note that compact clusters with pc ( pc) at the distance of M51 are not clearly resolved on the WF (PC) CCDs.
In order to identify star clusters using morphological information, we used SEXTRACTOR (Bertin & Arnouts, 1996) to detect objects in the band images. A threshold of was used to avoid large numbers of detections of very faint objects (generally noise artifacts) in our non-uniform background, crowded fields. A number of morphological parameters were output for each detected object. In addition, point spread function (PSF) fitting was performed on each object. Isolated stars were chosen automatically using size, shape, and neighbor information, and used to create a PSF. This PSF was then fit to all cataloged objects using the IRAF task ALLSTAR, which outputs a goodness of fit statistic, and a measure of object sharpness. Cluster candidates were then chosen based on their FWHM ( pix), ellipticity (), (), and sharpness () parameters. The FWHM distribution for the entire catalog of detected objects shows a peak near 1.5 pixels, which is the FWHM of the (undersampled) PSF of the WFPC2. Although the FWHM distribution dips sharply around 1.8 pixels, it is a continuous distribution. Our experiments showed that if the FWHM threshold was decreased below 1.8 pixels, a number of apparently unresolved objects were added to our catalog of cluster candidates, and if we increased the FWHM criterion to 2.0 pixels, we started to lose a small fraction of clearly resolved objects from our cluster catalog. In general, however, the largest variations in the selected cluster candidates with FWHM came from the very crowded, star-forming regions, which we avoided (as described below).
The FWHM and sharpness parameters allowed us to separate extended sources from stars, and the ellipticity criterion eliminates a handful of background galaxies, and more importantly, a large number of blends consisting of superposed stars (measured FWHMs of these multiple sources are typically larger than those of individual stars, and thus overlap the measurements for star clusters).
Visual inspection of the initial cluster candidates showed a large number of objects residing in crowded OB associations and spiral arm regions, which were clearly superpositions of several objects. Because these have similar parameters to isolated clusters, we experimented with a number of techniques for automatically eliminating these spurious cluster candidates. After extensive testing, we eliminated objects which had two or more cluster candidates within 10 (22) pixels for the WF (PC) CCDs. This eliminated most of the obvious blends in crowded regions. Remaining blends were then rejected by a final visual inspection. Although it is not clear what fraction of these detected blends are actual clusters, we are almost certainly excluding a large number of real clusters from our catalog. In §4.2 we discuss how our technique of excluding objects detected as cluster candidates in very crowded regions impacts the age distribution of the overall cluster population.
This prescription resulted in the detection of 392 isolated clusters in M51, with magnitudes down to 23.5. While this is clearly not a complete list of clusters in this two-galaxy system, it is a relatively clean cluster sample. Thus, by restricting our sample to isolated, resolved clusters, our sample is mostly insensitive to small changes in the (FWHM, ellipticity, sharpness and ) selection criteria.
Artificial cluster experiments were performed by adding artificial clusters (generated from the ADDSTAR task in IRAF, where instead of stars, clusters were selected) to our images, which were then rerun through SEXTRACTOR and the automated portion of our detection algorithm. These ’fake’ clusters were added in groups of 50 in randomly placed positions on each chip, and then detected and re-photometered. Thus we make the assumption that as long as a cluster makes it through the automated pipeline, it would also be retained during the final visual inspection phase (which was used primarily to weed out blends). In Figure 3 we show a band completeness function for Field 1. Averaged over all environments available in Field 1, Figure 3 shows that the 50% completeness limit is reached at . However, the typical S/N for clusters as faint as is too low to make an accurate estimate of the cluster size via fitting an analytic function (as described in §3.4). Therefore, in the following analysis, we generally adopt a detection limit of , where clusters are detected with a S/N of 30 or higher.
2.3. Comparison of Cluster Candidates with Previous Works
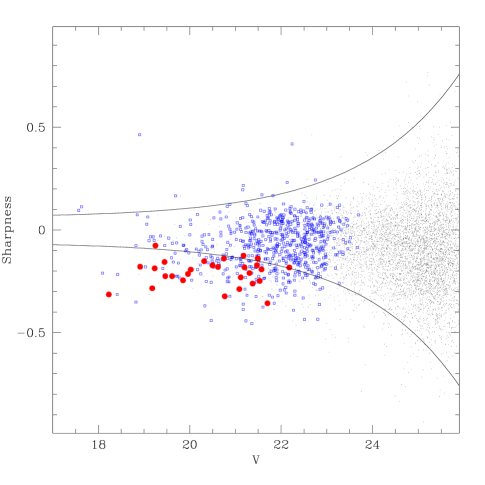
Bik et al. (2003) presented a list of 877 cluster candidates in the WF2 CCD of Field 2 (461 of these are brighter than ), while we only have 30 clusters in the same region—a significantly smaller number. While this is partly by design since we focus on relatively isolated clusters which are brighter than , this is still a large difference. To understand this large discrepancy between the two studies, we made a sanity check on our cluster selection techniques using a PSF fitting algorithm. In Figure 4 we plot sharpness vs. magnitude for all the sources detected in the WF CCDs of Field 2 (dots), including our clusters (filled circles) and Bik et al. (2003) cluster candidates (open squares) from the same image. The solid lines represent boundaries which were defined from the data with positive sharpness (where there is expected to be no extended objects) using the exponential functions given in Dolphin & Kennicutt (2002). This figure establishes that all the candidates in our sample are below (or along) the lower boundary, where clusters are expected to reside, while most of the cluster candidates in the Bik et al. (2003) sample are above the lower boundary (in the regime occupied by point sources). Hence, the Bik et al. sample is potentially contaminated by a large number of stars. However, this issue was revisited in Bastian et al. (2005), where the authors also use size measurements to distinguish point sources (presumably stars) from resolved star clusters, and find that restricting their sample to resolved objects does not change the main conclusions of their study. We note that due to our selection criteria, the most compact star clusters (which are barely resolved) are likely missing from our sample.
Many of the objects which fall in the regime of resolved star clusters in Figure 4, but were not selected by us as such, are either fainter than we probe in our study (size estimates become very difficult at these faint magnitudes), or are in very crowded regions. We can use the additional cluster candidates selected by the PSF fitting algorithm (and seen in Figure 4) to estimate how many clusters we are missing from our sample. By counting the total number of cluster candidates (below the envelope) in this Figure which are brighter than , and comparing with the total number of clusters we have selected (filled circles), we estimate that our current “clean” cluster sample underestimates the number of resolved clusters by a factor 4–6 in this magnitude range. In §3.3 we use integrated colors to assess the age distribution of these rejected cluster candidates.
2.4. Cluster Photometry
2.4.1 Photometry
Aperture photometry was obtained using the PHOT task in DAOPHOT (Stetson, 1994). We used a small aperture radius ( pixels) to determine cluster colors, in order to minimize contamination due to neighboring sources and to reduce the impact of uncertainties in the background determination. However, there is a significant fraction of light outside this radius, which varies based on how extended an object is, and which directly impacts the total magnitude measurements (and hence cluster mass estimates).
In order to measure the aperture corrections for our cluster candidates, we identified relatively isolated clusters on the PC CCD and WF CCDs. The final aperture corrections of mag (PC) and mag (WF CCDs) were added to the cluster magnitudes. While aperture corrections are dependent on intrinsic object size, making absolute magnitudes somewhat uncertain (see §2.4.2), we note that the colors of the clusters are largely unaffected.
The following steps were used to transform measured WFPC2 instrumental magnitudes to Johnson-Cousins , , , and magnitudes: (i) the instrumental magnitudes were corrected for the charge-transfer efficiency (CTE) loss, using the prescription given by Dolphin (2000)111see http://www.noao.edu/staff/dolphin/wfpc2_calib/ for updated calibrated information.; (ii) the corrected instrumental magnitudes were converted to standard Johnson-Cousins , , , and magnitudes. Using Equation 8 and Table 7 of Holtzman et al. (1995), the magnitudes were derived iteratively using WFPC2 observations in two filters, with all zeropoints substituted from Dolphin (2000).
2.4.2 Comparison with Previous Work
Here, we compare our photometric measurements of the objects in common with previous studies (Larsen, 2000; Lamers et al., 2002; Bik et al., 2003), including both ground-based and photometry. Among the 69 cluster candidates discovered in ground-based images by Larsen (2000), we find 13 objects in common. Our colors agree well, with . However, our total magnitudes are typically fainter by (where means this study minus Larsen, 2000).
Larsen (2000) also used the HST observations of Field 2 to compare with his ground-based photometry for some clusters. He was able to locate ten cluster candidates in the HST image. Of these ten, we find that four are clearly blends. A comparison between this work and that of Larsen (2000) shows that the HST photometry are in good agreement—the mean difference in the band magnitudes is 0.002 mag, and the mean difference in color is 0.048 mag, in the sense that our color is slightly redder than that given in Larsen (2000). This may result from local background determinations and slight differences in CTE corrections. Overall however, we find that our photometry is in very good agreement with the HST photometry from Larsen (2000), and conclude that the large uncertainties reported in the previous paragraph are due to the ground-based measurements rather than a problem with our HST photometry (as also seen from Table 2 in Larsen, 2000).
Bik et al. (2003) presented photometry of the objects in the image of the WF2 CCD of Field 2. The mean differences in photometry for 28 objects in common with our study are: , , and where means this study minus Bik et al. (2003). Again, there are some systematic differences in the total magnitudes between the two works, but the colors are in reasonably good agreement.
3. Analysis
3.1. Cluster Age, Extinction, and Mass Derivation
In order to determine the age and reddening () intrinsic to each cluster, we compared the observed magnitudes with spectral energy distributions (SED) derived from the theoretical evolutionary synthesis models of Bruzual & Charlot (2003; hereafter BC03). The models assume that the stars have a Salpeter (1955) initial-mass function (IMF) slope , with lower mass cutoff and upper mass cutoff . For each metallicity, the models span ages from 1 Myr to 15 Gyr.
These spectral synthesis models are available for a number of metallicities; however, due to the well known age-metallicity-reddening degeneracy in integrated cluster colors, we need to adopt a specific value for the metallicity, since our dataset is not sufficient to solve for all three parameters independently. Observations of H II regions in M51 establish that the current metallicity of the gas is approximately solar (e.g., Diaz et al., 1991; Hill et al., 1997), hence we adopt this value for the subsequent analysis. Tests show that the assumed metallicity has a negligible effect on the derived ages and extinction values for younger stellar populations ( Gyr), but preferentially affects the ages estimated for older clusters, where metallicity influences become more pronounced than those of age in the integrated colors.
For clusters in Fields 1 and 2, where there are a minimum of four broad-band observations, we fit the observed SEDs of the clusters with the models using a standard minimization technique. For each BC03 model age, we compare the observed SED to the model, which was reddened by values between 0.0 and 1.0 in steps of 0.02. This range of reddening values appears reasonable, as previous studies have found typical color excess values of 0.2 in the bulge of NGC 5194 (Lamers et al., 2002). The fit with a minimum value of was adopted as the best fit age/ combination. We use the measurements as a “knife-edge,” in the sense that if emission is measured (from the continuum subtracted image) with S/N = 5 or higher, then the is given a high weight in the SED fitting, which effectively prefers a younger age.
For clusters in Fields 3 and 4, where there is no band imaging available, it is not possible to unambiguously separate reddened young clusters from ancient objects. Therefore, we selected ancient cluster candidates by requiring and . This results in the selection of 37 clusters with colors similar to those of Galactic globular clusters in NGC 5194. However, a visual check shows that three of those with only BVI filter observations fall directly in active star forming regions (i.e., in dust lanes). These are assumed to be reddened young objects rather than ancient star clusters, giving a total of 34 ancient star cluster candidates in NGC 5194. The properties of these objects are studied in detail in Chandar, Whitmore, & Lee (2004), and the main conclusion is that we find a lack of red (metal-rich) globular clusters in NGC 5194.
For the clusters where there are only BVI observations it is difficult to get a handle on the reddening for each cluster individually, since changes in extinction mimic changes in age. Instead, we adopt the technique described in Lamers et al. (2002). We adopted the probability distribution of found for clusters in Field 1. This results in a value at each model age for every value of . The reduced which results from the fit is used to distinguish between accepted and rejected fits. For the final age estimate, we average the ages, weighted by the probability that each value of occurs. While the age and reddening values for any given cluster using this technique may be incorrect, statistically the cluster populations age and reddening distributions should be reasonably well represented.
Cluster masses were derived by combining the ratio of the best fit (age) BC03 model with the measured band cluster luminosity, foreground extinction, derived cluster extinction, and assumed distance to M51. Masses of the clusters range from to 6.3, whereas the average Galactic globular cluster mass is (Harris, 1991). The most massive cluster in the sample is estimated to have . Apparent mean masses of younger clusters are lower than those of older clusters, although it should be kept in mind that this is largely due to selection effects (e.g., the magnitude threshold removing the older, low mass clusters). The mass function of young clusters in M51 appears to include objects which are comparable in mass to typical Milky Way globular clusters.
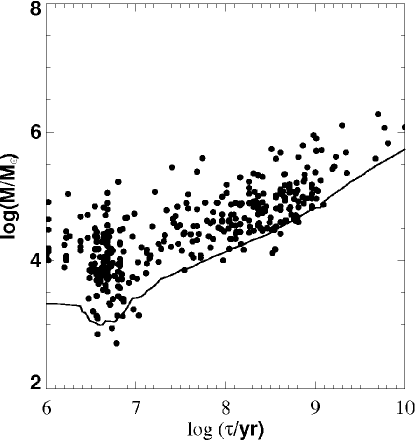
In Figure 5 we show the derived age versus mass plot for our M51 cluster sample. The solid line shows the fading with age for a cluster with , based on the predictions of the BC03 models. Hence, our study cannot detect ancient clusters (few Gyr) with masses lower than . The upper envelope in this figure can be represented by a linear line with a slope of 0.4. This trend is almost certainly due to a size-of-sample effect (i.e., the total original number of clusters with ages in the range is likely to be several orders of magnitude larger than in the range , resulting in the formation of clusters with larger masses in older age bins).
There are several interesting features in Figure 5. First, we note the apparent “gap” between 10–30 Myr in the cluster distribution. This is an artifact common to age-dating techniques which rely on the comparison of integrated colors with the predictions of evolutionary synthesis models. The predicted colors in this age range change rapidly, and thus small photometric uncertainties in measured cluster colors make it difficult to obtain best fit ages in this range. A second prominent feature in the age vs. mass diagram is an apparent over-density of clusters with ages (even despite the fact that we are missing a large number of such young objects in our sample). This over-density of clusters at very young ages is likely not entirely due to a very recent, enhanced star formation rate, but rather related to the rapid destruction of clusters, as discussed in Fall (2004); Whitmore (2004); Fall, Chandar, & Whitmore (2005). Finally, we note that there appears to be a second over-density in the cluster population in the range . We believe this feature does represent an actual enhancement in the star formation rate in the M51 system. In §4.3 we discuss and quantify this effect.
3.2. Comparison of Ages Derived from UBVI filters vs. BVI Filters
In the previous section, we described our techniques for deriving ages and reddening values depending upon whether there are three or four filters available. Because only Field 1 has complete band observations, here we discuss the limitations of the age derivation from three filters, and the impact this may have on our conclusions concerning the cluster age distribution.
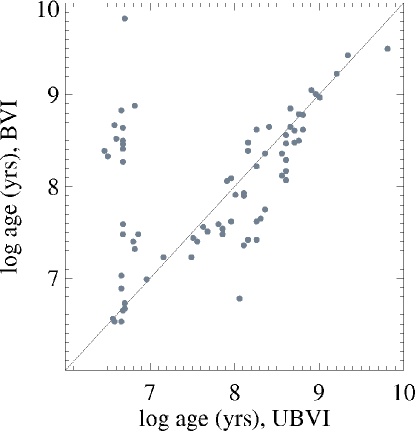
Figure 6 shows clusters from Field 1 which have reasonably well fit ages from both UBVI and BVI SED fitting. The solid line shows the one-to-one correspondence of ages. Overall, we find that there is good correlation between the ages estimated with the two techniques. The obvious exception to this are the 12 points which have young age estimates based on UBVI filters (), but have significantly larger estimates () from BVI. As it turns out, these objects are reddened young star clusters; their BVI colors are typical of older objects, but with the addition of the band flux, the degeneracy between age and reddening can be broken. We statistically corrected the age distribution of our cluster population for this bias in age estimates when only BVI filters were available.
3.3. Assessing Sample Bias Due to Selection
In §2.2 we described our selection of star cluster candidates based on morphological criteria. We found that a number of objects are selected during automated detection in very crowded inner and spiral arm regions. A number of these are clearly superpositions of multiple sources or blends. While at least some of these objects are likely star clusters, based on the resolution of the WFPC2 data it is not possible for us to directly assess what fraction falls in this category. Therefore in this work, we focus on the properties of the relatively isolated cluster population in M51. However, in order to draw any global conclusions concerning the M51 cluster population, we must first quantify properties of clusters which may have been excluded.
To accomplish this we studied Field 1, which has the most complete filter selection available (UBVI). We used our original object catalogs to locate cluster candidates which were eliminated due to crowding, and performed aperture photometry as was described in §3.1. By comparing measured colors with evolutionary synthesis model predictions, as we have done for the sample clusters, we find that 80–90% of the objects eliminated due to crowding have ages younger than 10 Myr. A visual inspection of the location of these sources in the continuum subtracted image confirms that most of these fall in regions where the emission from ionized gas is strong, and hence in regions dominated by very young stellar populations. Therefore, we conclude that our current sample is missing a large fraction (by factors 4–6 as quantified in §2.3) of very young clusters, but is not missing a significant population of older objects.
3.4. Cluster Sizes
Intrinsic sizes for our entire cluster sample were measured using the ISHAPE routine. A detailed description of the code is given in Larsen (1999), along with the results of extensive performance testing. Essentially, ISHAPE measures intrinsic object sizes by adopting an analytic model of the source and convolves this model with a (user-supplied) point spread function (PSF), and then adjusts the shape parameters until the the best match is obtained. King model profiles with concentration parameters of were convolved with a PSF, and fit individually to each object. The input PSF to this algorithm is crucial. Hence we created a PSF by hand-selecting stars in the image, and then compared the results with those from a subsampled TinyTim PSF (when the TinyTim PSF was used, convolution with the WFPC2 diffusion kernel was implemented as recommended in the ISHAPE manual). We found that the size estimates from ISHAPE using these two PSFs differed by less than 20%. Final measurements were made using the TinyTim PSF. One PSF was generated for the PC CCD, and one for the WF CCDs. The size measurements were made on the band images.
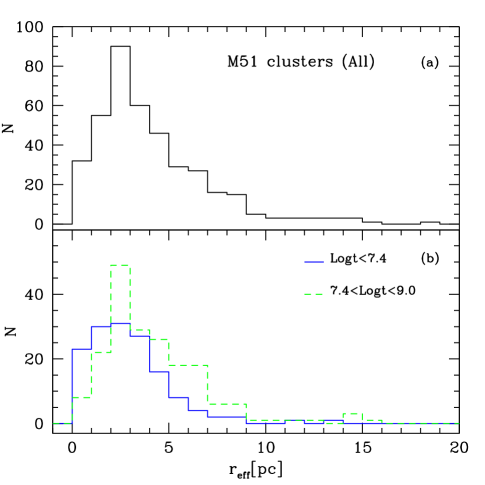
Figure 7 displays the distribution of cluster effective radii. Our fixed size cut at a SEXTACTOR FWHM of 1.8 pixels maps roughly to an ISHAPE FWHM measurement of 0.2 pixels; 0.2 pixels is recommended in Larsen 1999 as a cutoff for separating resolved and unresolved objects. At the distance of M51, this FWHM corresponds to 0.8 pc or of 1.2 pc. In the current dataset our choice in SEXTRACTOR FWHM cutoff is reflected by the rapid drop in measured cluster sizes below 2 pc. The mean size of our entire cluster sample is , and the median size is 3.1 pc. This is very similar to the typical 3–4 pc found for Galactic globular cluster effective radii (Harris, 1996). However, there appears to be a “tail” in the size distribution, out to significantly larger radii. Given that clusters with size measurements pc have a large range of S/N values (from 30–150) which overlap those for the bulk of the more compact clusters, we rule out that objects with large size measurements are simply due to larger measurement errors. We have checked the location of the extended clusters in the WFPC2 images, and these also do not fall preferentially near the edges of a CCD.
4. DISCUSSION
4.1. Correlation of Cluster Sizes with Age and Mass
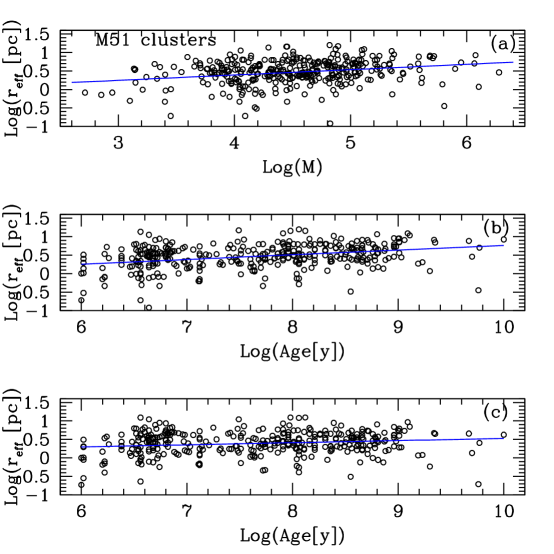
In general, it might be expected that if a cluster forms once its parent molecular cloud reaches a critical density, the resulting cluster would also reflect this density. This would result in an observed increase in the cluster size with cluster mass (with cluster size increasing proportional to ). In Figure 8 we plot the measured sizes for our NGC 5194 cluster sample as a function of derived mass (top panel) and age (middle panel). The solid lines in each panel represent the best linear fit. The top panel in Figure 8 has a best fit slope of . This fit formally indicates a correlation at the level between cluster and mass, albeit with large scatter. This is similar (within ) to the result found by Larsen (2004) for a large sample of young star clusters in 18 nearby spirals using HST WFPC2 imaging, and by Hunter et al. (2003) for clusters in the Large and Small Magellanic Clouds. Bastian et al. (2005) however, did not see this trend in their sample of M51 clusters. Despite the trend of increasing cluster size with mass, the observed relation for clusters in M51 is significantly shallower than predicted by a constant density relation.
In the middle panel of Figure 8 we see a higher fraction of very compact ( pc) young clusters in our sample, relative to similarly compact clusters at older ages. The best linear fit to the data give a slope of , implying a trend of increasing cluster size with age. However, since we found a relationship between cluster size and mass, the observed size–age relationship may simply reflect the fact that the observed mass limit changes with age (such that more massive and larger clusters are preferentially detected at older ages). In order to establish whether there is an intrinsic trend between cluster sizes and ages, we subtracted out the derived cluster mass-size relation from the cluster sizes, and refit the data (as shown in the bottom panel of Figure 8). This results in a linear fit of ; a weaker trend than found before correcting for the trend of increasing size with mass, but significant at the level.
4.2. Cluster Age and Spatial Distributions
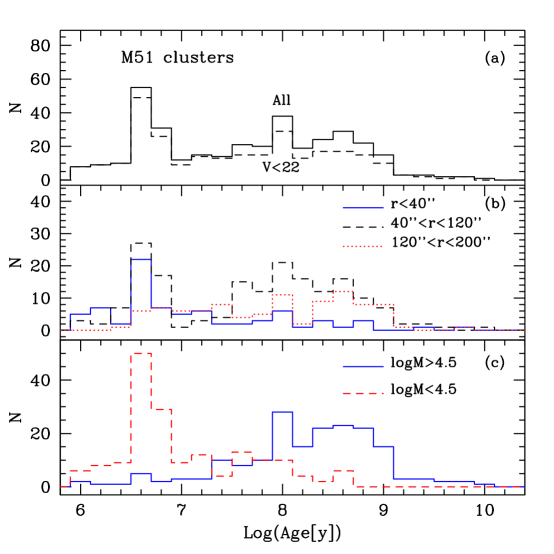
The age distribution for our NGC 5194 cluster sample is presented in Figure 9. The top panel in this figure shows several features. While NGC 5194 has been continuously forming star clusters, there are at least two apparent peaks above the background at and a broad peak between 8.0 and 9.0 in log yrs. These peaks are seen both in the entire cluster sample and in the sample of bright clusters with mag where cluster detection is reasonably complete. In the bottom panel of Figure 9 we show the age distribution for clusters with masses estimated above . This sample is expected to be reasonably complete out to 1 Gyr, and again shows a broad peak in the number of clusters formed in M51 between log(age[yr]) 8.0 and 9.0. The number of clusters observed in the young peak is significantly reduced in the bottom panel, since these are primarily of lower mass; however recall that we are likely missing a factor of 4–6 young clusters due to our selection criteria.
In order to quantify the enhancement in the cluster formation rate in Figure 9 (which is also clearly seen in Figure 5), we first synthesized a population of star clusters assuming a constant cluster formation model (a description of these models are presented in Whitmore 2004; Whitmore & Chandar 2005), assigned a random extinction, between 0.0 and 0.4, and assumed a photometric uncertainty to each cluster which depends on the luminosity of the cluster in a given bandpass. The characteristic uncertainties were determined empirically from the actual M51 cluster observations. We added a random correction to the magnitude of each cluster in each filter, and then ran this synthesized cluster population through our age-dating code, to account for systematic biases in the age-fitting. These models show a linear decline in the cluster distribution with age, with no apparent bumps. However, since there can be additional sources of uncertainty when comparing observations with models, as a sanity check we also compared the M51 cluster age distribution to that found for clusters detected in a single WFPC2 pointing of M101 (these will be presented in Chandar et al., in preparation), which has UBVI filter observations. M101 is a relatively isolated galaxy with no known companion, and hence we might naively expect it to have a more quiescent cluster formation history then M51. In the top panel of Figure 10 we compare the results of the cluster populations in these two galaxies. A histogram of the number of clusters as a function of age is shown for M51 (middle panel) and M101 (bottom panel). Note that we have used broader age bins here than those used in Figure 9 (in order to be more robust against small number statistics), which washes out the apparent bimodality between (with apparent peaks at log (age) 8.0 and 8.6). In both the constant cluster formation model (not shown) and the M101 cluster population, the number of clusters observed between decreases linearly, regardless of the bin width that is used. For M51 however, we clearly see an excess in the number of clusters with ages between log(age[yr]) 8 and 9. The fact that we see this contrast between derived properties for the observed cluster populations in M101 and M51, using the same age-dating technique, gives us additional confidence that the observed broad peak in the cluster population in M51 is real, and not due to any artifact or bias in age-dating.
By performing a linear fit to the data on either side of the enhancement (the age bins for the fit were chosen from the synthesized cluster population) and comparing the predictions of this linear fit with the actual data, we estimate that there are more clusters than one would expect in the case of constant cluster formation by a factor of 2.2–2.5. In our M101 dataset, an identical test reveals no evidence for enhanced cluster formation.
We note that some fraction of the clusters in our sample which have only BVI filter measurements likely have age estimates which put them in the age range 100–500 Myr, whereas they are actually younger objects, as we demonstrated in and Figure 6. Such objects can potentially affect our conclusions concerning a peak in the formation of clusters several hundred Myr ago. However, age dating statistics for Field 1 show that the contamination in the intermediate age peak by younger objects is only at the 25–30% level. Further, UBVI filters were used for age derivations in Field 1, and the 100–500 Myr peak in age is clearly seen for this, our best dataset (see §4.3). Assuming a similar contamination fraction overall (in Fields 2, 3, 4), we find that this will not alter our conclusion concerning peaks in the cluster age distribution.
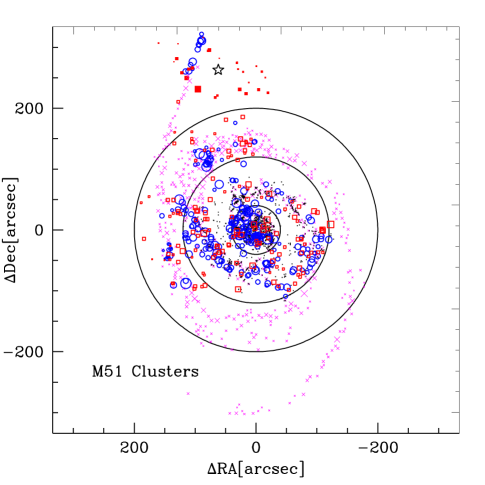
Figure 11 displays the spatial distribution of the young clusters () and intermediate-age clusters (. Field 5 only has and band imaging, and in this field we consider young clusters to have colors . In this Figure we also plotted, for comparison, the H II regions given by Rand (1992) and Scoville et al. (2001). Rand (1992) presented a list of H II regions in the entirety of M51 based on ground-based observations, while Scoville et al. (2001) presented a list of H II regions in the central region of M51 based on HST WFPC2/NICMOS observations. In the central region (at arcsec) and spiral arms, even given the incompleteness of our sample, young clusters dominate the sample. Most young clusters outside the central region are located along the spiral arms, co-spatial with H II regions. Note that the blue (young) clusters in Field 5 are located right on the extension of the H II region spiral arm extending from NGC 5194 passing through east of NGC 5195. The absence of ionized gas in this area (see also the maps in Thilker, Braun, & Walterbos, 2000; Thilker et al., 2002) suggests that these clusters are older than typical H II regions (i.e., older than 5–10 Myr).
On the other hand, intermediate-age clusters are found both on and off the spiral arms of NGC 5194. A small number of these clusters are located in the central region, and they also follow the spiral arms, but more loosely than the young objects. In the central region where a large number of clusters appear to have formed recently, either few intermediate-age clusters formed, or the majority of them were rapidly disrupted. Meanwhile, in the inner-arm region (at arcsec), intermediate age clusters (100–500 Myr) are clearly seen, in addition to very young clusters. As found by Bastian et al. (2005), there appear to be a significantly larger number (by a factor 2) of intermediate age clusters on the west side of NGC 5194 relative to the east side.
4.3. Cluster Formation Associated with the Interaction of NGC 5194/95?
The availability of cluster ages allows us to investigate the history of cluster formation in M51, and compare with dynamical age estimates of the interaction between NGC 5194 and NGC 5195. There have been numerous studies of the dynamical modelling of M51 since Toomre & Toomre (1972)’s seminal paper explaining galactic bridges and tails in four interacting galaxies. To date there are two classes of dynamical models which explain the morphological structure and dynamics of the M51 system: nearly parabolic single-passage models (e.g., Toomre & Toomre, 1972) and bound multiple-passage models (Salo & Laurikainen, 2000a, b; Durrell et al., 2003).
In the single-passage models first introduced by Toomre & Toomre (1972), the companion galaxy NGC 5195 crossed the NGC 5194 disk in the south at a distance of 25–30 kpc about 300–500 Myr ago (Hernquist, 1990; Salo & Laurikainen, 2000a; Durrell et al., 2003). The model uses an adopted mass ratio of NGC 5195/NGC 5194 of 1/2 to 1/3, consisent with observations (Schweizer, 1977; Smith et al., 1990). In this model NGC 5195 is currently located 50 kpc behind the M51 disk, and is moving away from NGC 5194 rapidly ( km s-1). The main spiral structures in M51 were formed during the crossing process.
In the multiple-passage model introduced by Salo & Laurikainen (2000a), the first crossing of the companion is similar to that of the single-passage model, except the direction of crossing is opposite to that of the single-passage model (i.e., the companion crosses the NGC 5194 disk coming toward the observer). The companion then crossed the NGC 5194 disk a second time in the north at a distance of 20–25 kpc about 50–100 Myr ago. In this model, NGC 5195 is currently located less than 20 kpc behind NGC 5194.
The multiple-passage models successfully explain several observational features of M51, including the detailed HI kinematics (Rots et al., 1990; Salo & Laurikainen, 2000a). However, Durrell et al. (2003) found, from a spectroscopic study of the kinematics of the planetary nebula system, that the kinematics of the north-western tidal tails in M51 can be better explained by the single-passage models, while the receding component in the north-western tidal tails is consistent with the results of the multiple-passage model given by Salo & Laurikainen (2000a) (see their Figure 5). Therefore it is not yet clear which of these two models is a better representation of the M51 system.
The age distribution of clusters in NGC 5194 (Figure 9) clearly shows evidence for a broad peak in the number of clusters formed at intermediate ages (between 8.0 and 9.0 log yrs), consistent with the predictions of both single- and multiple- passage models. However, as noted in the previous section, rather than a single broad peak in this age range, there may be two peaks, as observed near ages of 8.0 and 8.6 log(age[yr]). In order to assess the robustness of the possible peaks near 100 Myr and 500 Myr, we performed two experiments. First, we tested the cluster age distribution between log(age[yr]) 7.6 and 9.2 for bimodality using the KMM algorithm (McLachlan & Basford 1988; Ashman et al. 1994). As input, we used the ages for clusters more massive than log mass of 4.5 (as shown in the bottom panel of Figure 9). The p-value returned by KMM for a given distribution measures the statistical significance of the improvement in the fit when going from a single gaussian to two gaussians. The software finds that two peaks are preferred at the % confidence level, with peak values of 8.0 (100 Myr) and 8.7 (500 Myr) log(age[yr]). In a second test, we ran Monte Carlo simulations to assess how frequently a peak of the strength observed in the 8.0 log(age[yr]) bin (shown in Figure 9) results from random statistics. We find that the peak is real at the 80% confidence level. In general, while these results are suggestive of two peaks in the age distribution, one around 100 Myr and the other around 500 Myr, the results are more sensitive to the accuracy of the age dating and potential artifacts similar to the 10–30 Myr artifact discussed in §3.1. Given that a number of fields used in this study only have BVI observations which leads to age estimates with relatively large uncertainties, we conclude that higher quality data is required to definitively establish whether there is a single or double peak in the cluster age distribution between 100–500 Myr. In general however, the broad peak in the number of clusters formed several hundred Myr ago is consistent with a scenario where the interaction between the two galaxies directly caused an increase in the cluster formation rate.
4.4. Properties of Clusters in NGC 5195
Figure 12 shows the color-magnitude diagram (CMD) of all the clusters we detected in NGC 5195, an SB0 galaxy. In this diagram, the size of the symbols represents the relative sizes of the clusters. The red clusters with are fainter than mag ( mag), while the blue clusters with are bright, with up to mag ( mag). The distribution of the red clusters in Field 5 is entirely different from that of the blue clusters in the same field, as seen in Figure 11. The red clusters are scattered over the face of NGC 5195, while the blue clusters are located mostly along the arm of NGC 5194 touching NGC 5195. This difference indicates that these red clusters are part of a different population than the blue clusters. Although with only it is not possible to establish definitively whether the red clusters in NGC 5195 are young and highly extincted, or whether they are red because they are ancient, we suggest that based on the different distributions of red and blue clusters, these are ancient star clusters. Similarly, studies of nearby lenticulars have established that these galaxies contain almost exclusively ancient ( Gyr) star clusters (e.g., NGC 1023; Larsen & Brodie 2000).
In Figure 12, the sizes of the points reflect their measured sizes. It is seen in Figure 12 that the red clusters with are systematically larger than the blue clusters. About 70% (12 out of 17) red clusters have values larger than 7 pc, while most of the blue, presumably young, clusters are smaller than 7 pc. A study of the lenticular (SB0) galaxy NGC 1023 revealed a new family of star clusters, so-called “faint fuzzies” (Larsen & Brodie 2000). To date, four early-type galaxies (three S0s and one E) were searched for faint fuzzy clusters, and only found in one additional target (NGC 3384), which is also a barred S0 galaxy (Burkert et al., 2005). The main characteristics of these clusters are that they are larger than normal old globular clusters, with between 7–15 pc; they tend to be faint with most having mag; and they are red, or metal-rich, with [Fe/H] dex. The dashed box in Figure 12 marks the region of color and luminosity space occupied by faint fuzzy star clusters. We conclude that NGC 5195 is the third known SB0 galaxy, after NGC 1023 and NGC 3384, where ancient fuzzy star clusters have formed and survived.
Although there are relatively few fuzzy clusters detected in NGC 5195 (deeper observations would presumably reveal a larger population), we can compare their general properties with those found in NGC 1023. Our sample contains 12 red clusters with pc, brighter than . Counting the circles in Figure 8 of Larsen & Brodie (2000), we estimate that there are a roughly comparable number of clusters in NGC 1023 to the same absolute magnitude. The total cluster magnitudes are dependent on the technique used for aperture corrections. We have used a similar technique for making aperture corrections, so the measured luminosities for clusters in NGC 1023 should be directly comparable to those presented here for NGC 5195. NGC 1023 has a total V band luminosity which is roughly 1 magnitude brighter than NGC 5195, implying that NGC 1023 is more massive than NGC 5195. This assumes that both galaxies are dominated by stellar populations with similar ages; however the presence of strong Balmer lines in NGC 5195 indicates recent star formation, which would decrease the mass to light ratio and lead to an even larger mass difference between the two galaxies. Therefore, scaled for luminosity, the total number of clusters with pc and brighter than appears to be larger in NGC 5195. Given the small number of detected red clusters, we were unable to establish whether the compact ( pc) and extended ( pc) have different spatial distributions, as found in NGC 1023 (Larsen & Brodie, 2000). However, deeper observations with HST/ACS may establish whether the faint fuzzy star clusters in NGC 5195 are also distributed in a ring.
5. Summary and Conclusions
We present a study of star clusters in a nearby pair of interacting galaxies NGC 5194/95 (M51) based on HST WFPC2 multi-band archive images. We selected a clean cluster sample by only including clusters with robust morphological information. This resulted in the detection of 392 resolved, relatively isolated clusters in five HST fields. However due to this isolation criterion, we estimate that we are missing the majority (by factors of 4–6) of young clusters ( Myr). Therefore, in this work we focused on the M51 cluster population older than 10 Myr.
An age distribution shows a broad enhancement in the number of clusters with ages between 100 Myr and 500 Myr. We quantify this over-density, and estimate that our sample contains a factor of 2.2–2.5 more clusters than expected if the cluster formation rate had been constant over the past 1 Gyr. This range of ages is consistent with the crossing time of the companion galaxy, NGC 5195, through the NGC 5194 disk. We see tentative evidence for the presence of narrower peaks at 100 Myr and 500 Myr in the age distribution. Although these are consistent with the predictions of multiple-passage dynamical models of this two-galaxy system, the result is very preliminary and should be verified. We estimated the sizes for the clusters in our M51 sample, and find a correlation between cluster mass and size at the level, and a correlation between cluster age and size at the level. Finally, we report for the first time the discovery of faint, extended red star clusters in NGC 5195, which makes this the third known SB0 galaxy to have formed “faint fuzzies.”
References
- Ashman et al. (1994) Ashman, K. M., Bird, C. M., & Zepf, S. E. 1994, AJ, 108, 2348
- Bastian et al. (2005) Bastian, N., Gieles, M., Lamers, H. J. G. L. M., Scheepmaker, R. A., & de Grijs, R. 2005, A & A, 431, 905
- Bertin & Arnouts (1996) Bertin, E., & Arnouts, S. 1996, A&AS, 117, 393
- Bik et al. (2003) Bik, A., Lamers, H. J. G. L. M., Bastian, N., Panagia, N., & Romaniello, M. 2003, A&A, 397, 473
- Bruzual & Charlot (2003) Bruzual, G., & Charlot, S. 2003, MNRAS, 344, 1000
- Burkhead (1978) Burkhead, M. S. 1978, ApJ, 38, 147
- Burkert et al. (2005) Burkert, A., Brodie, J. P., & Larsen, S. S.2005, ApJ, in press (astro-ph/0504064)
- Chandar, Whitmore, & Lee (2004) Chandar, R., Whitmore, B., & Lee, M. G. 2004, ApJ, 611, 220
- Diaz et al. (1991) Diáz, A. I., Terlevich, E., Vilchez, J. M., Pagel, B. E. J., & Edmunds, M. G. 1991, MNRAS, 253, 245
- Dolphin (2000) Dolphin, A. 2000, PASP, 112, 1397
- Dolphin & Kennicutt (2002) Dolphin, A. E., & Kennicutt, Jr., R. C. 2002, AJ, 123, 207
- Durrell et al. (2003) Durrell, P. R., Mihos, J. C., Feldmeier, J. J., Jacoby, G. H., & Ciardullo, R. 2002, ApJ, 582, 170
- Fall (2004) Fall, S. M. 2004, in Formation and Evolution of Massive Young Star Clusters, ed. H. J. G. L. M. Lamers, A. Nota, & L. J. Smith (San Francisco: ASP), p. 399
- Fall, Chandar, & Whitmore (2005) Fall, S. M., Chandar, R., & Whitmore, B. W. 2003, submitted to ApJ
- Feldmeier, Ciardullo, & Jacoby (1997) Feldmeier, J. J., Ciardullo, R., & Jacoby, G. H. 1997, ApJ, 479, 231
- Harris (1991) Harris, W. E. 1991, ARA&A, 29, 543
- Harris (1996) Harris, W. E. 1996, AJ, 112, 1487
- Hernquist (1990) Hernquist, L. 1990, in Dynamics and Interactions of Galaxies, ed. R. Wielen (Berlin:Springer), 108
- Hill et al. (1997) Hill, J. K. et al. 1997, ApJ, 477, 673
- Holtzman et al. (1995) Holtzman, J. et al. 1995, PASP, 107, 156
- Hunter et al. (2003) Hunter, D. A., Elmegreen, B. G., Dupy, T. J., & Mortonson, M. 2003, AJ, 126, 1836
- Kennicutt (1998) Kennicutt, R. C. 1998, in Galaxies: Interactions and Induced Star Formation, ed. D. Friedli, L. Martiner, & D. Pfenninger (Berlin:Springer), Saas-Fee Advanced Course 26, 1
- Lamers et al. (2002) Lamers, H. J. G. L. M., et al. 2002, ApJ, 566, 818
- Larsen (1999) Larsen, S. S. 1999, A&AS, 139, 393
- Larsen (2000) Larsen, S. S. 2000, MNRAS, 319, 893
- Larsen (2002) Larsen, S. S. 2002, AJ, 124, 1393
- Larsen (2004) Larsen, S. S. 2004, in Planets to Cosmology: Esential Science in Hubble’s Final Years, Proceedings of the Space Telescope Science Institute Symposium, eds. M. Livio & S. Casertano (Cambridge, UK: Cambridge University Press), in press (astro-ph/0408201)
- Larsen & Brodie (2000) Larsen, S. S., & Brodie, J. P. 2000, AJ, 120, 2938
- Larsen & Richtler (2000) Larsen, S. S., & Richtler, T. 2000, A&A, 354, 836
- McLachlan & Basford (1988) McLachlan, G. J., & Basford, K. E. 1988, Mixture Models: Inference and Application to Clustering (New York: M. Dekker)
- Meurer et al. (1995) Meurer, G. R., Heckman, T. M., Leitherer, C., Kinney, A., Robert, C., & Garnett, D. R. 1995, AJ, 110, 2665
- Rand (1992) Rand, R. J. 1992, AJ, 103, 815
- Rots et al. (1990) Rots, A. H., Bosma, A., van der Hulst, J. M., Athanassoula, E., & Crane, P. C. 1990, AJ, 100, 387
- Salo & Laurikainen (2000a) Salo, H., & Laurikainen, E. 2000a, MNRAS, 319, 377
- Salo & Laurikainen (2000b) Salo, H., & Laurikainen, E. 2000b, MNRAS, 319, 393
- Salpeter (1955) Salpeter, E. E. 1955, ApJ, 121, 161
- Schlegel, Finkbeiner, & Davis (1998) Schlegel, D. J., Finkbeiner, D. P., & Davis, M. 1998, ApJ, 500, 525
- Schweizer (1977) Schweizer, F. 1977, ApJ, 211, 324
- Scoville et al. (2001) Scoville, N. Z., et al. 2001, AJ, 122, 3017
- Smith et al. (1990) Smith, J., Gehrz, R. D., Grasdalen, G. L., Hackwell, J. A., Dietz, R. D., & Friedman, S. D. 1990, ApJ, 362, 455
- Stetson (1994) Stetson, P. B. 1994, PASP, 106, 250
- Thilker, Braun, & Walterbos (2000) Thilker, D. A., Braun, R., & Walterbos, R. A. M. 2000, ApJ, 120, 3070
- Thilker et al. (2002) Thilker, D. A., Walterbos, R. A. M., Braun, R., & Hoopes, C. G. 2002, AJ, 124, 3118
- Toomre & Toomre (1972) Toomre, R. P. J., & Toomre, J. 1972, ApJ, 178, 623
- Tully (1974) Tully, R. B. 1974b, ApJS, 27, 437
- Whitmore (2003) Whitmore, B. C. 2003, in A Decade of Hubble Space Telescope Science, Proceedings of the Space Telescope Science Institute Symposium, eds. M. Livio, K. Noll, & M. Stiavelli (Cambridge, UK: Cambridge University Press), vol. 14, p. 153–178
- Whitmore (2004) Whitmore, B. C. 2004, in Formation and Evolution of Massive Young Star Clusters, eds. H. J. G. L. M. Lamers, A. Nota, & L. J. Smith (San Francisco: ASP), p. 419
- Whitmore (2005) Whitmore, B. C., & Chandar, R. 2005, in preparation
- Whitmore et al. (1999) Whitmore, B. C., Zhang, Q., Leitherer, C., Fall, S. M., Schweizer, F., & Miller, B. 1999, AJ, 118, 1551
| Field | PropID | RA | Dec | Filters and Exposure Times [s] | |||
|---|---|---|---|---|---|---|---|
| # | (J2000) | (J2000) | |||||
| 1 | 7375 | 13:29:48.6 | 47:11:30 | F336W, | F439W, 500,600 | F555W, | F814W, 300,700 |
| 2aaField 2 also has a single F675W (R band) exposure of 600 seconds. | 5777 | 13:29:56.5 | 47:11:32 | F336W, bbThe band observations for Field 2 were taken at a somewhat different orientation and pointing. The overlap region is approximately one Wide Field CCD (Chip 2). | F439W, | F555W, | F814W, |
| 3 | 9073 | 13:30:05.4 | 47:11:23 | F450W, | F555W, | F814W, | |
| 4 | 9073 | 13:29:58.7 | 47:14:01 | F450W, | F555W, | F814W, | |
| 5ccField 5 covers the barred spiral companion galaxy, NGC 5195. | 9042 | 13:29:59.0 | 47:16:06 | F606W, | F814W, | ||
Note. — Units of right ascension are hours, minutes, and seconds, and units of declination are degrees, arcminutes, and arcseconds.