GDDS HIGHLIGHTS: GALAXY EVOLUTION REVEALED
Abstract
The Gemini Deep Deep Survey, GDDS, produced several significant results relating to the evolution of galaxies. All of these results are consistent with the “downsizing” concept of galaxy formation and evolution, i.e., that the active periods of star formation moved progressively from very massive galaxies at high redshift to much lower mass galaxies at the present epoch. Spectra of massive red galaxies at z 1.7 demonstrates that they contain old stellar populations and hence must have formed their stars in the first Gyr of cosmic history; indicators of star formation activity show that the star formation rate in the most massive galaxies was much higher at than today, that the activity in intermediate mass galaxies peaked near , while, since the activity is primarily confined to lower mass galaxies. The GDDS also uncovered a relatively high percentage of post-starburst galaxies at , a result that is anticipated given all the activity seen at higher redshifts. Measurements of the strengths of metal lines of a subsample of the GDDS and CFRS galaxies at reveal that, at a given mass, they had lower metallicities than at present. The evolution in the mass-metallicity relation is consistent with a model in which star formation lasts longest in less massive galaxies, again an expected result in the downsizing scenario.
Dominion Astrophysical Observatory, HIA, NRC Canada, Victoria, BC, Canada
1 Introduction
The formation and evolution of galaxies has been one of the primary topics in cosmology ever since their diverse appearance was first observed. Naive interpretations of the Hubble sequence of galaxies and of the hierarchical nature of dark matter halos in CDM models naturally lead to scenarios in which smaller galaxies, predominantly spirals, form first and then merge to form the massive spheroidal systems. The variation of the star formation rate density as a function of redshift (Lilly et al. 1996, Madau et al.1996) shows that almost half of the stellar mass in galaxies was formed between so that it is obviously vital to study this epoch to understand galaxy evolution. The GDDS survey (Abraham et al. 2004), through preselection criteria applied to a deep infrared survey of galaxies, was specifically designed for this purpose.
The photometric and spectroscopic results that emerged from the GDDS galaxy sample reveal a very consistent picture; one in which star formation activity was initially concentrated in very massive galaxies at very high redshift resulting in old, “red and dead” galaxies at redshifts , and the activity has progressively moved to lower and lower mass systems. Here we summarize some of the highlights that lead to this conclusion.
2 Parameters of the GDDS Survey
The chief observational hurdle to overcome was: a) the extreme faintness of the passively evolving galaxy population; b) the relatively featureless spectra (since all strong features were redshifted out of the detector passband); c) the very bright night sky emission. Before techniques like Nod and Shuffle (see below) were implemented, it was extremely difficult to obtain sufficiently good spectra for redshift determination in the range and so this became known as the “redshift desert”. Given the observational challenges, transforming the redshift desert into the “redshift dessert” requires extremely long exposures.
The basic goals and parameters of the GDDS survey can be summarized as follows:
- Construct the largest mass-limited sample of galaxies in the range with no bias toward emission line systems. In fact, bias the sample toward early-type “red and dead” galaxies using VRIzJHK colours. The sample was drawn from the Las Campanas IR imaging survey (McCarthy et al. 1999; Chen et al. 2002) and the GDDS subsample covered 121 square arcminutes in 4 different sightlines.
- Go deep enough () to pick up M* galaxies out to z=1.8. This requires up to 30 hour integrations with GMOS, the Gemini Multi-Object Spectrograph (Hook et al. 2003; Crampton & Murowinski 2004) and implementation of a “Nod & Shuffle” mode (Cuillandre 1994, Glazebrook & Bland-Hawthorn 2001, and the appendix to Abraham et al. 2004) to enable sky subtraction to 0.1% accuracy. The resulting relatively high signal-to-noise spectra that were free of artifacts resulting from poor subtraction of the strong night sky emission lines enabled redshift determination for a high perecentage of the original galaxy sample, even from spectra of galaxies containing primarily old stars with no, or weak, emission features. Spectroscopic redshifts were derived for 221 galaxies, 163 of which are in the redshift interval .
- Construct the mass function of galaxies and connect this to the star-formation history of the Universe (ideally, using only self-consistent data internal to the survey). Connect mass-assembly to the Hubble sequence.
The GDDS catalogue and the spectra are described in detail in Abraham et al. (2004) and are all publicly available at http://www.ociw.edu/lcirs/gdds.html. Abraham et al. also describe the sampling strategy and how a weighting scheme was devised to deal with the complications arising from the preselection criteria.
3 Masses and Spectra of Galaxies in the Redshift Desert
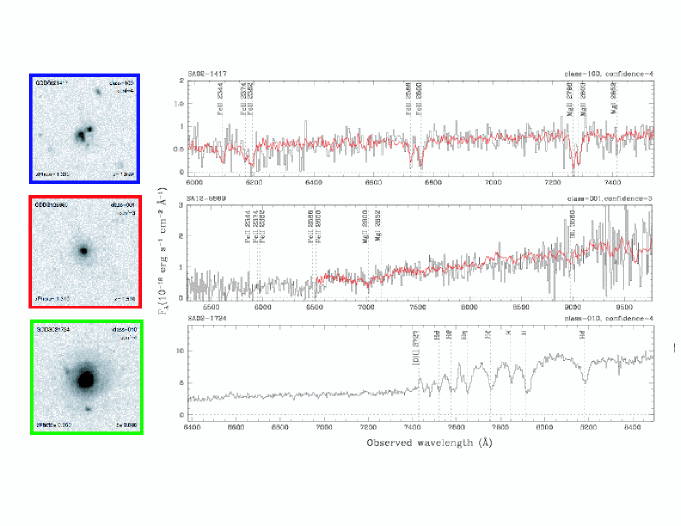
As outlined in Glazebrook et al. (2004), masses for galaxies in the GDDS sample were derived from their spectral energy distributions which in turn were determined from colours. As figures 1 and 3 of Glazebrook et al. show, high mass galaxies were abundant up to redshifts , and the decline in mass density falls much more slowly with redshift than predicted by standard semi-analytic models (e.g., Cole et al. 2000). Almost half of the mass density at is contained within galaxies with and the spectra show that these are galaxies containing populations of old stars rather than being reddened by interstellar absorption. Furthermore, HST ACS imaging of a representative subsample of these galaxies shows that more than 90% have early-type morphology (Abraham et al. 2005). A representative spectrum and direct image of one of these galaxies is shown in the middle panel of Figure 1. The most massive galaxies are generally spectroscopically and morphologically early type systems. However, there are also lots of massive star-forming galaxies at that presumably become all the post-starburst galaxies that are observed at (see below).
3.1 Formation redshifts and ages of galaxies with very evolved stellar populations
A preliminary analysis by McCarthy et al. (2004) of the spectra of galaxies at redshifts from 1.3 to 2.2 whose integrated light is dominated by evolved stars shows that they must have formed at very high redshifts. Conservative best-fit and minimum ages were derived from both the spectra and the broad band colors. Minimum formation redshifts are inferred for several of the galaxies and best-fit formation redshifts for 20% of the objects. These early-forming galaxies are major contributors to the stellar mass density at and are likely progenitors of a significant fraction of present day massive elliptical galaxies. McCarthy et al. argue that the mostly likely progenitors of these systems are higher redshift analogs of the massive starburst galaxies seen in the sub-mm with SCUBA and similar instruments, and cannot be descendants of the Lyman break galaxies.
Another interesting point is that the spectra are best fit by models with solar or even higher metallicity indicating that very significant metal enrichment occurred very early. The interstellar medium of star-forming galaxies in this same redshift range is also apparently chemically evolved. A composite spectrum derived from a subsample of 13 GDDS galaxies at by Savaglio et al. (2004) shows surprisingly strong interstellar lines, much stronger than observed in local starbursts (Tremonti, 2003). An example of the spectra of one of these active starburst galaxies at is shown in the top panel of Figure 1. Thus, both the interstellar medium and the stars in these relatively high redshift galaxies have already been enriched to approximately solar values. Rapid enrichment in these massive galaxies must occur very early in the history of the Universe.
3.2 Post-Starburst Activity at
Prominent among the GDDS spectra are several dramatic examples of post-starburst galaxies, i.e., spectra with very strong Balmer absorption lines but weak or absent emission features (see the bottom panel of Figure 1). By comparing the GDDS data with that from the Sloan Digital Sky Survey, Le Borgne et al. (2005) were able to quantify the dramatic decline in the abundance of post-starburst galaxies from to the present. Spectral synthesis models of the GDDS post-starburst galaxies show that they must be the products of massive bursts of star formation Gyr prior to the epoch of observation. The models show that these must have been rapid mass-building events rather than a continual series of small events. The bright star-forming galaxies in the GDDS sample at are probably examples of this activity. The most likely local counterparts of these post-starburst galaxies at are massive ellipticals in the field or in small groups.
3.3 Star Formation Rates at
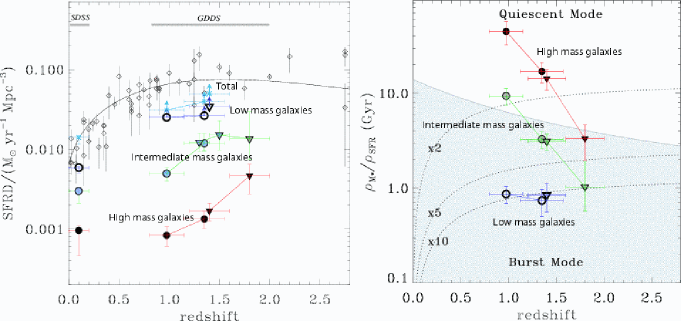
Another ubiquitous feature of the GDDS spectra is the presence of relatively strong emission lines, much stronger than in lower redshift samples, e.g., CFRS. [OII] emission lines, indicative of star formation activity, are, of course, strong in the galaxies with late-type morphologies but in the GDDS sample they are also frequently visible even in spectra that appear to arise mostly from evolved populations. In addition, higher ionization emission lines (e.g., [Ne III], [Ne V]) are evident in several of the most active galaxies (for details, see Abraham et al. 2004). Juneau et al. (2005) measured the strengths of the [OII] emission lines in all the GDDS spectra of galaxies with and used these, along with measurements of the rest-frame UV continuum (derived from photometry) for galaxies with to derive star formation rates for the GDDS sample. As expected, given the appearance of the spectra, the rates are much higher on average than at . The availability of the mass estimates for the GDDS galaxies allowed Juneau et al. to add another dimension, however. Figure 2, adapted from Juneau et al., demonstrates that the star formation rate history is a strong function of the stellar mass in a galaxy. For the most massive galaxies, the star formation rate was six times higher at than at and it declined rapidly between . The star formation activity in the lower mass galaxies peaked at lower redshifts so that for systems with the star formation activity peaks closer to and then declines rapidly to . Through a comparison of the star formation rate density to the stellar mass density Juneau et al. were able to demonstrate that star formation in the most massive galaxies transitioned from a very active burst mode to a quiescent mode near , whereas this transition occured later, at lower redshifts, for less massive galaxies. Thus, measurements of the star formation rate point to the same picture as was derived from analysis of the ages of the populations from their spectra: the most massive galaxies formed early. In fact, the most massive galaxies formed their stars in the first 3 Gyr of cosmic history.
All of the key results from the GDDS spectra and colours that are described in this section strongly support the “downsizing” concept for galaxy evolution: rapid star formation occurred very early at high redshift in the most massive systems and then subsided in these while the activity proceeded to lower and lower mass systems with decreasing redshift.
4 Redshift Evolution of the Galaxy Mass-Metallicity Relationship
Savaglio et al. (2005) were able to measure metallicities for 56 galaxies with for which masses could also be estimated from the GDDS and CFRS surveys. Careful attention was paid to minimizing systematic and possible aperture effects as well as the effects of extinction. A nice mass-metallicity relationship emerged for these galaxies at a mean redshift , a relationship that is considerably tighter than the luminosity-metallicity relationship. Furthermore, the relation is displaced from that derived from the SDSS galaxies at (Tremonti et al. 2004) in the expected direction: present-day galaxies of a given mass have a higher metallicity. Evidence from galaxies compiled by Shapley et al. (2004) indicates that this trend continues to higher redshifts. Savaglio et al. show that all these observations can be fitted by a simple redshift-dependent mass-metallicity relationship. Both masses and metallicities evolve more slowly in lower mass galaxies compared to their higher mass counterparts. The variation can be explained by a simple closed-box model in which the e-folding time for star formation is longer for less massive galaxies. Thus the picture that emerges from considerations of the mass-metallicity relation also supports the “downsizing” scenario. An aside is that the mass-metallicity relationship predicts that low metallicity galaxies such as the DLA systems all have masses . Hammer (elsewhere in these proceedings, and see Liang et al. 2005) also reported detecting redshift evolution in the mass-metallicity relationship of galaxies at similar redshifts to those discussed by Savaglio et al.
5 Summary
The GDDS survey targeted galaxies, emphasizing those “red and dead” systems containing old, evolved, stellar populations. As expected, the results demonstrate that UV-selected surveys are not complete and miss important segments of the galaxy population. The GDDS spectra have sufficient signal-to-noise for these optically extremely faint galaxies that it is possible to distinguish the evolved populations from galaxies that are red because they are dusty. In addition, imaging confirms that almost all the spectroscopically “red and dead” systems have morphologies characteristic of early-type galaxies.
The abundance of massive galaxies declines at but the decline is slower than that predicted by most models and there is still a significant population of very high mass galaxies at . The GDDS observations indicate that half the stellar mass in these galaxies was formed in very active bursts of star formation at . High redshift sub-mm “SCUBA” sources (Chapman et al. 2005) are the most plausible counterparts of these active systems. At much lower redshifts, , there is a significant population of post-starburst galaxies that appear to be the descendants of the active star-forming galaxies at . Measures of star formation activity in GDDS galaxies at various redshifts as a function of the stellar mass complement these other results, demonstrating that the peak of the star formation activity began in the highest mass galaxies at high redshifts and then progressively moved to lower mass galaxies at lower redshifts. This scenario, called “downsizing” by Cowie et al. (1994), is thus supported by several results emerging from the GDDS survey. The redshift-evolution of a mass-metallicity relation that was detected in the GDDS and CFRS galaxies is also consistent with downsizing in that star formation appears to proceed more slowly, for a longer period of time, in less massive galaxies. Interestingly, a naive closed-box model in which the e-folding time for star formation is longer in less massive galaxies fits the observations quite well (Savaglio et al. 2005).
In summary, observations of galaxies in the redshift desert give strong support for the downsizing scenario of galaxy evolution. Physical processes must make the formation of stars much more efficient in high mass systems at earlier times than suggested by most theoretical models, and then turn it off quickly.
References
- [1] Abraham et al. 2005, in preparation, GDDS paper VIII
- [2] Abraham, R.G., Glazebrook, K., McCarthy, P.J., Crampton, D., Murowinski, R. et al., 2004, AJ, 127, 2455. GDDS paper I
- [3] Chapman, S.C., Blain, A.W., Smail, I. & Ivison, R.J. 2005, Ap. J., 622, 772.
- [4] Chen, H.-W., McCarthy, P.J., Marzke, R.O., Wilson, R.G., Carlberg, R.G. et al. 2002, ApJ, 570, 54.
- [5] Cole, S., Lacey, C.G., Baugh, C.M. & Frenk, C.S. 2000, MNRAS, 319, 168.
- [6] Cowie, L.L., Gardner, J.P., Hu, E.M., Songaila, A., Hodapp, K.W., Wainscoat, R.J. 1994, Ap. J., 434, 114.
- [7] Crampton, D. & Murowinski, R. 2004, SPIE, 5492, 181.
- [8] Cuillandre, J.C., et al. 1994, A&A, 281, 603.
- [9] Glazebrook, K., Abraham, R.G., McCarthy, P.J. et al., 2004, Nature, 430, 181. GDDS paper III.
- [10] Glazebrook, K.& Bland–Hawthorn, J.2001, PASP, 113, 97.
- [11] Hook, I.M., Jørgensen, I., Allington-Smith, J.R., Davies, R.L., Metcalfe, N., Murowinski, R.G. & Crampton, D. 2004, PASP, 116, 425
- [12] Juneau, S. et al. 2005, Ap. J., 619, 135. GDDS paper V.
- [13] Le Borgne, D.et al. 2005, Ap. J., in press. GDDS paper VI.
- [14] Liang, Y.C., Hammer, F. et al. 2005, astro-ph/0501529.
- [15] Lilly, S.J., Le Fevre, O., Hammer, F. & Crampton, D. 1996, ApJ, 460, L1.
- [16] Madau, P., Fergusson, H.C., Dickinson, M.E., Giavalisco, M., Steidel, C.C. & Fruchter, A., 1996, MNRAS, 283, 1388.
- [17] McCarthy, P.J. et al. 2004, Ap. J., 614, L9. GDDS paper IV
- [18] McCarthy, P. J., Marzke, R.O., Chen, H.-W., Persson, E., Oemler, A. et al. 1999, Bull. AAS, 195, 5701.
- [19] Savaglio, S., Glazebrook, K., Abraham, R.G., Crampton, D., Chen, H.-W., McCarthy, P.J.P., et al. 2004, ApJ, 602, 51.GDDS paper II
- [20] Savaglio, S. et al. 2005, Ap. J., in press, GDDS paper VII, astro-ph/0508407
- [21] Shapley, A.E., Erb, D.K., Pettini, M., Steidel, C.C. & Adelberger, K.L. 2004, Ap. J., 612, 108.
- [22] Tremonti, C.A. 2003, Ph D thesis
- [23] Tremonti, C.A. et al. 2004, Ap. J., 613, 898.