Abstract
We describe our project to examine the evolution of distant disk galaxies, and present the results of our work based on the Tully-Fisher relation. Comparing matched cluster and field samples we find evidence that the cluster galaxies are on average mag brighter than those in the field. Considering the field sample alone we find a brightening with redshift amounting to mag by , which is likely to be an upper limit, considering the selection effects. We also give brief details of the ESO Distant Clusters Survey (EDisCS) and describe our plans for expanding our studies using data from this survey.
[Evolution of disk galaxies] The evolution of disk galaxies in clusters and the field
1 Our project
The broad aim of this project is to investigate disk galaxy evolution, as a function of both redshift and environment, using rotation velocity as a baseline for the comparison of various galaxy properties. To achieve this we have obtained VLT/FORS2 multi-slit spectroscopy for a large number of bright emission-line galaxies in the fields of six clusters with redshifts . Rotation velocities were measured by fitting the [OII] emission line using a synthetic rotation curve method called ELFIT2PY, which is based on the algorithms of ELFIT2D by Simard & Pritchet (1999). The results of these fits have been thoroughly examined to determine their quality, and to reject measurements which are deemed unreliable. Photometry and structural parameters are measured on imaging from a range of sources, primarily FORS2 and HST. Full details of the sample selection and data analysis are given in Bamford et al. (2005a) and Milvang-Jensen et al. (2003). Our final sample consists of 111 emission-line galaxies with secure rotation velocity measurements, and covers the redshift range .
2 Cluster study
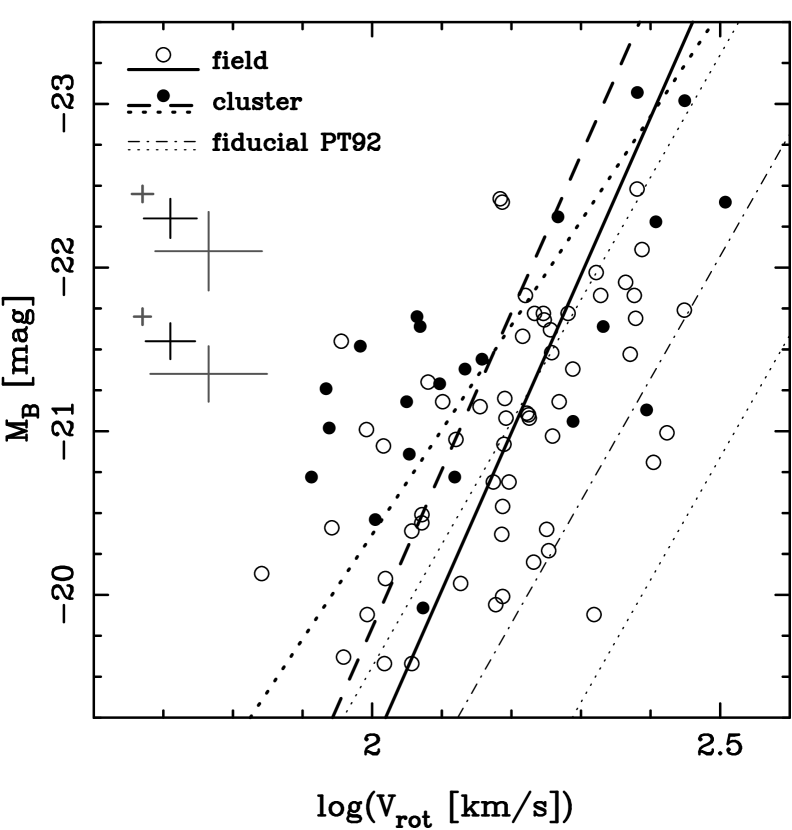
There is now much evidence indicating a transformation of star-forming spirals into passive S0 galaxies in cluster environments. However, the detailed form of this evolution and the mechanisms responsible are still far from certain. An interesting possibility is that the interaction causes an enhancement of the star-formation rate prior to its eventual truncation. To examine this question, we have compared the B-band Tully-Fisher (–) relation (TFR) for ‘matched’ samples of field and cluster spirals ([Bamford et al., 2005a]).
Fig. 1 shows our TFR for 58 field and 22 cluster galaxies covering similar ranges in redshift () and luminosity ( mag). The cluster galaxies show an offset from the field sample, such that they are mag brighter for a given rotation velocity. Fig. 2 presents this in terms of residuals from the local fiducial relation of Pierce & Tully (1992; hereafter PT92), versus redshift. The offset persists, at a significance level, even when evolution in the field sample is accounted for, as shown by Fig. 3.
This result implies a phase of enhanced luminosity (and hence star-formation) in the early stages of a spiral’s interaction with the cluster environment.


3 Field study
Studies examining the evolution of the global star formation rate (SFR) density of the universe find a substantial increase of a factor of from – (e.g., [Heavens et al., 2004]). Is this trend simply due to an evolution in the star-formation rates of individual giant spirals, or is some other process or population responsible? Does the evolution depend on galaxy mass?
To investigate this we have again used the TFR, to look for changes in the relation between (a proxy for SFR) and (a proxy for total mass), as described fully in Bamford et al. (2005b).
Our TFR for 89 field spirals with is shown in Fig. 4. The slope is not significantly different to that measured locally, i.e., no evidence for mass-dependent evolution. Examining the TFR residuals versus (Fig. 2), or fitting the TFR intercept in several redshift bins (Fig. 5), we find a -band brightening of mag, for a given , by . Due to selection effects this is an upper limit to the true evolution, but still implies slower SFR evolution than measured globally.
This suggests that the global SFR evolution of the universe is not driven by the SFR decline in giant spirals.


4 Future work with EDisCS
The ESO Distant Cluster Survey (EDisCS) is a study of galaxies in and around clusters at . These clusters were optically selected using the Las Campanas Distant Cluster Survey ([Gonzalez et al., 2001]), and thus have a wide range of properties.
For each cluster we have a wealth of imaging and spectroscopy data. Many projects are underway using these data, including studies of morphology, luminosity functions, colour-magnitude diagrams, cluster substructure, velocity distributions, lensing masses and stellar populations.
From the spectra we are now measuring reliable rotation velocities, in order to perform detailed investigations into the evolution of various galaxy properties with respect to this useful baseline. With more than 5 times as many galaxies, we will have the statistical power to vastly improve upon the studies shown above. The addition of HST morphologies, homogeneous colours, spectral indices and a variety of clusters with well characterised properties, will allow unprecedented studies of disk galaxy evolution with environment and redshift.
1
References
- [Bamford et al., 2005a] Bamford, S.P., et al., 2005a, MNRAS, 361, 109
- [Bamford et al., 2005b] Bamford, S.P., Aragón-Salamanca, A. & Milvang-Jensen, B., 2005b, submitted to MNRAS
- [Gonzalez et al., 2001] Gonzalez, A.H., et al., 2001, ApJS, 137, 117
- [Halliday et al., 2001] Halliday, C., et al., 2004, A&A, 427, 397
- [Heavens et al., 2004] Heavens, A., et al., 2004, Nature, 428, 625
- [Milvang-Jensen et al., 2003] Milvang-Jensen, B., et al., 2003, MNRAS, 339, L1
- [Pierce & Tully, 1992] Pierce, M.J. & Tully, R.B., 1992, ApJ, 387, 47
- [Simard & Pritchet, 1999] Simard, L. & Pritchet, C.J., 1999, PASP, 111, 453