A Modeling of the Super-Eddington Luminosity in Nova Outbursts: V1974 Cygni
Abstract
We have modeled nova light curves exceeding the Eddington luminosity. It has been suggested that a porous structure develops in nova envelopes during the super Eddington phase and the effective opacity is much reduced for such a porous atmosphere. Based on this reduced opacity model, we have calculated envelope structures and light curves of novae. The optically thick wind model is used to simulate nova winds. We find that the photospheric luminosity and the wind mass-loss rate increase inversely proportional to the reducing factor of opacities, but the wind velocity hardly changes. We also reproduce the optical light curve of V1974 Cygni (Nova Cygni 1992) in the super-Eddington phase, which lasts 13 days from the optical peak 1.7 mag above the Eddington luminosity.
1 Introduction
The super-Eddington luminosity is one of the long standing problems in nova theory. The peak luminosity of classical novae often exceeds the Eddington limit by a factor of several (Della Valle & Livio, 1995, and references therein). Super-Eddington phases last several days or more, longer than the dynamical time scale of white dwarf (WD) envelopes. Many theoretical works have attempted to reproduce this phenomena, but not succeeded yet (e.g., Prialnik et al, 1978; Sparks et al, 1978; Nariai et al., 1980; Starrfield et al., 1985; Prialnik et al, 1986; Kutter & Sparks, 1989; Prialnik & Kovetz, 1992; Kovetz, 1998).
The Eddington luminosity is understood as an upper limit of the luminosity of stars in hydrostatic equilibrium. Its classical definition is
| (1) |
where is the light speed, the gravitational constant, the mass of the WD, and is the opacity by electron scattering. If the diffusive luminosity exceeds this limit, the stellar envelope cannot be in hydrostatic balance and a part of the envelope is ejected.
During nova outbursts nuclear burning produces energy much faster than this limit. The envelope is accelerated deep inside the photosphere and a part of it is ejected as a wind. Once the wind occurs, the diffusive luminosity is consumed to drive the wind. As a result, the photospheric luminosity decreases below the Eddington limit defined by equation (1) (Kato, 1983, 1985).
Recently, Shaviv (2001b, 2002) presented a new idea of clumpy atmospheres to explain the super-Eddington luminosity of novae. The nova envelope becomes unstable against clumpiness shortly after the ignition when the luminosity exceeds a critical fraction of the Eddington limit (Shaviv, 2001a). Such a clumpy structure reduces effective opacity, and correspondingly, increases the effective Eddington luminosity. Therefore, the luminosity could be larger than the classical Eddington limit, even though it does still not exceed the effective Eddington luminosity.
Shaviv (2001b) suggested a model of nova envelope with the super-Eddington luminosity consisting of four parts: (1) convective region: a bottom region of the envelope in which the diffusive luminosity is sub-Eddington and additional energy is carried by convection, (2) a porous atmosphere: the effective Eddington luminosity is larger than the classical Eddington limit, (3) an optically thick wind region: the effective Eddington limit tends to the classical value, and (4) the photosphere and above.
Based on Shaviv’s picture, we have assumed reduced opacities to model the super-Eddington phase of V1974 Cyg (Nova Cygni 1992). V1974 Cyg is a well observed classical nova so that various multiwavelength observations are available such as optical (Iijima and Esenoglu, 2003), supersoft X-ray (Krautter, 2002), and radio (Eyres at al., 2005). Chochol et al. (1997) summarized observational estimates of optical maximum magnitude, ranging from to mag with an average magnitude of . These values indicate that the peak luminosity exceeded the Eddington limit by more than a magnitude and the duration of super-Eddington phase lasts several days or more.
In §2, we briefly describe our numerical method. Physical properties of the envelope with reduced effective opacities are shown in §3. Our light curve model of V1974 Cyg is given in §4. Discussion follows in §5.
2 Envelope model with reduced opacity
We have calculated structures of envelopes on mass-accreting WDs by solving the equations of motion, mass continuity, energy generation, and energy transfer by diffusion. The computational method and boundary conditions are the same as those in Kato & Hachisu (1994) except the opacity. We use an arbitrarily reduced opacity
| (2) |
where is OPAL opacity (Iglesias & Rogers, 1996) and is a opacity reduction factor that represents reduced ratio of opacity due to clumpiness of the envelope. The effective Eddington luminosity now becomes
| (3) |
When is greater than unity, the luminosity can be larger than the classical Eddington limit (1). Note that the Eddington luminosity (3) is a local variable because OPAL opacity is a function of local variables.
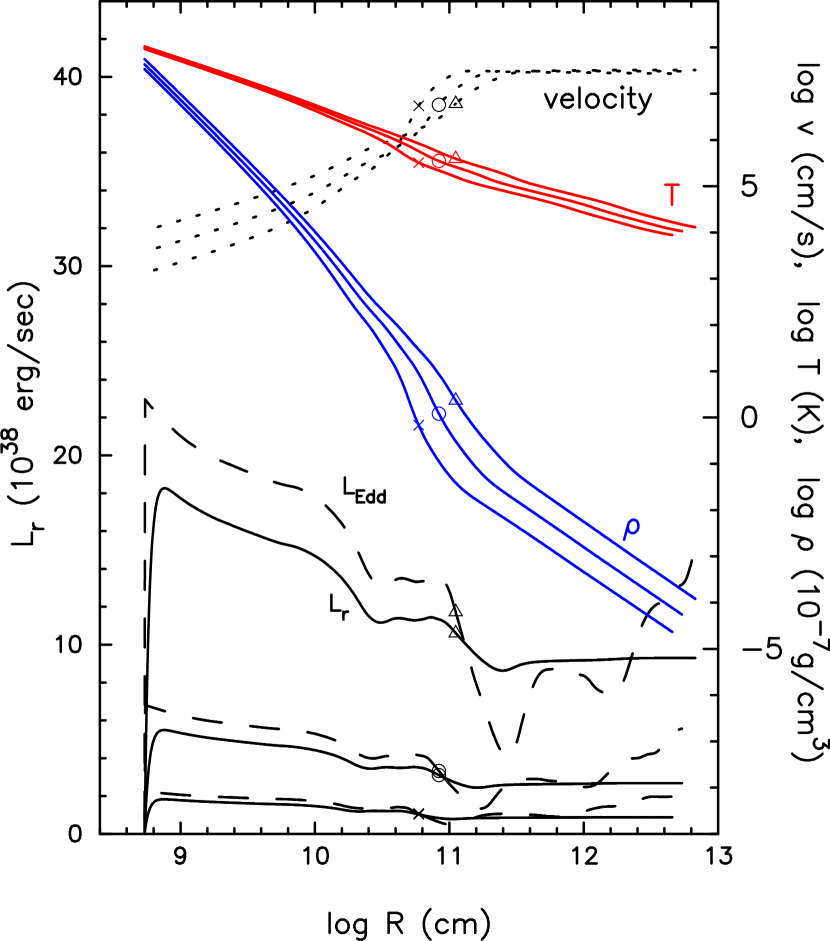
As a first step, we simply assume that the opacity reduction factor is spatially constant. Figure 1 shows numerical results for three envelopes of , 3, and 10 on a WD with the Chandrasekhar radius, i.e., . The chemical composition of the envelope is assumed to be uniform, i.e., , , =0.3, and , where includes carbon and oxygen by solar composition ratio for heavy elements.
In Figure 1, the effective Eddington luminosity (3) is plotted by dashed lines, which sharply decreases at 11.1 corresponding to the iron peak in OPAL opacity at . The wind is accelerated in this region and reaches a terminal velocity deep inside the photosphere. The diffusive luminosity () decreases outward because the energy flux is consumed to push matter up against the gravity. These features are qualitatively the same as those in the three nova envelopes with 3, and 10.
Figure 2 shows the photospheric velocity (), the wind mass loss rate (), and the photospheric luminosity () for three evolutionary sequences of and 10. The sequence is already reported in Kato & Hachisu (1994). In each evolutionary sequence, the envelope mass is large for smaller photospheric temperature (). The figure also shows that and increase almost proportionally to , whereas the wind velocity () hardly changes but even slightly decreases.
Theoretical light curves are calculated from these sequences. After the onset of a nova outburst, the envelope expands to a giant size and the luminosity reaches its peak. After that, the envelope mass gradually decreases owing mainly to the wind mass loss. During the nova decay phase, the bolometric luminosity is almost constant whereas the photospheric temperature increases with time. The main emitting wavelength region moves from optical to supersoft X-ray through ultra-violet (UV). Therefore, we obtain decreasing visual magnitudes (Kato & Hachisu, 1994).
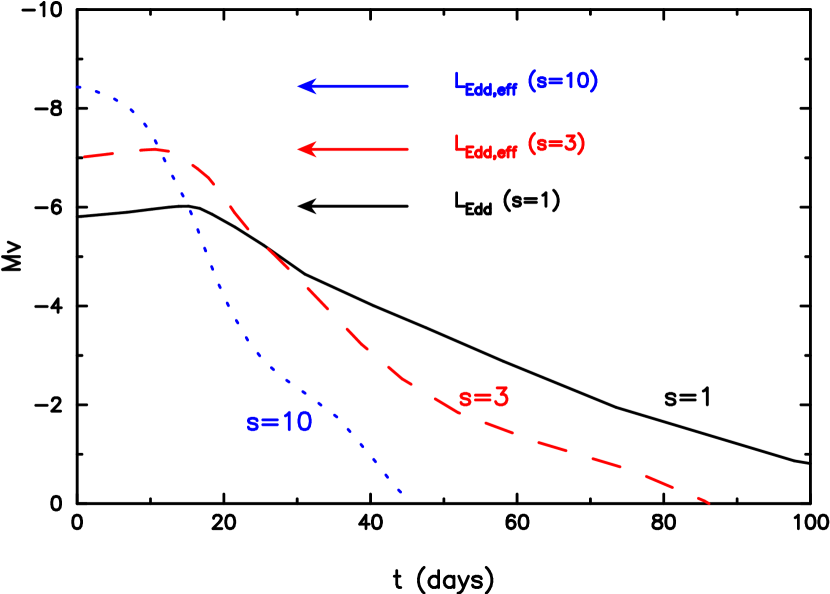
Figure 3 shows visual light curves for the opacity reduction factor , 3, and 10. The visual magnitude decays quickly for a larger because an envelope for a larger has a heavier wind mass loss. The peak luminosity of each light curve is shown by arrows. When the opacity reduction factor is larger than unity, the peak luminosity exceeds the classical Eddington limit, which is roughly corresponding to the Eddington luminosity for .
3 Light Curve of V1974 Cyg
Recently, Hachisu & Kato (2005) presented a light curve model of V1974 Cyg that reproduced well the observed X-ray, UV, and optical light curves except for a very early phase of the super-Eddington luminosity. Here, we focus on this early phase () and reproduce the super-Eddington luminosity based on the reduced opacity model.
We adopt various WD model parameters after their best fit model, i.e., the mass of , radius of , and chemical composition of =0.46, , , and by mass. These parameters are determined from the X-ray turn-off time, epoch at the peak of UV 1455 Å flux, and epoch at the wind termination. All of these epochs are in the post super-Eddington phase.
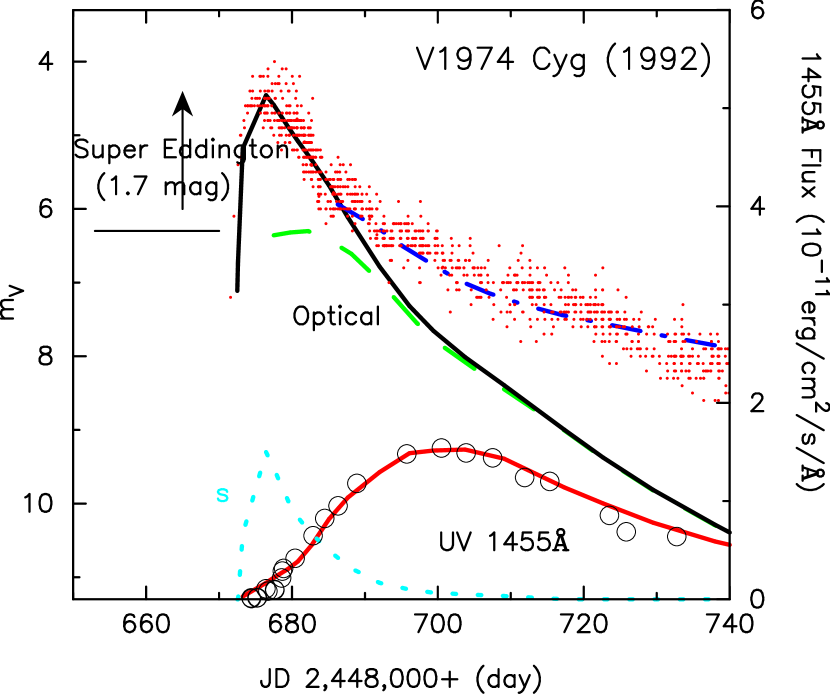
Our simple model with a constant such as in Figure 3 does not reproduce the observed light curve of V1974 Cyg. Therefore, we assumed that is a decreasing function of time. Here, the decreasing rate of is determined from the wind mass loss rate and the envelope mass of solutions we have chosen. After many trials, we have found that we cannot obtain a light curve as steep as that of V1974 Cyg. Finally, we further assume that is a function both of temperature and time. We define as unity in the outer part of the envelopes (), but a certain constant value () in the inner region (), and changes linearly between them. This assumption well represents the nova envelope model by Shaviv (2001b) outlined in §1. After many trials, we choose at the optical peak (JD 2,448,676) and gradually decreases it to 1.0 with time as shown in Figure 4. The choice of is not unique; we can reproduce visual light curve by adopting another vale of . Here, we choose to reproduce not only band magnitudes but also UV 1455 Å continuum fluxes (Cassatella et al., 2004). This is a strong constraint for a choice of , and thus, we hardly find another that reproduce both visual and UV light curves.
Figure 4 depicts our modeled light curve that reproduces well both the early optical and UV 1455 Å continuum light curves. The observed UV flux is small even in the super-Eddington phase in which the photospheric luminosity is several times larger than that in the later phase. This means that the photospheric temperature is as low as . In our model, the temperature is at the optical peak and lower than 4.0 for 8 days after the peak, gradually increasing with time. Such a behavior is consistent with evolution reported by Chochol et al. (1993), in which is larger than 0.3 for the first ten days from JD 2,448,677 and gradually decreases with time.
In the later phase, our modeled visual magnitude decays too quickly and is not compatible with the observed data. Hachisu & Kato (2005) concluded that this excess comes from free-free emission from optically thin plasma outside the photosphere. They reproduced well the optical light curve in the late phase by free-free emission as shown by the dash-dotted line in Figure 4.
We see that the peak luminosity exceeds the Eddington limit by 1.7 mag, and the super-Eddington phase lasts 12 days after its peak.
The distance to the star is obtained from the comparison between observed and calculated UV fluxes, that is, 1.83 kpc with for =1455 Å (Seaton, 1979). From the comparison of optical peaks, the distance is also obtained to be 1.83 kpc with =0.99 (Chochol et al., 1997). This value is consistent with the distance discussed by Chochol et al. (1997) that ranges from 1.3 to 3.5 kpc with a most probable value of 1.8 kpc (see also Rosino et al., 1996).
4 Discussion
Shaviv (2001b) found two types of radiation-hydrodynamic instabilities in plane parallel envelopes. The first one takes place when decreases from 1.0 (before ignition) to and the second one occurs when decreases to . Here is the gas pressure divided by the total pressure. When the luminosity increases to a certain value the envelope structure changes to a porous one in a dynamical time scale. Radiation selectively goes through relatively low-density regions of a porous envelope. Shaviv (1998) estimated effective opacities in inhomogeneous atmospheres and showed that they always less than the original opacity for electron scattering, but can be greater than the original one in some cases of Kramer’s opacity. Ruszkowski & Begelman (2005) have calculated radiative transfer in slab-like-porous atmospheres, and found that the diffusive luminosity is about 5-10 times greater than the classical Eddington luminosity when the density ratio of porous structures is higher than 100.
In nova envelopes, we do not know either how clumpy structures develop to reduce the effective opacity or how long such porous density structures last. The exact value of the opacity reduction factor is uncertain until time-dependent non-linear calculations for expanding nova envelope will clarify the typical size and the density contrast in clumpy structures. Therefore, in the present paper, we have simply assumed that is a function of temperature and made it to satisfy the condition that is larger than unity deep inside the envelope and approaches unity near the photosphere.
The anonymous referee has suggested that may be a function of “optical width” over a considering local layer rather than a function of temperature. Here, the “optical width” means the optical length for photons to across the local clumpy layer in the radial direction. If this “optical width” is smaller than unity or smaller than some critical value, the porous structure hardly develops and then we have . In the opposite case, the porous structure develops to reduce the effective opacity and then we have much larger than unity. The “optical width” description may be a better expression for the opacity reduction factor , because the relation between the opacity reduction factor and porous structure is clearer.
We have estimated the “optical width” () of a local layer using the solution at the optical peak in Figure 4: it is near the photosphere, 19 at , 580 at at , and at , i.e., the nuclear burning region. Here, we assume that the “geometrical width” of the local layer is equal to the pressure scale hight, . This “optical width” decreases quickly outward and reach the order of unity in the surface region, i.e., the “optical width” is large at high temperature regions and small in low temperature regions. Therefore, we regard that our assumption of qualitatively represents the dependence of the opacity reduction factor on the “optical width”of a local layer.
In our computational method, this “optical width” is calculated only after a solution is obtained after many iterations to adjust boundary conditions. The feedback from the “optical width”’ requires further huge iterations. Therefore, in the present paper, we assume a simple form of .
The wind acceleration is closely related to spatial change of the effective opacity. In a case of varying , for example, when it is a function of temperature, determines the wind acceleration. If we assume the other spatial form of , the acceleration is possibly very different. In our case in Figure 4, is a monotonic function, and then the reduced opacity still has a strong peak at although the peak value is smaller by a factor of than that of the OPAL peak. The resultant velocity profile is essentially the same as those in Figure 1; the wind is accelerated at the shoulder of the OPAL peak.
References
- Cassatella et al. (2004) Cassatella, A., Lamers, H.J.G.L.M., Rossi, C., Altamore,A.,González-Riestra, R. 2004,A&A, 420,571
- Chochol et al. (1997) Chochol, D.,Grygar, J., Pribulla, T., Komzik, R.,Hric, L., & Elkin, V. 1997, A&A, 318, 908
- Chochol et al. (1993) Chochol, D.,R.,Hric, Urban, Z., T., Komzík, Grygar, J., Papousek, J. 1993, A&A, 277, 103
- Della Valle & Livio (1995) Della Valle, M. & Livio, M., 1995, ApJ, 452, 704
- Eyres at al. (2005) Eyres, S.P.S., Heywood, I., O’Brien, T.J., Ivison, R.J., Muxlow, T.W.B., & Elkin, V.G. 2005, submitted to MNRAS, (astro-ph/0501344)
- Hachisu & Kato (2005) Hachisu, I. & Kato, M., ApJ, 2005 in press (Astro-ph/0506246)
- Iglesias & Rogers (1996) Iglesias, C.A., & Rogers, F.J, 1996, ApJ, 464, 943
- Iijima and Esenoglu (2003) Iijima, T., & Esenoglu, H. H. 2003, A&A, 404, 997
- Kato (1983) Kato, M. 1983, PASJ, 35, 507
- Kato (1985) Kato, M. 1985, PASJ, 37, 19
- Kato (1997) Kato, M. 1997, ApJS, 113,121
- Kato & Hachisu (1994) Kato, M., & Hachisu, I. 1994, ApJ, 437, 802
- Kovetz (1998) Kovetz, A., 1998, ApJ, 495, 401
- Krautter (2002) Krautter, J., 2002, in Classical Nova Explosions, eds. M. Hernanz & J. José (New York: AIP conference proceedings 637), p.345
- Kutter & Sparks (1989) Kutter, G.S., & Sparks, W.M., 1989, ApJ,340,985
- Nariai et al. (1980) Nariai, K., Nomoto, K., & Sugimoto, D. 1980, PASJ, 32,473
- Prialnik et al (1986) Prialnik, D., 1986, ApJ, 310,222
- Prialnik & Kovetz (1992) Prialnik, D., & Kovetz, A. 1992, ApJ, 385,665
- Prialnik et al (1978) Prialnik, D., Shara, M. M., & Shaviv, G. 1978, A&A, 62, 339
- Rosino et al. (1996) Rosino, L., Iijima, T., Rafanelli, P., Radovich, M., Esenoglu, H., & della Valle, M. 1996, A&A, 315, 463
- Ruszkowski & Begelman (2005) Ruszkowski, M. & Begelman, M.C. 2005, ApJ, 586, 384
- Seaton (1979) Seaton, M.J. 1979, MNRAS, 187,73
- Shaviv (1998) Shaviv, N. J. 1998, ApJ, 494, L193
- Shaviv (2001a) Shaviv, N. J. 2001a, ApJ, 549, 1093
- Shaviv (2001b) Shaviv, N. J. 2001b, MNRAS, 326, 126
- Shaviv (2002) Shaviv, N. J. 2002, in Classical Nova Explosions, eds. M. Hernanz & J. José (New York: AIP conference proceedings 637), p.259
- Sparks et al (1978) Sparks, W. N., Starrfield, S., & Truran J. W. 1978, ApJ, 220, 1063
- Starrfield et al. (1985) Starrfield, S., Sparks, W. M., Truran, J. W. 1985, ApJ, 291, 136