X-ray Emission from Megamaser Galaxy IC 2560
Abstract
Observation of the H2O megamaser galaxy IC 2560 with the Chandra Observatory reveals a complex spectrum composed of soft X-ray emission due to multi-temperature thermal plasma, and a hard continuum with strong emission lines. The continuum is most likely a Compton reflection (reprocessing) of primary emission that is completely absorbed at least up to 7 keV. The lines can be identified with fluorescence from Si, S and Fe in the lowest ionization stages. The equivalent widths of the Si and S lines are broadly compatible with those anticipated for reprocessing by optically thick cold plasma of Solar abundances, while the large equivalent width of the Fe line requires some overabundance of iron. A contribution to the line from a transmitted component cannot be ruled out, but the limits on the strength of the Compton shoulder make it less likely. From the bolometric luminosity of the nuclear region, we infer that the source radiates at 1 - 10% of its Eddington luminosity, for an adopted central mass of M⊙. The overall spectrum is consistent with the hypotheses that the central engines powering the detected megamsers in accretion disks are obscured from direct view by the associated accretion disk material itself, and that there is a correlation between the occurrence of megamaser emission and Compton-thick absorption columns. For the 11 known galaxies with both column density measurements and maser emission believed to arise from accretion disks, eight AGN are Compton thick.
1 Introduction
Position-velocity resolved interferometric mapping of water vapor maser emission ( MHz) in active galactic nuclei (AGN) is a powerful tool for the study of gas structures and dynamics in regions less than of order 1 pc from massive central engines. For the cases in which the megamaser emission can be identified with an accretion disk rather than with the wind- or jet-like outflow, such mapping may allow the determination central engine (and presumably black hole) mass, Eddington luminosity, and disk geometry (e.g., warping). The three most notable examples are: the geometrically thin accretion disk of NGC 4258 (Myioshi et al. 1995; Greenhill et al. 1995) which obeys a Keplerian rotation law to ; the apparently massive accretion disk within the NGC 1068 AGN (Greenhill et al. 1997; Kumar 1999; Lodato & Bertin 2003); and the accretion disk within the nucleus of the Circinus Galaxy (Greenhill et al. 2003), and the associated wide angle wind.
Water megamaser and nuclear activity are linked by the maser pump process which in the case of accretion disks, is plausibly driven by collisions in molecular gas heated by X-ray irradiation (Neufeld, Maloney, & Conger 1994). Nonetheless, detectable megamaser emission is relatively rare. This is probably a consequence of intrinsic luminosity and geometry. In general, maser emission is amplified most along the directions in which there is the most material with overlapping line-of-sight velocities, and as a result the emission is beamed narrowly along tangent planes for any individual accretion disk. Association with type-2 AGN is a consequence.
Average detection rates among type-2 AGN are on the order of 10% (e. g. Braatz et al. 2004), depending on galaxy distance and instrument sensitivity. Only megamaser systems are known (Kondratko et al. 2005b, c; Henkel et al. 2005 and references therein) and evidence from spectra and Very Long Baseline Interferometer (VLBI) maps associating the emission with accretion disks is available for about a third (e.g., Kondratko, Greenhill, & Moran 2005a). Nonetheless, the contribution to understanding of AGN by broadband studies of megamaser galaxies lies in the qualitatively greater level of detail that may be achieved, specifically because the structure and dynamics of the molecular gas can be so well constrained.
Though the central engines associated with megamasers are likely to be obscured in the optical, UV, and soft X-ray bands -- at least for the absorbing columns corresponding to less than a few Thomson optical depths -- X-ray spectroscopy can provide a good estimate of the absorbing column, and thus the true luminosity of the central source. For other, more heavily obscured sources, the details of the profile of the Fe K line can often provide additional constraints (e.g., Levenson et al. 2002). One good candidate for detailed measurements is the Seyfert 2 galaxy IC 2560. It contains an H2O megamaser (Braatz, Wilson,& Henkel 1996), with a peak flux density of up to Jy. This relatively nearby (26 Mpc; km s-1) source has been partially resolved with the VLBI (Ishihara et al. 2001) and a central black hole mass of M⊙ inferred, which is relatively low but comparable to the mass of the black hole in our own Milky Way (Ghez et al. 2005; Schödel et al. 2003) and Circinus Galaxy (Greenhill et al. 2003).
Prior to the observation described in Section 2, this object has been observed with Chandra in 2000 October, via a short ( ks) observation, reported in Iwasawa, Maloney, & Fabian (2002), and even before that, with Asca (Ishihara et al. 2001). The data reported here are based on a longer, 50 ks pointing obtained in 2004 February.
2 Observations, data reduction, and spectral fitting
A 50 ks Chandra observation of IC 2560 was conducted on 2004 February 16-17. The processed data were reduced using the XSELECT tool, with an independent analysis using CIAO. Data were collected with ACIS-S, with the source on chip S3. The intensity of unrejected background was constant and relatively low (less than 2 ct s-1 in the entire ACIS-S3 chip), showing no sign of any flares, so removal of any additional data segments was not necessary. The image consists mainly of the point source, but there is a hint of some extended component. The spectrum of the extended component is under investigation. To measure the spectrum of the nuclear source, we extracted the data from a region ( pc) in radius, and determined the background from an annulus with inner radius and outer radius centered on the source. This corresponds to roughly 3.8 kpc and 11.3 kpc at the source’s distance, and while might also include some of the diffuse emission from the galaxy itself, in the quite compact source region chosen here, the contribution of such diffuse emission (or instrumental background) was negligible, less than 0.1% of the source count rate. Total net count rate in the 0.5 - 10.0 keV range was 0.025 ct s-1. The spectrum was subsequently rebinned to allow at least 20 counts in a new spectral bin. We note that there is no variability in the source flux during the Chandra observation. Furthermore, the source shows the same count rate -- as well as flux, for the same assumed models -- as reported in Iwasawa et al. (2002). We prepared the ACIS S3 redistribution matrices and the effective area files as appropriate for this observation. Since the data were taken relatively recently, the CTI correction has been applied in the course of the pipeline processing.
|
modelaaThose describe spectral forms incorporated into the
model:
mk -- mekal, po -- power law,
ga -- Gaussian line, rf -- Compton reflection (pexrav), 3ga -- three Gaussian lines, ds -- Compton down-scattered line shoulder, ab -- additional absorption at redshift of host galaxy |
bbmekal model plasma temperature and metal abundances (keV) | bbmekal model plasma temperature and metal abundances | bbmekal model plasma temperature and metal abundances (keV) | bbmekal model plasma temperature and metal abundances | ccPower law photon spectral index, | EW (keV)ddEW is the equivalent width of the Fe 6.4 keV line | /dof |
|---|---|---|---|---|---|---|---|
| 1 mk+po+ga | -- | -- | 89.6/49 | ||||
| 2 mk+rf+ga | -- | -- | 90.2/49 | ||||
| 3 2mk+rf+ga | 83.7/48 | ||||||
| 4 2mk+rf+3gaf | 71.1/44 | ||||||
| 5 ab+2mk+rf+3ga+dsh | 61/42 |
line intensity of
| modelaaSpectral components: xstar - XSTAR photo-ionization model; other components as in Table 1 | bbLog of ionization parameter in XSTAR model | bbLog of ionization parameter in XSTAR model | ccPlasma temperature in mekal model (keV) | ddPower law photon spectral index, | EW (keV)eeParameter fixed; the abundances are not well constrained () | /dof |
|---|---|---|---|---|---|---|
|
1 xstarffThree Gaussian lines are the Fe-K, Si-K, and S-K
lines originating in neutral material,
as described in the text+rf+3ga |
1.6 | -- | -- | 152/49 | ||
| 2 xstarffModel parameterized by ionization parameter and H column density, . Fits show no dependence on , uncertainties on are usually smaller than model grid spacing (), and are not shown+po+rf+3ga | 1.6 | -- | -- | 3.5 | 106/48 | |
| 3 xstarffModel parameterized by ionization parameter and H column density, . Fits show no dependence on , uncertainties on are usually smaller than model grid spacing (), and are not shown+mk+rf+3ga | 3.0 | -- | 89.4/47 | |||
| 4 2xstarffModel parameterized by ionization parameter and H column density, . Fits show no dependence on , uncertainties on are usually smaller than model grid spacing (), and are not shown+rf+3ga | 3.0 | 1.4 | -- | 96.4/47 | ||
| 5 2xstarffModel parameterized by ionization parameter and H column density, . Fits show no dependence on , uncertainties on are usually smaller than model grid spacing (), and are not shown+mk+rf+3ga | 3.0 | 58.1/45 |
The background-subtracted data are well-represented by a spectrum with three general components: a very hard continuum, a soft component with some soft X-ray emission lines, and an emission line complex between 6 and 7 keV, presumably due to Fe K-shell transitions. This is illustrated in Figure 1 where we assumed as a model a simple power law, absorbed by the Galactic column of cm-2. The residuals clearly show the features above. This spectrum is similar to that reported by Iwasawa et al. (2002), but the longer exposure clearly reveals more details, with better resolved spectral features. A somewhat more complex and realistic model including a power law, collisionally ionized plasma (described as a mekal XSPEC model; see below) and Gaussian line, respectively, for the hard continuum, soft emission, and the Fe line, gives an energy power law index (Table 1, Model 1). This is extremely hard for the intrinsic X-ray spectrum of an AGN, but since IC 2560 is a megamaser source, the AGN might be obscured by a large column of absorbing material and the continuum measured here is probably not the primary spectrum. Specifically, the primary continuum might well be a power law, but we anticipate that it is heavily absorbed rather than particularly hard (as compared to unobscured Seyferts), and it may be accompanied by a Compton reflection component, which is likely to be present when the primary source photons are reprocessed by circumnuclear material. If the absorption is particularly severe -- cm-2 or more for Solar abundances -- the very hard spectrum measured above keV could be just that due to the reflected component, although some additional flux might arise via transmission through the absorber.

Below, we describe the hard continuum as pure Compton reflection. When we replace the power law component representing the primary continuum with a reflection component at a fixed inclination (using the XSPEC model pexrav; see Magdziarz & Zdziarski 1995), we obtain , which corresponds to a more reasonable intrinsic spectrum of the illuminating photons. The choice of a pure reflection model is also supported by the detection of the very strong, intrinsically narrow Fe K line (equivalent width keV, depending on the adopted continuum model, and eV) at an energy keV, which is consistent with neutral material and in agreement with Iwasawa et al. (2002). The soft component below 1 keV is fairly well fit by a single temperature, collisionally ionized plasma with keV, but with unphysically low abundances (Table 1, Model 2).
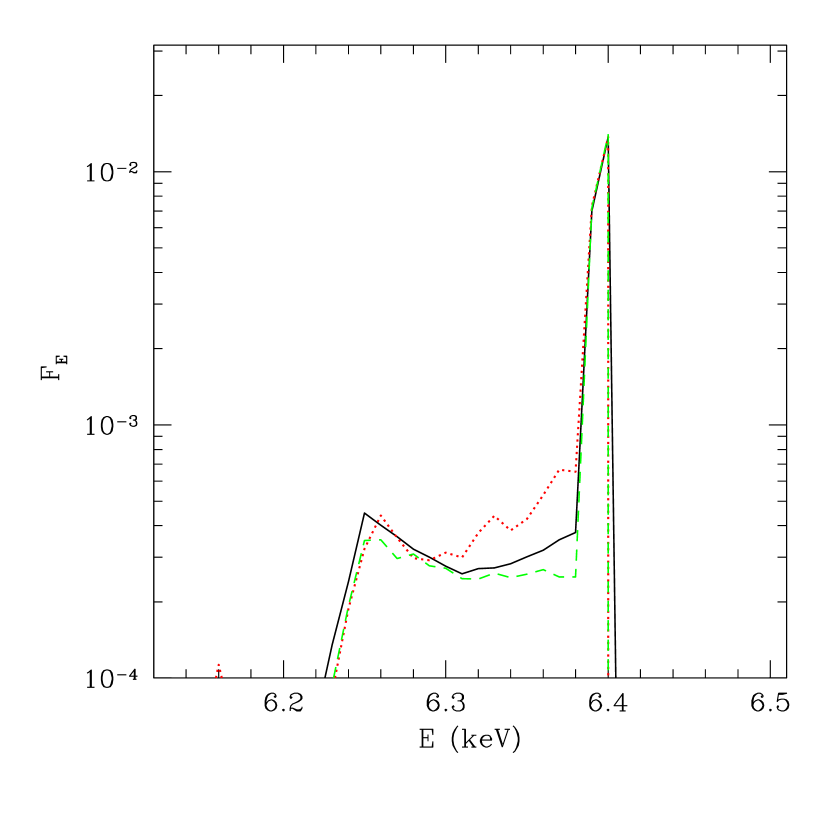
The strong iron line should also be accompanied by a noticeable Compton downscattered shoulder, forming a continuum centered at a rest frame energy of keV, with intrinsic width of keV (Illarionov et al. 1979). The strength of this continuum relative to the unscattered narrow line core depends on details of the reflecting material (Matt 2002; see Fig. 2). This component has been seen in other reflection-dominated AGN such as Circinus Galaxy (Molendi, Bianchi, & Matt 2003), NGC 4945 (Done et al. 2003), and NGC 1068 (Matt et al. 2004). We incorporated the shape of this downscattered continuum (Illarionov et al. 1979) as a local model in xspec, assuming a temperature of 1 eV for the reflecting material, and include it in the spectral fit in Table 1, Model 5. While this downscattered continuum is not significantly detected in our data, the 90% confidence upper limit on its strength is % of that of the narrow line core. The low value indicates super-Solar iron abundance, with the observed flux arising from a reflector viewed at a high inclination (Matt 2002), as may be anticipated for reflection from the far side of a flattened structure with fairly constant ratio of height to radius.
In addition to the 6.4 keV line, there is probably a marginally resolved line at 6.7 keV as well, although it is not highly significant (and thus not included in any fits in Table 1): adding three parameters improves the best-fit only by 5. Close inspection of the unbinned data does not reveal whether the line is intrinsically broad or divisible into sub-components, but the latter is a more likely possibility. If real, the 6.7 keV emission indicates very hot or highly ionized material, in contrast to the neutral material responsible for the 1.75 (Si) and 2.32 keV (S) lines discussed below, and the Compton reflecting material, which has a lower inferred ionization parameter. Presence of 6.7 keV emission provides marginal evidence of a multi-temperature plasma in close proximity to the central engine.
Rather than a very low abundance single-temperature plasma, the soft spectrum may be well fit by a model comprising nearly Solar abundance material, but also including second plasma component with keV. The new component contributes the additional continuum necessary to dilute model line strengths and match the observations with more typical abundances (Table 1 as Model 3). These two temperature components are probably simply an approximation to the multi-temperature hot gas which is expected in starburst regions (e.g. Strickland & Stevens 2000). It should not be confused with the multi-temperature plasma inferred from the Fe line emission, which originates on much smaller scales. We note here that even though a 2-temperature model is consistent with Solar abundances, it constrains them poorly: spectral fits -- where we require the same abundance of both mekal components -- allow abundances ranging from 0.2 to 1. We note here that it is possible to fit the spectrum with a combination of thermal plasma and photo-ionized components, but at least some contribution from thermal plasma is required; we discuss this more extensively below. However, there is no combination of hot gas components which can account for the major residuals in the spectral fit at and keV. This is because these features are at the energies expected from neutral Si and S, so cannot be produced by hot plasma emission. The obvious cool plasma component is the one which produces the reflected continuum. For Solar abundances this should produce an equivalent width of and eV in neutral Si and S, respectively (Matt, Fabian, & Reynolds 1997) to accompany the Fe line of equivalent width 0.8--1.6 keV (depending on atomic data and assumed geometry: George & Fabian 1991; Życki & Czerny 1994, Matt, Brandt, & Fabian 1996). Adding in two additional Gaussian lines gives Si line emission with equivalent width of eV at keV and S of eV at keV, accompanying the neutral fluorescent iron line of large equivalent width, keV (Table 1, Model 4). Thus while the Si and S line energies and strengths are consistent (though with fairly large error bars) with the fluorescent lines expected from reflection from X--ray illuminated neutral material with Solar abundances, the iron line is relatively strong, which indicates super-Solar abundances in this element.
There is some evidence for additional cold photoelectric absorption, with the best fit yielding cm-2 in addition to the cm-2 attributable to our Galaxy. This inference depends on the description of the hot gas component: this is because the abundances and relative intensities in the mekal plasma are strongly correlated with the inferred level of photoelectric absorption in the spectral fitting. In any case, such columns are generally seen towards starbursts, as expected from the molecular gas in these regions (e.g., Pietsch et al. 2001). Note that this is in contrast to the primary continuum of the AGN which we assume to have very large absorption, cm-2. The model including such additional absorption is now given in Table 1 as Model 5.
Although the observed soft X-ray emission is consistent with arising in a gas-rich, dusty starburst region, there is a potential alternative origin via scattering in partially ionized material. Such extended emission from photo-ionized gas is seen in the soft X-ray spectra of other AGN (e.g. Mkn 3; Sako et al. 2000). Here we investigate the origin of this emission by replacing the two mekal plasma components with the emission expected from photo-ionized gas (modeled using the XSTAR code: Bautista & Kallman 2001; grid19c from the XSTAR web page). A simple model, with one XSTAR component replacing the two mekal components (from Model 4 in Table 1) gives a bad description of data, (Model 1 in Table 2). The fit can be improved by adding a power law representing the primary emission scattered off a completely ionized plasma, but the fit is still unsatisfactory (; Model 2 in Table 2), with strong residuals around 0.6 and 1 keV. However, previous fits indicate that the emitting plasma is multi-temperature, therefore we also try more complex models. Two photo-ionized XSTAR components (with different ionization parameters) give a better fit, (Model 4), but strong residuals still remain at low energies. These residuals cannot be explained by any pair of photo-ionized components, but an inclusion of an additional mekal component provides a satisfactory fit, giving (Model 5). For completeness, we have also investigated that a simpler hybrid model with one XSTAR and one mekal component (Model 3), but this gives an unsatisfactory fit, . Thus, at least some contribution from mechanically-heated plasma is necessary to explain the soft X-ray emission, but even then, the photo-ionized plasma has to have a range of ionization stages. Presence of mechanically (collisionally) heated plasma is in fact expected in IC 2560, as the galaxy contains a starburst region (Cid Fernandes et al. 2004).
To quantify this, we investigated the relative fluxes of the mekal and photo-ionized plasmas. The two mekal components in Model 5 of Table 1 contribute comparably -- at the observed flux level of erg cm-2 s-1. In the hybrid model, Model 5 of Table 2, the mekal component contributes comparably to that in low component in the two-mekal model ( erg cm-2 s-1), while the sum of the two XSTAR components contributes erg cm-2 s-1. This leads us to the conclusion that the total contribution of photo-ionized emission to the soft X-ray flux of IC 2560 can be as little as 0% and much as % of the total, but (1) at least some collisionally heated plasma is required, and (2) the photo-ionized component implies a wide range of ionization parameters.
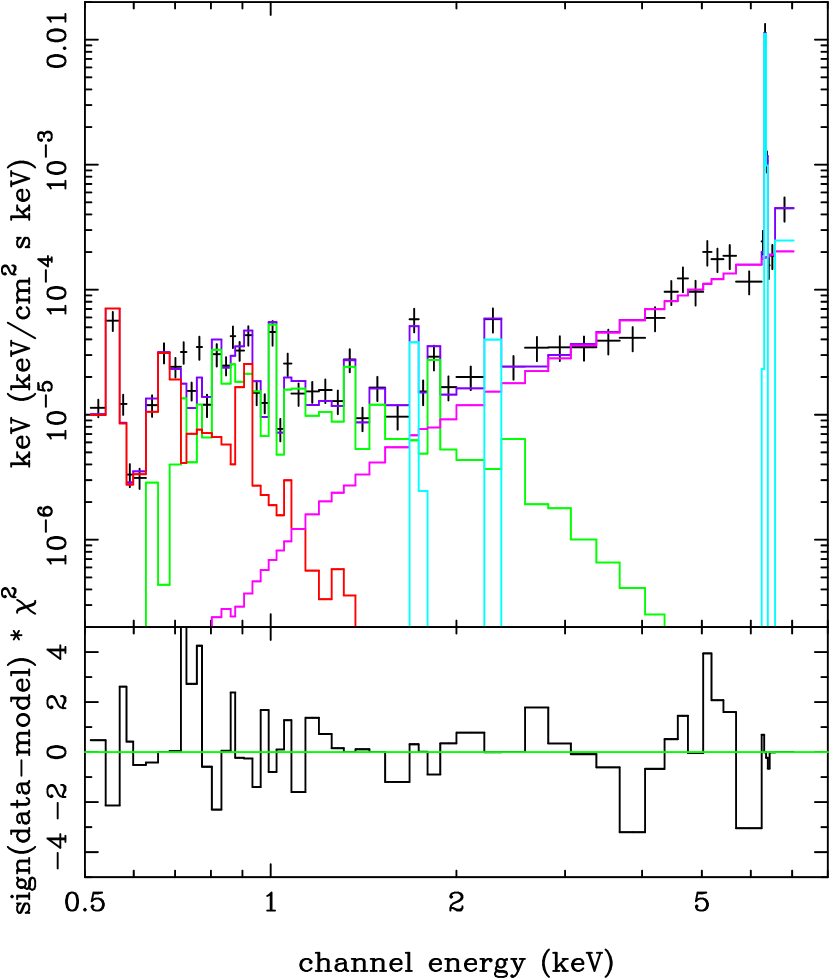
Hence we use the best fit starburst/reflection dominated AGN model (that given in Table 1 as Model 5) to plot the unfolded spectrum shown in Fig. 3. A remaining small residual can be seen at keV. Including a free Gaussian line to model this feature gives a better fit with , formally a significant detection with line energy keV, width keV and very large EW of keV. However, no plausible atomic features exist at this energy. At such high equivalent width it is most likely to be iron but the energy shift is very large, requiring the material to be flowing away from the observer at km s-1; a multiple Compton downscattered shoulder explanation seems even more contrived. However, this best fit also requires that the reflected emission is now due to an unusually steep power law illuminating the reflector, with energy spectral index . Assuming that the intrinsic AGN spectrum has a more usual gives , compared to without the additional line, so it is not significant on an F-test. Thus it seems most likely that this feature may be an artifact in a complex, low signal-to-noise spectrum.
With such a model, and including the emission lines as given below, the measured total 2--10 keV flux is erg cm-2 s-1. When the emission lines discussed below are accounted for separately, then measured reflection model flux (and this of course does not include the primary continuum) is erg cm-2 s-1. In the extreme case, if the reflector were to subtend a solid angle as large as , it would have to be illuminated by an intrinsic, unabsorbed -- but invisible directly to the observer -- 2--10 keV flux of erg cm-2 s-1. A more likely geometry might be one in which much smaller fraction of the reflector is visible to us, in which case the unabsorbed flux of the AGN is correspondingly higher. We can thus set a lower limit on the 2 -- 10 keV luminosity of erg s-1: at least this much is needed to account for the reflected spectrum.
3 Origin of the X-ray spectral features and the relationship of the megamaser emission to the X-ray absorption
The spectral fits presented in the previous section indicate that the iron K line is somewhat stronger than predicted, perhaps indicating super-Solar iron abundance. We quantify this by a Monte Carlo simulation of reflection from a square cross-section torus-like structure with Thomson optical depth , with inner edge starting from the ‘‘torus’’ axis (see Krolik, Madau, & Życki 1994). This gives a predicted iron K line equivalent width of 1.5 keV (Anders-Grevesse abundances: Fe/H = ), or 1.2 keV (Anders-Ebihara abundances: Fe/H = ), for viewing angles close to the equatorial plane. To get a reflected iron line as large as that observed requires at least 2 Solar abundance of Fe. The large iron K line also should be accompanied by strong K emission at keV, whose strength is about 10% of that of the K line. While the signal-to-noise ratio at these high energies is not high, such a feature (with all parameters fixed or tied to K) reduces by 3 to .
An alternative explanation for a large iron line equivalent width is the contribution from a heavily absorbed transmitted spectrum as well as reflection (Ghisellini, Haardt, & Matt 1994; Levenson et al. 2002). If the observed line is indeed due to transmission, it would imply that the direct component, expected at 20-100 keV, should be quite strong, as in the case of NGC 4945 (Done, Madejski, & Smith 1996). However, with Solar abundances, this would require the model torus to subtend a rather large solid angle with a polar opening angle of (Levenson et al. 2002). The Compton downscattered shoulder would also be stronger than that seen in reflected emission, up to 40% of the strength of the narrow line core (Matt 2002; see also Fig. 2), which is inconsistent with the 15% limit on the downscattered continuum estimated here.
From the spectral fits described in Tables 1 and 2, a picture emerges where the heavily absorbed primary continuum is reprocessed by nearly neutral material producing a Compton reflection component as well as fluorescence lines from Fe, S and Si. IC 2560 joins the rather small number of AGN (Mkn 3: Sako et al. 2000 and NGC 6552: Reynolds et al. 1994) in which the fluorescence lines of species with low atomic numbers (Si and S) are seen, and thus, reflected continuum in the 1--10 keV band dominates. The reflector is likely to be formed by the same optically thick material that obscures a direct view of the central engine. In IC 2560, H2O megamaser emission is also believed to arise from a close to edge-on structure (Ishihara et al. 2001), which by analogy to the well studied case of NGC 4258, is probably a parsec or sub-parsec radius annulus in an accretion disk. Geometrically, the simplest explanation of the reflector, absorber, and maser are that all three correspond to the same structure, the accretion disk. (See Greenhill et al. 2003 for discussion of similar circumstances in Circinus Galaxy.) We expect to see in reflection only a small ‘‘sliver’’ of this X-ray illuminated material on the far side of the disc (a feature readily accommodated if the disk is warped), as has been observed in the megamaser galaxies NGC 4258 (Miyoshi et al. 1995) and Circinus Galaxy (Greenhill et al. 2003). Alternatively, reflection could originate from low covering fraction, dense clouds above and below the obscuring maser structure that blocks our view of the central engine. The former explanation has the advantage of being simpler: only one high column structure required, while the latter requires different regions of optically thick material.
Regardless of the detailed location and geometry of the Compton reflector, the covering fraction of reflecting material is less than unity. This provides a lower limit to the intrinsic X-ray flux, erg cm-2 s-1 in the 2--10 keV band, corresponding to a minimum bolometric (0.01 - 100 keV) flux of erg cm-2 s-1 and luminosity erg s-1. Adopting the central engine mass estimated by Ishihara et al. (2001), we can calculate . If we assume that all of the observed IR emission ( erg s-1) is reprocessed nuclear flux, then a very conservative upper limit is . In reality this upper limit could be reduced to account for the IR flux that might arise in the circum-nuclear starburst region. With these constraints, we can infer that the accretion rate is more like that inferred for the common, broad-line Seyfert 1 galaxies (e.g. Czerny, Różańska, & Kuraszkiewicz 2004) and the heavily obscured (Seyfert 2) megamaser galaxies NGC 3079 (Kondratko et al. 2005b), NGC 4945 (Greenhill et al. 1997), and NGC 1068 (Greenhill & Gwinn 1997), than it is for the low core of the classic megamaser galaxy NGC 4258 (e.g., Lasota et al. 1996).
IC 2560 bears a startling resemblance to NGC 4945 (Done et al. 2003; Schurch, Roberts, & Warwick 2002) in showing a reflection dominated hard X-ray spectrum, together with starburst dominated soft X-ray emission. In IC 2560, there is evidence for a young ( MYr) stellar population (Cid Fernandes et al. 2004), so it seems likely that there is hot gas from a starburst providing the majority of the soft X-ray flux, rather than photo-ionization. These characteristics differ from Mkn 3 (Sako et al. 2000) and NGC 1068 (Ogle et al. 2003), which have clear signatures of predominantly photo-ionized soft X-ray emission. In both cases, detection of polarized broad optical emission lines, indicates that there is a ’’mirror’’ directly reflecting UV and soft X-rays from the central source. Neither IC 2560 nor NGC 4945 show broad polarized emission lines. It is worth noting here that both IC 2560 and NGC 4945 are powered by relatively low-mass black holes and have modest nuclear luminosities. Low intensity in the photo-ionized component might be simply due to low luminosity of the central source.
A plausible scenario for many megamaser galaxies (as well as other Seyfert 2s) is that we view the primary power law continuum of through an absorber of appreciable optical thickness. This can provide an absorbing column due to the neutral gas that might be relatively small ( cm-2), where the primary continuum shows a modest photoelectric absorption cutoff as in Mkn 3 or NGC 4258. Alternatively, the absorber can provide a column of several times cm-2 or more, as seen in NGC 4945, NGC 1068, and NGC 3079 -- and IC 2560 belongs to the latter group (see Table 3). For material that is optically thick to electron scattering, the primary continuum is depressed at all energies. For a column with Thomson optical depth of order unity ( cm-2), the attenuated primary spectrum can be seen above 10 keV (as in NGC 4945), but for higher columns it is completely suppressed (as in NGC 1068). The column in IC 2560 can only be constrained by the current Chandra data to be greater than or equal to that seen in NGC 4945, cm-2. Sensitive observations at higher X-ray energies are required in order to determine whether the primary emission can be detected above 10 keV or whether like NGC 1068, IC 2560 is completely obscured along the line of sight.
The possibility of a physical association between megamaser emission and obscuring material raises the question of whether there may be a correlation between the occurrence of visible megamaser emission and detection of large obscuring columns. Most importantly, maser emission is anisotropic, and for a thin, moderately warped disk, it would be beamed in a narrow solid angle about the tangent planes (contingent on favorably small gradients in line-of-sight velocity). As well, it is conceivable that maser amplification could be enhanced (i.e., longer gain paths or narrower beam angle) when large columns are present. Direct evidence that megamaser emission originates from disk material is available for about a third of the known masers, chiefly in the form of VLBI maps or spectra that display highly Doppler shifted line complexes symmetrically bracketing the systemic velocity (. Of these, there are estimates of X-ray absorption columns for 11 galaxies. Most of these systems are Compton thick; eight exhibit absorption in excess of 1024 cm-2 (Table 3). Overall, the distribution of column densities is substantially skewed with respect to the absorption distribution for type-2 AGN in general (Bassani et al. 1999; Risaliti et al. 1999). However, three known Compton thin cases are notable: NGC 4258, NGC 4388, and NGC 4051. Each exhibits variation in column density (Fruscione et al. 2005; Elvis et al. 2004; McHardy et al. 1995). In the case of NGC 4258, the accretion disk has been shown to cross the line of sight to the central source and modest variability in over months is believed to arise from clumpiness at radii comparable to that of the persistent maser emission, on the order of - Schwarzschild radii (Fruscione et al. 2005; Herrnstein et al. 2005). In contrast, NGC 4388 has displayed extreme variability in column density, on time scales as short as hours, and to values as low as cm-2. The inferred radius of the absorber is RSch (Elvis et al. 2004). The angular structure and persistence of the maser emission is not known, but comparison to that of the absorber would enable testing of whether both arise from the same (disk-like) structure. The third AGN, NGC 4051 is unusual in that it is a narrow line Seyfert 1 (NLSy1) yet hosts a maser source that has been suggested to arise in a central accretion disk (Hagiwara et al. 2003). Column density variation is evident (McHardy et al. 1995), but unlike NGC 4258 and NGC 4388, the absorber is ionized and unlikely to lie physically close to the maser medium. It is unlikely that there is any edge-on structure comprising cold material that could support maser emission, and the characteristics of the maser spectrum is consistent with origin in a wind rather than a disk (see Table 3 note). This is notable given the importance of nuclear winds in the formation of NLSy1 spectra. On the other hand, the absorber and maser could both trace different parts of a warped structure that is only moderately inclined at small radii and tangent to some lines of sight at large radii. A clumpy or frothy medium might also enable a line of sight to the central source and ionized absorber at the same time as long gain paths are achieved among clumps at larger radii.
| Galaxy | ID (2)(2)footnotemark: | References | |||
|---|---|---|---|---|---|
| VLBI | Spectra | ( cm-2) | Maser | ||
| NGC 4945 | 1 | 13 | |||
| Circinus Galaxy | 2 | 14 | |||
| M 51 | 3 | 15 | |||
| NGC 1386 | 4 | 16, 24 | |||
| NGC 1068 | 5 | 17 | |||
| NGC 3079 | 6 | 18 | |||
| IC 2560 | 7, 8 | 19 | |||
| NGC 3393 | 9 | 20 | |||
| NGC 4258 | 10 | 21, 22 | |||
| NGC 4388 | 11 | 23 | |||
| NGC 4051 | 0 (cold); (ionized) | 12 | 24 | ||
(1)-- Henkel et al. (2005) and Kondratko et al. (2005b, 2005c) list known H2O masers in AGN. Disk masers are those originating within accretion disks, at parsec or sub-parsec radii.
(2)-- Nature of evidence supporting disk maser identification. VLBI mapping provides direct evidence. Spectra exhibiting red and blueshifted emission (more or less) symmetrically bracketing provide indirect evidence. For inclusion here, offsets from systemic must be km s-1.
Notes on specific objects:
NGC 4945-- Disk-like structure detected, similar to NGC 3079.
Circinus Galaxy-- Column cm-2 is admitted in an alternate model.
M 51-- Red and blueshifted maser emission are intermittent separately.
NGC 1386-- VLBI detection of red side of the disk. Later detection of the blue side in spectra.
NGC 4388--Classified as a Seyfert 2 galaxy, but recently, exhibited large, rapid change in .
NGC 4051-- Narrow-line Seyfert 1; no neutral absorber; ionized absorber with significant variability. Spectrum comprises narrow lines distributed over km s-1, though not well centered on . Hagiwara et al. (2003) infer association with an accretion disk. However, broadly spread narrow lines are also consistent with emission from a wind, as in Circinus (Greenhill et al. 2003).
References-- (1) Madejski et al. (2000); (2) Matt et al. (1999); (3) Fukazawa et al. (2001); (4) Guainazzi et al. (2005); (5) Matt et al. (1997); (6) Iyomoto et al. (2001); (7) Iwasawa et al. (2002); (8) this paper; (9) Guainazzi et al. (2005); (10) Fruscione et al. (2005); (11) Elvis et al. (2004); (12) McHardy et al. (1995); (13) Greenhill et al. (1997); (14) Greenhill et al. (2003); (15) Hagiwara et al. (2001); (16) Braatz et al. (1997); (17) Greenhill & Gwinn (1997); (18) Kondratko et al. (2005b); (19) Ishihara et al. (2001); (20) Kondratko et al. (2005c); (21) Miyoshi et al. (1995); (22) Greenhill et al. (1995); (23) Braatz et al. (2004); (24) Hagiwara et al. (2003)
4 Summary and conclusions
Chandra observation of the H2O megamaser galaxy IC 2560 reveals a complex X-ray spectrum. At low energies, it exhibits a soft spectral component that is unlikely to be characterized by a single-temperature, collisionally-ionized plasma, as this would require anomalously low elemental abundances. Instead, the soft component probably arises from such plasma -- presumably associated with the host galaxy -- at a range of temperatures, 0.1 keV 0.7 keV, with abundances close to Solar. It is also possible to fit the spectrum by a model that combines one collisionally ionized plasma component and a complex photo-ionized scattering medium, with a range of ionization parameters.
At higher energies, the spectrum is dominated by a very hard X-ray continuum, together with several emission line features at energies consistent with neutral Fe, Si, and S K lines. The best interpretation of such a hard spectrum is that the primary continuum is entirely absorbed (at least in the Chandra bandpass), requiring cm-2, and that we observe only the much harder Compton reflection of the hidden primary continuum from optically thick, high column density material. Given that the H2O megamaser emission is believed to arise in a close to edge-on disk-like structure and that maser action requires a large column of material, the simplest interpretation is that all three high column, low-ionization structures (absorber, reflector and megamaser) arise from a single physical component, probably a pc-scale or smaller accretion disk. We hypothesize that this is the case more generally and anticipate a correlation of megamaser emission and high X-ray obscuration. In an initial sample of 11 galaxies, this hypothesis is borne out. Discovery of new maser sources, identification of emission origins for known sources, and measurement of X-ray spectra for host AGN will enable further testing.
The Compton reflection from this material also produces strong fluorescent emission lines. The observed intensities of the Si and S lines are entirely consistent with reprocessing by Solar abundance material, while the Fe K line, with equivalent width of keV, is a factor of 2 higher than expected. The line might arise in reflection, transmission, or both. However, the most likely explanation for the high equivalent width of the line is Compton reflection from neutral medium with super-Solar () Fe abundances. This is further supported by the estimated upper limit on the intensity of the Compton ‘‘shoulder’’ that should be associated with the Fe K line.
The intensity of the reprocessed component provides a lower limit on the 2 - 10 keV flux of the unabsorbed primary continuum of erg cm-2 s-1, corresponding to a lower limit on the 0.01 - 100 keV luminosity of erg s-1. Conversely, the observed bolometric luminosity of ers s-1 places an upper limit. Since the mass of the central source estimated from partial resolution of the megamaser angular structure is M⊙, we infer that the source is accreting at a moderate rate corresponding to , as is the case for other heavily absorbed megamaser galaxies (e.g., NGC 1068). Further clues to the structure of this source are likely to be revealed by sensitive hard X-ray observations at 10 - 50 keV, with missions such as NASA’s NuSTAR.
References
- Bassani et al. (1999) Bassani, L., et al. 1999, ApJS, 212, 473
- Bautista and Kallman (2001) Bautista, M. A., & Kallman, T. 2001, ApJS, 134, 139
- Braatz, Wilson, & Henkel (1996) Braatz, J. A., Wilson, A. S., & Henkel, C. 1996, ApJS, 106, 51
- Braatz et al. (1997) Braatz, J., Greenhill, L., Moran, J., Wilson, A., & Herrnstein, J. 1997, Bull. A. A. S., 29, 1374
- Braatz et al. (2004) Braatz, J. A., Henkel, C., Greenhill, L. J., Moran, J. M., & Wilson, A. S. 2004, ApJ, 617, L29
- Cid Fernandes et al. (2004) Cid Fernandes, R., et al. 2004, ApJ, 605, 127
- Czerny et al. (2004) Czerny, B., Różańska A., & Kuraszkiewicz J. 2004, A&A, 428, 39
- Done et al. (2003) Done, C., Madejski, G. M., Życki, P. T., & Greenhill, L. J. 2003, ApJ, 588, 763
- Done et al. (1996) Done, C., Madejski, G., & Smith, D. 1996, ApJ, 463, L63
- Elvis et al. (2004) Elvis, M., Risaliti, G., Nicastro, F., Miller, J. M., Fiore, F., & Puccetti, S. 2004, ApJ, 615, L25
- Fruscione et al. (2005) Fruscione, A., Greenhill, L. J., Filippenko, A. V., Moran, J. M., Herrnstein, J. R., & Galle, E. 2005, ApJ, 624, 103
- Fukazawa et al. (2001) Fukazawa, Y., Iyomoto, N., Kubota, A., Matsumoto, Y., & Makishima, K. 2001, A&A, 374, 73
- George and Fabian (1991) George, I. M., & Fabian, A. C. 1991, MNRAS, 249, 352
- Ghez et al. (2005) Ghez, A. M., Salim, S., Hornstein, S. D., Tanner, A., Lu, J. R., Morris, M., Becklin, E. E., & Duchêne, G. 2005, ApJ, 620, 744
- Ghisellini, Haardt, and Matt (1994) Ghisellini, G., Haardt, F., & Matt, G. 1994, MNRAS, 267, 743
- Greenhill et al. (1995) Greenhill, L. J., Jiang, D. R., Moran, J. M., Reid, M. J., Lo, K. Y., & Claussen, M. J. 1995, ApJ, 440, 619
- Greenhill et al. (1997) Greenhill, L. J., Moran, J. M., & Herrnstein, J. R. 1997, ApJL, 481, L23
- Greenhill & Gwinn (1997) Greenhill, L. J., & Gwinn, C. 1997, Ap&SS, 248, 261
- Greenhill et al. (2003) Greenhill, L. J., et al. 2003, ApJ, 590, 162
- Guainazzi et al. (2005) Guainazzi, M., Fabian, A. C., Iwasawa, K., Matt, G., & Fiore, F. 2005, MNRAS, 356, 295
- Hagiwara et al. (2003) Hagiwara, Y., Diamond, P., Miyoshi, M., Rovilos, E., & Baan, W. 2003, MNRAS, 344, L53
- Hagiwara et al. (2001) Hagiwara, Y., Henkel, C., Menten, K. & Nakai, N. 2001, ApJ, 560, 37
- Henkel et al. (2005) Henkel, C., et al. 2005, Ap&SS, 295, 107
- Illarionov et al. (1979) Illarionov, A., Kallman, T., McCray, R., & Ross, R. 1979, ApJ, 228, 279
- Ishihara, Y., et al. (2001) Ishihara, Y., Nakai, N., Iyomoto, N., Makishima, K., Diamond, P., & Hall, P. 2001, PASJ, 53, 215
- Iwasawa, Maloney, and Fabian (2002) Iwasawa, K., Maloney, P. R., & Fabian, A. C. 2002, MNRAS, 336, L71
- Iyomoto et al. (2001) Iyomoto, N., Fukazawa, Y., Nakai, N., & Ishihara, Y. 2001, ApJ, 561, L69
- (28) Kondratko, P., Greenhill, L., & Moran, J. 2005, ApJ, 618, 681
- (29) Kondratko, P. T., et al. 2005, ApJ, submitted
- (30) Kondratko, P. T., Greenhill, L. J., Moran, J. M. 2005, ApJ, in prep
- Krolik, Madau, & Zycki (1994) Krolik, J., Madau, P., & Życki, P. 1994, ApJ, 420, L57
- Kumar (1999) Kumar, P. 1999, ApJ, 519, 599
- Lasota et al. (1996) Lasota, J.-P., Abramowicz, M., Chen, X., Krolik, J., Narayan, R., & Yi, I. 1996, ApJ, 462, 142
- Levenson et al. (2002) Levenson, N. A., Krolik, J. H., Życki, P. T., Heckman, T. M., Weaver, K. A., Awaki, H., & Terashima, Y. 2002, ApJ, 573, L81
- Lodato & Bertin (2004) Lodato, G., & Bertin, G. 2003, A&A, 398, 517
- Madejski et al. (2000) Madejski, G., Życki, P., Done, C., Valinia, A., Blanco, P., Rothschild, R., & Turek, B. 2000, ApJ, 535, L87
- Magdziarz and Zdziarski (1995) Magdziarz, P., & Zdziarski, A. 1995, MNRAS, 273, 837
- Matt, Brandt, and Fabian (1996) Matt, G., Brandt, W. N., & Fabian, A. C. 1996, MNRAS, 280, 823
- Matt, Fabian, and Reynolds (1997) Matt, G., Fabian, A. C. & Reynolds, C. S. 1997, MNRAS, 289, 175
- Matt et al. (1997) Matt, G., et al. 1997, A&A, 325, L13
- Matt et al. (1999) Matt, G., et al. 1999, A&A, 341, L39
- Matt (2002) Matt, G. 2002, MNRAS, 337, 147
- Matt et al. (2004) Matt, G., Bianchi, S., Guainazzi, M., & Molendi, S. 2004, A&A, 414, 155
- McHardy et al. (1995) McHardy, I. M., Green, A. R., Done, C., Puchnarewicz, E. M., Mason, K. O., Branduardi-Raymont, G., & Jones, M. H. 1995, MNRAS, 273, 549
- Molendi et al. (2003) Molendi, S., Bianchi, S., & Matt, G. 2003, MNRAS, 343, L1
- Myioshi, M., et al. (1995) Miyoshi, M., Moran, J., Herrnstein, J., Greenhill, L., Nakai, N., Diamond, P. & Inoue, M. 1995, Nature, 373, 127
- Neufeld, D. et al. (1994) Neufeld, D., Maloney, P., & Conger, S. 1994, ApJ, 436, L127
- Ogle et al. (2003) Ogle, P. M., Brookings, T., Canizares, C. R., Lee, J. C., & Marshall, H. L. 2003, A&A, 402, 849
- Pietsch et al. (2001) Pietsch, W., et al. 2001, A&A, 365, L174
- Reynolds et al. (1994) Reynolds, C. S., Fabian, A. C., Makishima, K., Fukazawa, Y., & Tamura, T. 1994, MNRAS, 268, L55
- Risaliti et al. (1999) Risaliti, G., Maiolino, R., & Salvati, M. 1999, ApJ, 522, 157
- Sako et al. (2000) Sako, M., Kahn, S., Paerels, F., and Liedhal, D. 2000, ApJ, 543, L115
- Schurch et al. (2002) Schurch N. J., Roberts T. P., & Warwick R. S. 2002, MNRAS, 335, 241
- Schödel et al. (2003) Schödel, R., Ott, T., Genzel, R., Eckart, A., Mouawad, N., & Alexander, T. 2003, ApJ, 596, 1015
- Strickland and Stevens (2000) Strickland, D. K., & Stevens, I. 2000, MNRAS, 314, 511
- Zycki and Czerny (1994) Życki, P. T., & Czerny, B. 1994, MNRAS, 266, 653