The high-energy gamma-ray light curve of PSR B1259 63
Abstract
The high-energy gamma-ray light curve of the binary system PSR B1259 63, is computed using the approach that successfully predicted the spectrum at periastron. The simultaneous INTEGRAL and H.E.S.S. spectra taken 16 days after periastron currently permit both a model with dominant radiative losses, high pulsar wind Lorentz factor and modest efficiency as well as one with dominant adiabatic losses, a slower wind and higher efficiency. In this paper we shown how the long-term light curve may help to lift this degeneracy.
Keywords:
Pulsars; X-ray binaries:
97.60.Gb; 97.80.Jp1 Introduction
Observations using the H.E.S.S. array of imaging Čerenkov telescopes around and after the periastron passage in early 2004 detected a strong signal in the TeV range Schlenker et al. (2005); Aharonian, F., et al., HESS Collaboration (2005). The measured spectrum is in excellent agreement in both slope and absolute normalisation with that predicted by a model in which the post-shock pulsar wind electrons have a simple, single power-law distribution Kirk et al. (1999). Significant night-to-night fluctuations in the TeV light curve as well as an overall decrease on the timescale of months were also observed by H.E.S.S., possibly correlated with variations in the unpulsed radio emission Johnston et al. (2005). Whereas the short timescale fluctuations, especially close to periastron, can plausibly be attributed to departures from spherical symmetry in the structure of the pulsar wind or the Be star wind, the long term light curve may help constrain the physics of the emission region.
In this paper, we present preliminary results on the light curves obtained from an extended version of the model of Ref. (Kirk et al., 1999). Injection of a double power-law electron spectrum, similar to that thought to be injected into the Crab Nebula by its central pulsar Gallant et al. (2002) is included, as is the transition from radiative to adiabatic loss mechanisms as the separation of the stars increases. The spectral properties of these models are described by Kirk et al. (2005).
2 The model
The pulsar wind that fuels the Crab Nebula injects into it relativistic electrons and positrons (and possibly ions) whose energy distribution can be approximated as a double power-law: , for and for (Lyubarsky, 2003). The high-energy index is determined by the slope of the X-ray spectrum of the Crab Nebula: , in agreement with theories of first-order Fermi acceleration at relativistic shocks Kirk et al. (2000); Achterberg et al. (2001). The low energy index follows from the slope of the radio to infra-red spectrum: . With these values, most particles are concentrated around the lower cut-off at , whereas most of the energy is injected in electrons of Lorentz factor . In the Crab, , and . The resulting synchrotron spectrum contains two breaks, one due to cooling and one intrinsic to the injected spectrum (at Hz and Hz in the Crab), as well as upper and lower cut-offs. If this injection spectrum is produced at the termination shock front, and if the cold upstream flow is dominated by the kinetic energy flux in electron-positron pairs, then the Lorentz factor of the wind is . In the following we adopt this injection model.
In PSR B1259 63, relativistic electrons and positrons in the shocked pulsar wind suffer adiabatic losses as the plasma expands away from the shock front, as well as radiative losses by synchrotron radiation and inverse Compton scatterings, primarily of the ultra-violet photons from the Be star. These loss processes have different energy dependences, which lead to differences in the resulting distribution function. The emitted radiation is a combination of synchrotron radiation in a uniform magnetic field and inverse Compton scattering of ultra-violet photons from the Be star. On its way from the pulsar system to the observer the inverse-Compton emission is partially reabsorbed by pair production on the stellar photons (Kirk et al., 1999). Two sets of models were constructed in Ref. (Kirk et al., 1999): one for purely adiabatic and one for purely radiative losses. Both were calibrated using the observed X-ray synchrotron emission, and provided accurate predictions of the TeV spectrum subsequently detected just before periastron. However, the two models imply quite different injection spectra.
As the pulsar moves away from the Be star, both the target radiation field and the magnetic field where the winds interact decrease, along with the gas pressure. For the toroidal field structure expected in a pulsar wind, the synchrotron loss rate scales with the inverse square of the separation of the stars. Thus, the ratio of the energy densities of magnetic field and target radiation remain constant, so that, in the absence of Klein-Nishina effects, the ratio of synchrotron to inverse Compton radiation should not vary with binary phase. However, if the expansion time scales linearly with the separation of the stars, adiabatic losses become more important with respect to radiative losses as the stars move apart. In the models used here and in Ref (Kirk et al., 2005), we account for this in the kinetic equation describing the electron distribution by switching between a radiative and an adiabatic loss term at the Lorentz factor where the loss rates coincide. The losses themselves are fixed as functions of binary phase, once the magnetic field strength in the emission region, and the adiabatic loss time scale are given at periastron.
| Model: | Efficiency | ||||||
|---|---|---|---|---|---|---|---|
| A1 | G | % | 15 | ||||
| A2 | G | % | 30 | ||||
| B | G | % | 0.5 |
3 Results
Modelling the spectrum and light curve of the high-energy emission during the 2004 periastron passage is made difficult by the scarcity of simultaneous TeV and X-ray data sets. The only ones currently available are the X-ray/soft gamma-ray spectrum detected by INTEGRAL between 14 and 17 days after periastron passage Shaw et al. (2004) and the March 2004 observations by H.E.S.S. Aharonian, F., et al., HESS Collaboration (2005). Kirk et al. (2005) showed that these data are not sufficient to determine the dominant loss mechanism and discussed two examples. In their first (Model A) the energy losses suffered by those particles that emit TeV radiation at around periastron are dominated by the radiation processes: inverse Compton scattering and synchrotron radiation. In their second (Model B) it is assumed that the relativistic electrons rapidly move out of the zone where the radiation is emitted. The spectral fit is in each case good.
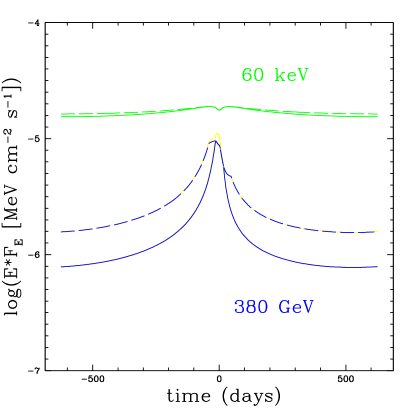
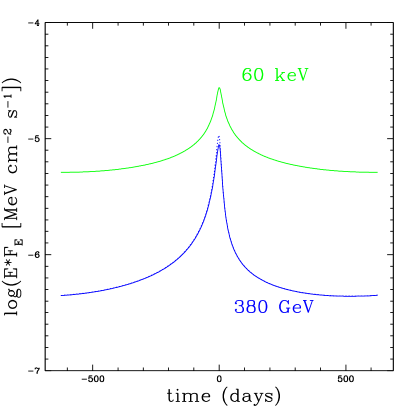
In Fig. 1 we present results for the light curves over the entire binary period for three models, whose parameters are given in Table 1. Model A1 and Model B correspond exactly to the two models discussed in Ref. (Kirk et al., 2005). Model A2 differs from A1 by having double the adiabatic loss time-scale. This makes little difference to the hard X-ray and TeV spectra around periastron. However, it changes the long term light curve considerably.
Provided radiative losses determine the electron spectrum, the synchrotron light curve remains almost constant. This is because the emission region acts as a calorimeter; even though the loss rate decreases away from periastron, the energy radiated remains almost the same. This behaviour is evident in the keV light curves of Models A1 and A2, shown in the left hand panel of Fig. 1. In the case of GeV emission, the time-dependence in the absence of adiabatic losses arises from the angle dependence of the scattering cross section. Because the target photons form an almost mono-directional beam, the scattering angle needed to deflect a photon into the direction of the observer is a function of binary phase. As discussed by Kirk et al. (1999), this leads to a characteristic time dependence that is asymmetric about periastron. However, the amplitude of the variation is at most a factor of two.
On the other hand, when adiabatic losses dominate, the energy radiated by an electron in traversing the emission region is proportional to the ratio of the radiative to the adiabatic loss rates. Here we assume that the adiabatic loss time scales linearly with the separation of the stars and the radiative loss time scales quadratically. This implies that adiabatic losses become relatively more important as the stars move away from each other. As a result, the light curve shows a strong peak at periastron, as can be seen in the right-hand panel of Fig. 1. The ratio of maximum to minimum flux density in this model is roughly a factor of 25, corresponding approximately to the ratio of the apastron to the periastron separation () multiplied by an angle dependent factor . The GeV light curves in the left-hand panel show the effects of increasing the adiabatic loss time-scale by a factor of two. The emission in Model A1 makes the transition from radiative to adiabatic losses already at 17 days after periastron. As a result, the intensity falls off sharply, and the long-term light curve is not dissimilar to that of Model B. On the other hand, Model A2, in which the adiabatic loss time-scale is twice as long, remains dominated by radiative losses until roughly 50 days after periastron. (This transition is unphysically sharp in our model.) The resulting ratio of maximum to minimum flux density in this model is only a factor of six. Although we do not present here a detailed comparison with the data, it is clear that the H.E.S.S. light curve (Schlenker et al., 2005; Aharonian, F., et al., HESS Collaboration, 2005) favours Models B and A1 over Model A2.
References
- Schlenker et al. (2005) S. Schlenker, M. Beilicke, B. Khelifi, C. Masterson, M. de Naurois, L. Rolland, and Hess Collaboration, “Discovery of the Binary Pulsar PSR B1259-63 in VHE Gamma Rays,” in AIP Conf. Proc. 745: High Energy Gamma-Ray Astronomy, 2005, pp. 341–346.
- Aharonian, F., et al., HESS Collaboration (2005) Aharonian, F., et al., HESS Collaboration, A&A in press (2005).
- Kirk et al. (1999) J. G. Kirk, L. Ball, and O. Skjaeraasen, Astroparticle Physics 10, 31–45 (1999).
- Johnston et al. (2005) S. Johnston, L. Ball, N. Wang, and R. N. Manchester, MNRAS 358, 1069–1075 (2005).
- Gallant et al. (2002) Y. A. Gallant, E. van der Swaluw, J. G. Kirk, and A. Achterberg, “Modeling Plerion Spectra and their Evolution,” in ASP Conf. Ser. 271: Neutron Stars in Supernova Remnants, 2002, pp. 99–104.
- Kirk et al. (2005) J. G. Kirk, L. Ball, and S. Johnston, “Modelling the gamma-ray emission from PSR B1259 -63,” in 29th International Cosmic Ray Conference, 2005, pp. OG2.2.101–104.
- Lyubarsky (2003) Y. E. Lyubarsky, MNRAS 345, 153–160 (2003).
- Kirk et al. (2000) J. G. Kirk, A. W. Guthmann, Y. A. Gallant, and A. Achterberg, ApJ 542, 235–242 (2000).
- Achterberg et al. (2001) A. Achterberg, Y. A. Gallant, J. G. Kirk, and A. W. Guthmann, MNRAS 328, 393–408 (2001).
- Shaw et al. (2004) S. E. Shaw, M. Chernyakova, J. Rodriguez, R. Walter, P. Kretschmar, and S. Mereghetti, A&A 426, L33–L36 (2004).