T. Di Salvo
11email: disalvo@fisica.unipa.it 22institutetext: Università degli Studi di Cagliari, Dipartimento di Fisica, SP Monserrato-Sestu, KM 0.7, 09042 Monserrato, Italy
High Resolution and Broad Band Spectra of Low Mass X-ray Binaries: A Comparison between Black Holes and Neutron Stars
Abstract
A common question about compact objects in high energy astrophysics is whether it is possible to distinguish black hole from neutron star systems with some other property that is not the mass of the compact object. Up to now a few characteristics have been found which are typical of neutron stars (like quasi periodic oscillations at kHz frequencies or type-I X-ray bursts), but in many respects black hole and neutron star systems show very similar behaviors. We present here a spectral study of low mass X-ray binaries containing neutron stars and show that these systems have spectral characteristics that are very similar to what is found for black hole systems. This implies that it is unlikely we can distinguish between black holes and neutron stars from their X-ray spectra, except for the fact that black hole systems show sometimes a more extreme behavior with respect to neutron star systems.
keywords:
accretion, accretion disks – stars: individual: Sco X-1, 4U 1705–44 — stars: neutron — X-rays: stars — X-rays: binaries — X-rays: general1 Introduction
About 10 strong X-ray sources have been established to be in binary systems with objects more massive than the maximum mass for a neutron star (NS, , e.g. Kalogera & Baym 1996): these are black hole (BH) candidates. Unfortunately for many X-ray binary systems the mass determination is difficult or impossible, because the measurement of the mass function is only possible when the optical counterpart is observed. Thus some other methods have been proposed to identify systems containing BHs using X-ray observational properties. The discovery of strong rapid variability of the X-ray flux in the BH X-ray binary Cyg X–1 (Oda et al. 1971) led to the idea that such variability could be considered a signature of the presence of a BH. On the basis of this idea the X-ray binary Cir X–1 was long considered a BH candidate. However, accreting NS can also show rapid variability (the radius of a NS is indeed a few Schwarzschild radii), and in fact Cir X–1 is now believed to contain a NS because it showed type-I X-ray bursts (Tennant et al. 1986).
Other arguments are based on the X-ray spectra of accreting BHs. Galactic BH candidates exhibit at least two spectral states, a ‘soft/high state’ dominated by thermal emission at keV, probably from the accretion disk, together with a steep power law tail (with photon index ), and a ‘hard/low state’ where the accretion disk emission is orders of magnitude less ( keV) and the power-law tail is much harder (with photon index ), so it dominates the energy output of the source. This hard power law shows an exponential cutoff at temperatures of keV and is generally interpreted as due to thermal Comptonization of soft photons in a hot electron gas close to the compact object.
It has been proposed that, in the framework of thermal Comptonization models, the electron temperature of the scattering cloud () should be systematically lower for NSs than for BHs: keV versus keV, respectively (Tavani & Barret 1997; Churazov et al. 1997). This should be a consequence of the additional cooling provided by the NS surface, which produces soft X-ray photons and regulates the maximum temperature achievable in these systems (Kluzniak 1993; Sunyaev & Titarchuk 1989). However, the discovery of some low mass X-ray binaries (LMXBs) containing NS with hard X-ray spectra (see e.g. Barret et al. 1991; Piraino et al. 1999), extending to energies above 200 keV has severely weakened this criterion, although more complicated broad band approaches have been proposed (e.g. Barret, McClintock & Grindlay 1996, see below).
Unlike in the hard state, most of the luminosity in the soft state is due to the soft, blackbody-like component. Recently, however, broad-band data have shown that a few percent of the total X-ray luminosity is emitted in the hard X-rays/soft -rays range. In this range, the spectra of BH X-ray binaries in the soft state can be well represented by a steep power-law, with photon index , which does not have an observable break, at least, up to energies of the order of (Phlips et al. 1996; Grove et al. 1998). Although thermal Comptonization models have been successful in describing the hard X-ray spectra of BH X-ray binaries in the hard states, they cannot easily explain the unbroken power law and the associated -ray emission observed in the soft states of BH binaries. For this reason the steep power-law was interpreted in terms of Comptonization in a converging bulk flow in the vicinity of the BH (e.g. Ebisawa, Titarchuk, & Chakrabarti 1996). In fact, close to the event horizon, the strong gravitational field is expected to dominate the pressure forces, and this should give a free fall of the accreting material into the BH. The inverse Comptonization of low energy photons from fast-moving electrons should produce the steep power law, with photon index mostly determined by the mass accretion rate, observed in the soft states of BH binaries (Titarchuk et al. 1997; see also Titarchuk & Zannias 1998). On the contrary, for other compact objects the pressure forces become dominant close to their surface, and thus a free fall state should be absent.
According to this model, therefore, the presence of this steep power law should be an observational signature of a BH, because in NS systems the effect of a radial bulk motion should be suppressed by the radiation pressure from the NS surface (Titarchuk & Zannias 1998). However, the observation of hard power-law components in bright NS systems contradicts this expectation (see Di Salvo & Stella 2002 for a review, see also § 2), and suggests to prefer models which do not rely on the presence of an event horizon in the system.
Other methods have been proposed to distinguish between NSs and BHs. In particular, Barret et al. (1996) proposed a luminosity criterion. They compared the 1-20 keV luminosity to the 20-200 keV luminosity for all BHs (with mass function estimates indicating a mass of the compact object larger than ) and all NSs of the atoll class (the so-called X-ray bursters) detected up to at least 100 keV. They find a clear distinction in luminosity between the X-ray bursters, which lie in the so-called X-ray burster box, and the BHs, which are found outside. However, the distinction between NSs and BHs is no more evident when the Z sources, in which a hard tail has been detected, are included in the diagram (see Di Salvo et al. 2001).
Another important spectral characteristics of BH candidates is that they often show the presence of broad and skewed features at the energy of the iron K-shell fluorescence line and edge. In fact, many (both stellar mass and supermassive) BHs show very broad emission lines at around 6 keV, which suggest these are produced very close to a fast spinning (Kerr) BH (see e.g. MCG–6–30–15, Fabian et al. 2002; GX 339–4, Miller et al. 2004; XTE J1650–500, Miniutti et al. 2004). On the other hand, not much is known about iron K-shell emission in LMXBs containing NS. These systems often show the presence of broad iron lines. However, such studies are performed mainly with low-energy resolution instruments, and need to be confirmed by a high-resolution spectroscopy.
We present here a spectral study of a sample of LMXBs containing NS, both in a broad band X-ray range with INTEGRAL and RXTE, and with high energy resolution using the HETG on board of Chandra. In particular we show in § 3 the presence of hard X-ray emission in Sco X-1, which does not require a high energy cutoff up to 200 keV strongly suggesting a non-thermal origin of this component. We also present in § 4 high resolution spectra of 4U 1705–44, which shows an intrinsically broad iron line probably produced in the innermost rim of the accretion disk. In the next section, § 2, we give an introduction on the characteristics in the X-ray range of LMXBs hosting an old, low magnetized, accreting NS.
2 Neutron star low mass X-ray binary basics
The modern classification of LMXBs relies upon the branching displayed by individual sources in the X-ray color-color diagram (CD) assembled by using the sources’ count rate over a ”classical” X-ray energy range (typically 2-20 keV). This classification has proven very successful in relating the spectral and time variability properties (see e.g. Hasinger & van der Klis 1989; for a review see van der Klis 2000) depending on the pattern described by each source in the X-ray CD. It comprises a Z-class (source luminosities close to the Eddington luminosity, ) and an atoll-class (luminosities of ). Most atolls emit Type-I X-ray bursts, i.e. thermonuclear flashes in the layers of freshly accreted material onto the NS surface; only two Z-sources are (somewhat peculiar) X-ray bursters. Considerable evidence has been found that the mass accretion rate (but not necessarily the X-ray luminosity) of individual Z-sources increases from the top left to the bottom right of the Z-pattern (e.g. Hasinger et al. 1990), i.e. along the so called horizontal, normal and flaring branches (hereafter HB, NB and FB, respectively). Similarly in atoll sources the accretion rate increases from the so-called island to the top of the upper-banana branch.
Hard X-ray components extending up to energies of several hundred keV have been revealed in about 20 NS LMXBs of the atoll class. In these systems the power law-like component, with typical slopes of , is followed by an exponential cutoff, the energy of which is often in between and many tens of keV. This component is interpreted in terms of unsaturated thermal Comptonisation. There are instances in which no evidence for a cutoff is found up to keV. This is the so called ”hard state” of atoll sources, and is similar to the hard state of BH binaries. There are sources that appear to spend most of the time in this state (e.g. 4U 0614+091, Piraino et al. 1999, and references therein). In others a gradual transition from the soft to the hard state has been observed in response to a decrease of the source X-ray luminosity and/or the source drifting from the banana branch to the island state. This transition is often modelled in terms of a gradual decrease of the electron temperature of the Comptonising region.
As first noted by van Paradijs & van der Klis (1994), there is a clear trend for the spectral hardness of these sources (and accreting X-ray sources in general) over the 13-25 and 40-80 keV energy ranges to be higher for lower X-ray luminosity. This is in agreement with the observation that Z-sources usually show much softer X-ray spectra with characteristic temperatures of 3–6 keV. However, recent broad band studies, mainly performed with BeppoSAX (0.1–200 keV) and RXTE (2–200 keV), have shown that many Z-sources display variable hard, power-law shaped components, dominating their spectra above keV. Hard emission in Z-source spectra were occasionally detected in the past. The first detection was in the spectrum of Sco X–1; beside the main X–ray component (equivalent bremsstrahlung temperature of keV) Peterson & Jacobson (1966) found a hard component dominating the spectrum above 40 keV. The latter component was observed to vary by as much as a factor of 3. More recently the presence of a variable hard tail in Sco X–1 was confirmed by OSSE and RXTE observations (Strickman & Barret 2000; D’Amico et al. 2001). A hard X-ray emission was also found in the Z-sources GX 17+2 (Di Salvo et al. 2000), GX 349+2 (Di Salvo et al. 2001) and Cyg X-2 (Di Salvo et al. 2002), as well as the peculiar bright LMXB Cir X–1 (Iaria et al. 2001, 2002) and during type II bursts from the Rapid Burster (Masetti et al. 2000). The fact that a similar hard component has been observed in several Z sources indicates that this is probably a common feature of these sources. This hard component can be fitted by a power law, with photon index in the range 1.9–3.3, contributing up to 10% of the source bolometric luminosity. The presence of the hard component in Z sources is in some cases related to the source state or its position in the CD. This was unambiguously shown for the first time by the BeppoSAX observation of GX 17+2 (Di Salvo et al. 2000), where the hard tail was observed to vary systematically with the position of the source in the CD. In particular the hard component (a power-law with photon index of ) showed the strongest intensity in the HB of its CD; a factor of decrease was observed when the source moved from the HB to the NB, i.e. from low to high inferred mass accretion rate.
However, the origin of this hard component is still poorly understood. While in most cases the hard component becomes weaker at higher accretion rates, HEXTE observations of Sco X–1 showed a hard power-law tail in 5 out of 16 observations, without any clear correlation with the position in the CD (D’Amico et al. 2001). Also, the thermal vs. non-thermal nature of this component remains to be addressed, yielding important information on the production mechanism. We report in the next section on hard X-ray observations of Sco X-1 performed simultaneously with INTEGRAL and RXTE. The INTEGRAL spectrum shows with high statistical significance the presence of a hard (power-law) component, without any clear exponential cutoff up to keV. Contrary to what is found by D’Amico et al. (2001), the intensity of this component seems to be correlated with the source position in the CD, showing a phenomenology that is similar to GX 17+2.
As already mentioned, another important common feature observed in the spectra of X-ray binaries, both in systems containing BHs and in systems hosting an old accreting NS, is given by the discrete features from the iron K-shell: broad emission lines (FWHM up to keV) at energies in the range 6.4 – 6.7 keV have been often observed. These lines are identified with the K radiative transitions of iron at different ionization stages. Sometimes an iron absorption edge at energies keV has been detected. These features are powerful tools to investigate the structure of the accretion flow close to the central source; in particular, important information can be obtained from detailed spectroscopy of the iron K emission line and absorption edge, since these are determined by the ionization stage, geometry, and velocity field of the reprocessing plasma.
To explain the large width of these lines it has been proposed that they originate from emission reprocessed by the accretion disc surface illuminated by the primary Comptonized spectrum (Fabian et al. 1989). In this model, the combination of relativistic Doppler effects arising from the high orbital velocities and gravitational effects due to the strong field in the vicinity of the NS smears the reflected features. Therefore the line will have a characteristically broad profile, the detailed shape of which depends on the inclination and on how deep the accretion disk extends into the NS potential (e.g. Fabian et al. 1989). In the case of some BH systems, these features are so broad that they require an almost maximally spinning (Kerr) BH.
An alternative location of the line emitting region is the inner part of the so-called Accretion Disk Corona (ADC), probably formed by evaporation of the outer layers of the disk illuminated by the emission of the central object (e.g. White & Holt 1982). In this case the width of the line is explained by thermal Comptonization of the line photons in the ADC. This produces a genuinely broad Gaussian distribution of line photons, with , where is the centroid energy of the iron line and is the electron temperature in the ADC (see Kallman & White 1989; Brandt & Matt 1994 for more detailed calculations). This mechanism can explain the width of the iron line for temperatures of the emitting region of few keV. The presence of several unresolved components, which can eventually be resolved by the high resolution X-ray instruments on board Chandra and XMM-Newton, can also contribute to broaden the line.
In § 4 we present the results of a Chandra observation of the atoll source 4U 1705–44; we selected this source for a Chandra observation because a broad (1.1 keV FWHM) iron emission line at 6.5 keV has been previously reported (White et al. 1986; Barret & Olive 2002). One of the goals of our Chandra observation was to study the iron line profile to discriminate among the various models that have been proposed to explain the large line width. The Chandra/HETGS observation demonstrates that the iron line is intrinsically broad (1.2 keV FWHM).
3 Scorpius X-1 with INTEGRAL: non-Thermal Hard Emission?
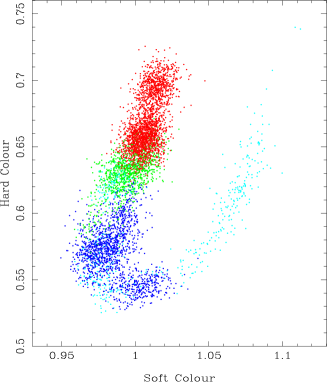
To study the hard X-ray emission in the brightest of these sources, as well as its correlation with other source properties (such as radio emission and fast timing variability) we have performed a campaign of observations of Sco X–1 with INTEGRAL and RXTE. Part of these observations were also performed simultaneously with radio VLBI observations (which will be discussed elsewhere). Sco X-1 was observed during two complete INTEGRAL revolutions on 2003 July 30 – August 1 and 2003 August 11 – 13, simultaneously with RXTE (Di Salvo et al., in preparation). The X-ray CD of Sco X-1 during the INTEGRAL observations is shown in Figure 1 (left panel). During each of the two observations the source described a fairly complete Z-track in the CD.
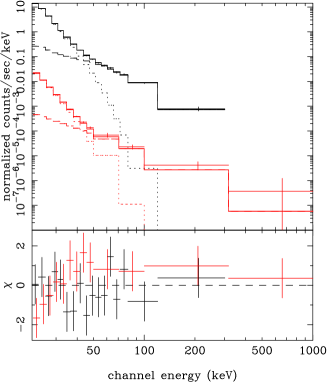
In order to check for the presence of the hard tail in our data, we first analysed the INTEGRAL (IBIS/ISGRI and SPI, energy band 20 keV – 1 MeV) spectrum integrated over the whole observation. Similar to what has been done for other LMXBs of the Z-class, we fitted the INTEGRAL spectrum with the Comptonization model compTT (Titarchuk 1994). This model gives a good fit of the soft part of the Sco X-1 spectrum up to keV. Above this energy, a hard excess is clearly visible in the residuals independent of the particular Comptonization model used to fit the soft part of the spectrum. The fit is significantly improved by adding to the compTT model a power-law with photon index (this gives a reduction of the /dof from 892/27 to 42/25). We tested the presence of a thermal cutoff in the hard power-law; substituting the power law with a cutoff power-law does not improve the fit significantly (the latter model gives a /dof = 41/24), and the temperature of the exponential cutoff is keV ( confidence level). The best-fit parameters for the ISGRI (20 – 300 keV) and SPI (20 keV – 1 MeV) spectra are reported in Table 1; data and residuals with respect to the best fit model are shown in Figure 1 (right panel).
| Parameter | HB/UNB | NB | NB/FB | FB | Total |
|---|---|---|---|---|---|
| (keV) | (frozen) | (frozen) | (frozen) | (frozen) | (frozen) |
| (keV) | |||||
| PhoIndex | (frozen) | ||||
| (keV) | – | ||||
| Flux (20–40) | |||||
| Flux (40–200) | |||||
The model consists of a Comptonized spectrum modeled by comptt, and a cutoff power law. is the temperature of the seed photon (Wien) spectrum, the electron temperature and the optical depth in a spherical geometry. Fluxes are given in units of erg cm-2 s-1 in the range 20 – 40 keV and in units of erg cm-2 s-1 in the range 40 – 200 keV. All the uncertainties are calculated at 90% confidence level.
To look for variability in the hard component with the spectral state of the source, as measured by its position in the X-ray CD, we divided the Z-track in the CD of Sco X-1 into four parts corresponding to the HB/upper-NB, the NB, the NB/FB vertex, and the FB, respectively. We therefore extracted INTEGRAL/ISGRI spectra for each of the time intervals mentioned above, resulting in four CD resolved spectra. Unfortunately there was no superposition between RXTE and INTEGRAL data in the FB during the first part of the observation). The INTEGRAL/ISGRI exposure times for the four intervals were 52.4 ks, 45.5 ks, 60.6 ks and 6 ks. We fitted each of this spectra with comptt and a cutoff power law. This model gave a good fit of the first three spectra, with little variability in the spectral parameters (see Table 1). For each of these spectra, the hard power law component was required in order to fit the data. Remarkably the FB spectrum did not require a power law component and could be fitted with a simple Comptonization model. Including the power law in the spectral fit of the FB spectrum, with the photon index fixed at 2.7, a good fit requires a decrease of the normalization of the power law component by a factor at least 5 with respect to the average spectrum.
4 A broad iron line in the Chandra/HETG spectrum of 4U 1705–44
4U 1705–44 was observed using the High-Energy Transmission Grating Spectrometer (HETGS) on board of Chandra starting on 2001 July 1 (see Di Salvo et al. 2005 for details). We fit the HEG first order spectra of 4U 1705–44 to a continuum model. The best fit model consists of the Comptonization model comptt (Titarchuk 1994), modified by absorption from neutral matter, parametrized by the equivalent hydrogen column , which gives a of . This model also includes an overabundance of Si by a factor with respect to Solar abundances to fit a highly significant absorption edge at keV (the addition of this parameter reduces the by at the expense of 1 degree of freedom). Note that we cannot exclude that this feature may be due to the presence of Si in the CCDs, and therefore this overabundance is not discussed further. Finally, in all the fits we include an instrumental feature at keV (usually present in the HETG spectra of bright sources, see Miller et al. 2002) which is fitted by an inverse edge (with ).
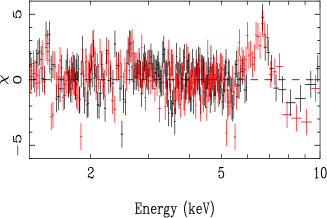
Residuals in units of with respect to the continuum model described above are shown in Figure 2 (right panel); several discrete features are still clearly visible in the residuals with respect to this continuum model, at , , keV, and, particularly, in the 6–7 keV range, where the K iron emission line is expected. From these residuals it is apparent that the iron line is intrinsically broad and shows a complex profile.
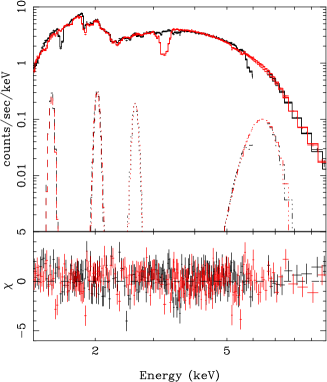
The addition of a broad ( keV) Gaussian line centered at 6.5 keV proves necessary, giving for the addition of three parameters. We also added three narrow emission lines to fit the other low energy residuals mentioned above. The addition of Gaussian emission lines at , , keV gives a reduction of the by 27, 29, and 32 units, respectively, for the addition of three parameters. The errors in the normalizations of these features give a detection at about confidence level. This is not a highly significant detection, and needs a confirmation with future observations. However, the fact that the energies of these features are close to the energies of Ly transitions of H-like ionization stages of the most abundant ions emitting in the observed range (that are Mg XII, Si XIV, and S XVI, respectively) adds further confidence that these lines may be real. Data and residuals in units of with respect to this best-fit model are shown in Figure 2 (left panel), and the best fit model is reported in Table 2.
In analogy with what is done for BH spectra, we also try to fit the broad emission line at keV with the line profile expected from a thin Keplerian accretion disk. Substituting the Gaussian line with the diskline model, we obtain an equivalently good fit. The line best fit parameters for the diskline model are given in Table 3. Therefore, the iron line observed in 4U 1705–44 is compatible with a relativistic line produced by reflection in a cold accretion disk. In this case, we estimate that the required inner radius of the disk is or km for a NS. Note that the quite small inner radius of the disk inferred from this model is in agreement with the quite soft X-ray spectrum of 4U 1705–44 during the Chandra observation, which would probably place the source in the banana state of its X-ray CD. In this model, the inclination of the disk with respect to the line of sight is constrained in the range .
| Parameter | Value |
|---|---|
| Si / Si⊙ | |
| (keV) | |
| (keV) | |
| (keV) | |
| (keV) | |
| IFe ( cm-2 s-1) | |
| EWFe (eV) | |
| Flux (1.3–10 keV, erg cm-2 s-1) | |
| Final |
The model consists of a Comptonized spectrum modeled by comptt, and four Gaussian emission lines. is the temperature of the seed photon (Wien) spectrum, the electron temperature and the optical depth in a spherical geometry. For the discrete features, is the intensity of the line and is the corresponding equivalent width. For the parameters of the other discrete features included in the fit see Di Salvo et al. (2005). Uncertainties are given at 90% confidence level.
| Parameter | Value |
|---|---|
| Energy (keV) | |
| Rin (Rg) | |
| Rout (Rg) | |
| Inclination (deg) | |
| Index | |
| I ( cm-2 s-1) | |
| Final |
The other best fit parameters are compatible with those reported in Table 1. Index refers to the power-law dependence of emissivity which scales as . Uncertainties are 90% confidence level for a single parameter of interest.
5 Conclusions
In this paper we present strong evidences of tight analogies between BH and NS X-ray spectra. In analogy with the steep and hard power-law components detected in some soft states (i.e. intermediate and very high) of BH X-ray binaries, we show here that most Z sources, which are always found in a soft state, show similar components. In particular, the INTEGRAL observation of Sco X-1 shows that a steep power law (with photon index 2.7) dominates the source spectrum above keV, which does not show evidence of a high energy cutoff up to 200 keV. The presence of such a hot plasma in a system which emits most of the energy as soft X-ray photons is unlikely, because of the strong Compton cooling expected. Therefore we prefer the interpretation of the hard power law as non-thermal Comptonization, probably on fast moving electrons that are part of an outflow or a jet. We have also presented the first detection in a NS LMXB, 4U 1705–44, of an intrinsically broad emission feature at the energy of the iron K-shell fluorescence line, very similar to the broad iron lines detected in some (stellar-mass and supermassive) BHs. We show that the feature observed by Chandra in 4U 1705–44 is probably originating by reflection of the primary spectrum in a cold accretion disk. In this case, the inner radius of the disk required to explain the width of the line is very close to the NS surface (about 1.5 NS radii). In this sense, the behavior of BH candidates can be different from (more extreme than) the behavior of NS X-ray binaries, since the iron line observed in BHs are often so broad that they require an almost maximally spinning BH.
Acknowledgements.
This work was partially supported by the Ministero della Istruzione, della Università e della Ricerca (MIUR). TD wants to thank all the people who have contributed to find the results presented here, and in particular P. Goldoni, P. Sizun, L. Stella, and M. van der Klis.References
- [1991] Barret D., et al., 1991, ApJ, 379, L21
- [1996] Barret D., McClintock J. E., Grindlay J. E., 1996, ApJ, 473, 963
- [2002] Barret D., Olive J.-F., 2002, ApJ, 576, 391
- [1994] Brandt W. M., Matt G., 1994, MNRAS, 268, 1051
- [1997] Churazov E., et al., 1997, Advances in Space Research, 19, 55
- [2001] D’Amico F., Heindl W. A., Rothschild R. E., Gruber, D. E., 2001, ApJ, 547, L147
- [2000] Di Salvo T., Stella L., Robba N. R., et al., 2000, ApJ, 544, L119
- [2001] Di Salvo T., Robba N. R., Iaria R., Stella L., Burderi L., Israel G. L., 2001, ApJ, 554, 49
- [2002] Di Salvo T., Farinelli R., Burderi L., et al., 2002, A&A, 386, 535
- [2002] Di Salvo T., Stella L., 2002, Proceedings of the XXII Moriond Astrophysics Meeting ”The Gamma-Ray Universe”, eds. A. Goldwurm, D. Neumann, and J. Tran Thanh Van, The Gioi Publishers (Vietnam), astro-ph/0207219
- [2005] Di Salvo T., Iaria R., Méndez M., et al., 2005, ApJ, 623, L121
- [1996] Ebisawa K., Titarchuk L., Chakrabarti S. K., 1996, PASJ, 48, 59
- [1989] Fabian A. C., Rees M. J., Stella L., White N. E., 1989, MNRAS, 238, 729
- [2002] Fabian A. C., et al., 2002, MNRAS, 335, L1
- [1998] Grove J. E., Johnson W. N., Kroeger R. A., et al., 1998, ApJ, 500, 899
- [1989] Hasinger G., van der Klis M., 1989, A&A, 225, 79
- [1990] Hasinger G., van der Klis M., Ebisawa K., Dotani T., Mitsuda K., 1990, A&A, 235, 131
- [2001] Iaria R., Burderi L., Di Salvo T., La Barbera A., Robba N. R., 2001, ApJ, 547, 412
- [2002] Iaria R., Di Salvo T., Robba N. R., Burderi L., 2002, ApJ, 567, 503
- [1996] Kallman T., White N. E., 1989, ApJ, 341, 955
- [1996] Kalogera V., Baym G., 1996, ApJ, 470, L61
- [1993] Kluzniak W., 1993, A&AS, 97, 265
- [2000] Masetti N., Frontera F., Stella L., et al., 2000, A&A, 363, 188
- [2002] Miller J. M., et al., 2002, ApJ, 578, 348
- [2004] Miller J. M., et al., 2004, ApJ, 606, L131
- [2004] Miniutti G., Fabian A. C., Miller J. M., 2004, MNRAS, 351, 466
- [1971] Oda M., Gorenstein P., Gursky H., et al., 1971, ApJ, 166, L1
- [1966] Peterson L. E., Jacobson A. S., 1966, ApJ, 145, 962
- [1996] Phlips B. F., et al., 1996, ApJ, 465, 907
- [1999] Piraino S., Santangelo A., Ford E. C., Kaaret P., 1999, A&A, 349, L77
- [2000] Strickman M., Barret D., 2000, Rossi2000: Astrophysics with the Rossi X-ray Timing Explorer, March 22-24, 2000 at NASA’s Goddard Space Flight Center, Greenbelt, MD USA
- [1989] Sunyaev R. A., Titarchuk L. G., 1989, in Proc. of 23rd ESLAB Symposium on two topics in X-ray Astronomy, J. Hunt & B. Batrick, Eds. (ESA SP-296), p. 627
- [1997] Tavani M., Barret D., 1997, AIP Conf. Proc. 410: Proc. of the Fourth Compton Symposium, 75
- [1986] Tennant A. F., Fabian A. C., Shafer R. A., 1986, MNRAS, 219, 871
- [1994] Titarchuk L., 1994, ApJ, 434, 570
- [1997] Titarchuk L., Mastichiadis A., Kylafis N. D., 1997, ApJ, 487, 834
- [1998] Titarchuk L., Zannias T., 1998, ApJ, 493, 863
- [2000] van der Klis M., 2000, ARA&A, 38, 717
- [1994] van Paradijs J., van der Klis M., 1994, A&A, 281, L17
- [1982] White N. E., Holt S.S., 1982, ApJ, 257, 318
- [1982] White N. E., et al., 1986, MNRAS, 218, 129
ḎISCUSSION
W̱OLFGANG KUNDT: When dealing with black hole (BH) candidates you tended to speak of ”black holes” (rather than neutron stars surrounded by massive disks). In my 2004 Springer book I argue that BH-model is multiply inconsistent.
DI SALVO TIZIANA: Yes, you are right, I just used the model that is most commonly accepted at the moment.
F̱RANCO GIOVANNELLI: In which way you determine the angle of inclination of the accretion disk around the neutron star? and do you suppose that the accretion disk plane is co-planar to the orbital plane?
DI SALVO TIZIANA: The inclination angle is determined for 4U 1705–44 from the shape of the iron line modelled by a diskline; indeed the width and the distortion of the line depends on the Keplerian velocy along the line of sight, and therefore on the inclination of the disk with respect to the observer. The hypothesis that accretion disk is co-planar to the orbital plane is not necessary in this case.