A Compton Reflection Dominated Spectrum In A Peculiar Accreting Neutron Star
Abstract
We report on a puzzling event occurred during a long BeppoSAX observation of the slow-rotating binary pulsar GX 1+4 . During this event, lasting about 1 day, the source X-ray flux was over a factor 10 lower than normal. The low-energy pulsations disappeared while at higher energies they were shifted in phase by . The continuum spectrum taken outside this low-intensity event was well fitted by an absorbed cut-off power law, and exhibited a broad iron line at keV probably due to the blending of the neutral (6.4 keV) and ionised (6.7 keV) iron lines. The spectrum during the event was Compton reflection dominated and it showed two narrow iron lines at keV and keV, the latter never revealed before in this source. We also present a possible model for this event in which a variation of the accretion rate thickens a torus-like accretion disc which hides for a while the direct neutron star emission from our line of sight. In this scenario the Compton reflected emission observed during the event is well explained in terms of emission reflected by the side of the torus facing our line of sight.
keywords:
stars: pulsars: general – pulsar: individual: – GX 1+4 – X–rays: stars – stars: magnetic fields – spectrum: Compton reflection1 Introduction
Accreting X-ray pulsars are neutron stars (NSs) in binary systems, the emission of which is powered by accretion of matter from the companion. In several of these systems a highly variable X-ray flux is revealed, usually caused by variations of the mass accretion rate or by the occurrence of eclipses or dips.
NS X-ray binaries are usually divided in two sub-classes depending on the companion mass: namely, the high-mass and low-mass X-ray binaries (HMXRBs and LMXRBs; for a review see Joss & Rappaport 1984). Pulsation periods extend over a wide range (1.5 ms–8000 s); most of the X-ray emission detected from binary pulsars is in the 2-20 keV energy range; X-ray spectra are complex and often cannot be described in terms of a single component. A usual spectral description is terms of a two-component model, consisting of a soft component, usually a blackbody or a disc-blackbody model ( keV), and a hard component modelled by a power law with a high energy cut-off. There is evidence in several cases for one or more lines between 6 and 7 keV, most probably due to iron (Fe) (Becker et al. 1978; White et al. 1980).
Compton reflection of X-rays, has been studied in detail in the last few decades (see Rybicki & Lightman 1979; White, Lightman & Zdziarski 1988, Lightman & White 1988) and it might occur when X-ray and -ray radiation impinges upon a slab of cold material. The expected UV to X-ray spectrum will then be composed by three different components: i) the optically thick UV radiation from the thermal matter (usually modelled by a blackbody), ii) the (possibly non-thermal) primary X-ray radiation (usually modelled by a power law), iii) and the reprocessed component by the cold material. The X-ray spectrum of the latter has a characteristic shape (dictated by the photoelectric absorption at low energies and Compton scattering at higher energies), with a broad hump around 30 keV (e.g. Matt et al. 1991). Many fluorescent emission lines are also present, by far the most prominent being the iron K at 6.4 keV. This Compton reflection component was first observed in Active Galactic Nuclei (Pounds et al. 1990; Nandra & Pounds 1994), where it is almost ubiquitous (Perola et al. 2002; Bianchi et al. 2004), and it is often present also in X-ray binaries, especially in black hole systems (see e.g. Done 2004 for a review).
GX 1+4 is a LMXRB system harbouring a 130 s pulsar (Lewin, Ricker & McClintock 1971) accreting mass from a red giant companion (V2116 Ophiuchi) of class M5 III (Davidsen et al. 1977; Jablonski et al. 1997; Chakrabarty et al. 1997a and 1998; Pereira et al. 1996). In the NS X-ray binary zoo, we know only another system with a red giant companion: 4U 1700+24 (Masetti et al. 2002; Galloway et al. 2002).
GX 1+4 shows a variable X-ray flux on virtually all timescales so far investigated, from minutes to years. It is a relatively bright X-ray pulsar system, and it has displayed the largest spin-up rate recorded for an X-ray pulsar (Lewin, Ricker & McClintock 1971). The average spin-up trend reversed in 1983 to spin-down at approximately the same rate, since then other changes in the sign of the torque has been observed for this source (Chakrabarty et al. 1997b). It is somehow a peculiar object among the X-ray binaries because of the high magnetic field that the NS is believed to have, which was inferred from its timing properties (G; Dotani et al. 1989; Greenhill et al. 1993; Cui 1997). In fact, the presence of such a high magnetic field in a slowly rotating NS with a red giant companion is an intriguing puzzle for the evolutionary scenario of this binary system. GX 1+4 lies in the Galactic plane in the direction of the bulge (RA 17:32:03.0; DEC -24:44:44.3) and it has an atypical spectrum compared to other X-ray binaries (Frontera & Dal Fiume 1989). This source has not shown so far a soft emission component (although it might be undetected due to the very high absorption, atoms cm-2); it has a very hard X-ray spectrum which seems to be completely non-thermal and is usually fitted by a Comptonization model or a cut-off power law. The spectral parameters are rather variable. Moreover, a pronounced Fe emission line at 6.5 keV is often observed.
In this paper, we report on a long (about 3.5 days) BeppoSAX observation of GX 1+4 performed around November 2000. The source showed a marked intensity drop event, lasting for about 90 ks, followed by a recovery to an almost normal intensity state. We analyzed spectral and timing variations correlated with this event, and present a model to interpret the source behaviour.
2 OBSERVATION
BeppoSAX observed GX 1+4 three times, in 1996, in 1997 and in 2000. The first two observations are reported elsewhere (Naik et al. 2004), while here we report on the 3.5 days observation carried out between October 29th and November 2nd 2000. The BeppoSAX observatory covered more than three decades of energy, from 0.1 to 200 keV. The payload was composed by two Wild Field Cameras (WFC; Jager et al. 1997) and four co-aligned instrument: the Narrow Field Instruments (NFI: Boella et al. 1997a; LECS, 0.1-10 keV, Parmar et al. 1997; MECS, 1-10 keV, Boella et al. 1997b; HPGSPC, 4-100 keV, Manzo et al. 1997; PDS, 15-200 keV, Frontera et al. 1997). All four NFI instruments were on during the observation.
Since the LECS and MECS have imaging capabilities, we extracted the events from circular regions of 6′ radii centred on the peak of the source point spread function (PSF). The LECS background was subtracted using a background appropriate for low-latitude sources, i.e. source-free observations close to the galactic plane with a total exposure time of 210 ks (in order to avoid underestimating the background, we did not use standard background subtraction from a region in the same image, far from the source; note that for highly absorbed and intense sources the low energy background should be subtracted as reported in Parmar et al. 1999). The MECS background was extracted from an annulus around the source. The HPGSPC and PDS do not have imaging capabilities so the background subtraction was obtained using off-source data collected during the rocking of the collimators.
We carried out timing and spectral analysis using the data collected from these four instruments. We corrected all arrival times to the barycenter of the Solar System.
LECS and MECS spectra were accumulated from the same circular regions used for the event files and re-binned in order to have at least 50 photons per bin; HPGSPC and PDS spectra were re-binned so as to have at least 80 and 100 photons in each bin, respectively. With this choice, the minimum chi-square techniques could be reliably used in spectral fitting. For the spectral analysis we restricted the energy range of the instruments to: 1-4 keV for the LECS (due to the very high background and absorption value), 1.65-10.5 keV for the MECS, 9.8-20 keV for the HPGSPC and 15-200 keV for the PDS. Only those bins in which the count rate (after background subtraction) was significantly higher than zero were used in the spectral analysis. In time intervals in which the source was dimmest the LECS spectra contained no useful information, and were thus excluded from the analysis.
LECS response matrices were made using the LECS matrix generation tool LEMAT (included in SAXDAS 2.2.1) in order to account for the high count rate of the source (for details see the BeppoSAX cookbook: Guainazzi, Fiore & Grandi 1999). The other instrument’s matrices are those provided by the BeppoSAX data analysis center.
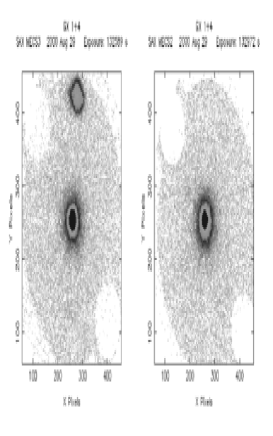
During the analysis we discovered the presence of a ghost source in the third MECS instrument (see Fig.1). The ghost is probably due to a spurious reflection in the telescope mirrors of a source out of the instrument field of view. The presence of this source does not affect the analysis of GX 1+4 because it lies 25’ off-axis, and it is present only in the third MECS. However, given the no–imaging capability of the PDS and the HPGSPC, and their larger field of view, we had to ensure that photons from this source did not contaminate the high energy emission of our target. To this aim, we extracted the MECS 3 spectrum of the ghost source, generated an appropriate off-axis response matrix and fitted its spectrum. Based on the 1–10 keV spectrum of this source, we estimated that its 10–100 keV flux was more than two orders of magnitude lower than that of GX 1+4 in the same energy band. We concluded that the HPGSPC and the PDS spectra are largely dominated by our target.
3 RESULTS
3.1 Timing analysis
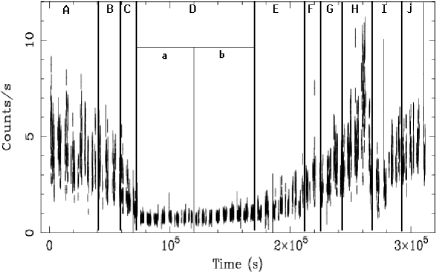
In all the energy bands we investigated, the X-ray light-curve of the source showed a large flux variability (see Fig.2 top panel). In the MECS energy range the source intensity dramatically dropped from 4 counts/s to 0.3 counts/s, then, after a 90 ks long low emission state, slowly increased reaching 10 counts/s, dropped again for less than 10 s and then returned to its starting intensity level.
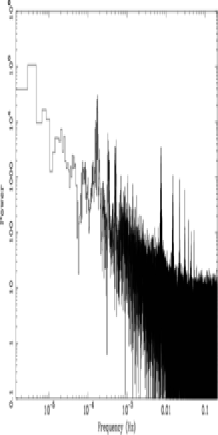
Pulsations were clearly seen in the Power Spectrum, the fundamental frequency was followed by six harmonics (Fig. 2 bottom panel). We then carried out an Epoch Folding Search followed by phase-fitting period determination, which gave a refined spin period value of s (at 11785.000781 TJD; all errors in the text, if not otherwise specified, are at 90% confidence level (c.l.); all errors in the figures are at 1 c.l.). The timing analysis was carried out using Xronos tools version 5.19.
We analysed in the same way the previous two BeppoSAX observations (in 1996 and 1997) and derived a secular spin period derivative of s s-1 across the three observations. Note that, although GX 1+4 shows a characteristic spin-down trend, its timing behaviour has not been always stable, and a period derivative reverse has been observed in a few occasions (Chakrabarty et al. 1997b; Pereira, Braga & Jablonski 1999). Therefore, the period derivative estimated from the three BeppoSAX datasets should be regarded as an average value.
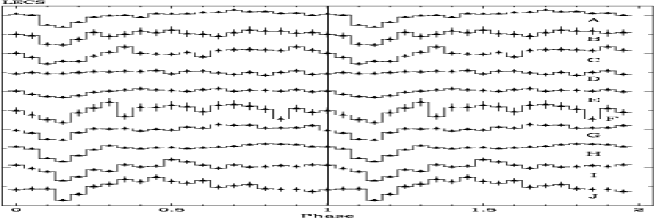
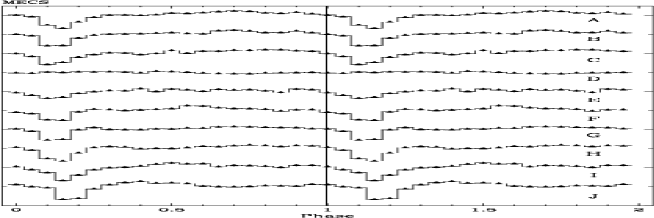
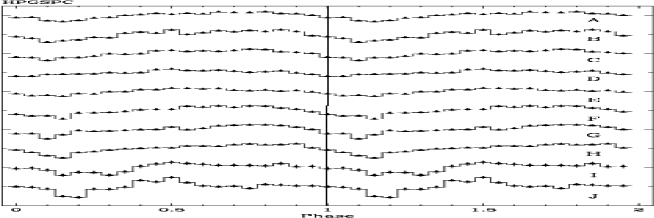
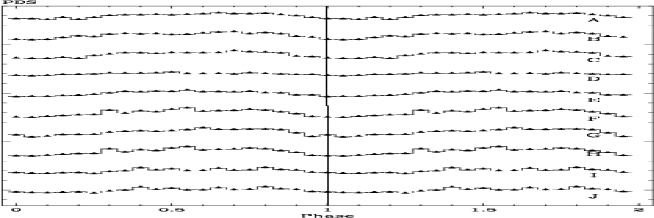
We divided the observation in 10 time intervals (Fig.2 top panel), and searched for pulsations in each interval with all four BeppoSAX instruments. During the whole observation, but interval D, all instruments showed pulsations at the same spin period. During the search for pulsations in the low intensity state (interval D) we found that in the LECS and in part of the MECS bands (7 keV) no pulsed emission was present (upper limits on the pulsed fraction are 7% and 5% for MECS and LECS, respectively; see also Fig. 4) while at higher energies ( 7 keV) a quasi-sinusoidal pulsed signal was always clearly detected (c.l. ; see Fig. 3 and 4).

In all four instrument we studied the pulse profiles in various energy ranges, finding marked differences (see Fig. 3). By considering data taken with the same instrument and comparing the phase of the pulse minimum among the HPGSPC and PDS pulse profiles, we found evidence for a shift in phase between the pulses detected at different times. For instance, the minima of the HPGSPC folded light-curves of intervals A and D are shifted in phase by and there is evidence for a trend in the phase shift evolution. 111 Because of the highly variable pulse profile of this source, it is not possible to study quantitatively the evolution of the phase shift during the observation, since is rather difficult to find a common model that fits the various light curves, and then an exact definition of the pulse minimum. This issue can then be discussed only qualitatively. If we concentrate on the pulse minimum and we use interval D as a reference, (see Fig.3, in particular panel three), the phase shifts seems to decrease from interval A to D, and then to increase again until the end of the observation.
Variations of the pulsed fraction (PF) are shown in Fig.4. During the low intensity emission (interval D) the PF below 7 keV is consistent with zero (note that in Fig.4 LECS and MECS pulsed fractions in the interval D are 1 upper limits), while at higher energies it increases to % (7-35 keV) and % (35-100 keV). The PFs were inferred using the simple formula; the high variability of the pulse profile prevented us from using a more accurate technique, like fitting with one or more sine functions.
3.2 Spectral analysis
Since GX 1+4 shows a large intensity variability, we considered separately spectra corresponding to the high and low emission parts of the light-curve studying the spectral changes over the 10 time intervals used for the timing analysis (Fig.2 top panel).
We first fitted the spectra by using a simple absorbed cut-off power law. This model gave a satisfactory reduced only in the intervals corresponding to a high source intensity (all but intervals C, D, E and F, where the ). We then added a blackbody model in order to search for a soft component (present in other X-ray binaries) but the addition of this further component was not significant.
Concerning the spectra relative to the low intensity part of the observation, we tried to fit them using the same broadband model of the other spectra but adding a partial covering factor; the resulting was about 1.5, better than the fit with the cut-off power law alone but still quite large.
We then noticed that the source spectral shape in the low emission state was reminiscent of that expected for a Compton reflection dominated spectrum, we then fit all spectra by using an exponentially cut-off power law (mimicking the incident X-ray beam) reflected by some neutral material (which we tentatively associate to the disc; pexrav model in Xspec; Magdziarz & Zdziarski 1995). By varying the relative amount of reflected and primary components this provided an accurate model for all the GX 1+4 spectra taken in different intensity states (see Fig. 5 and Table 1). The reflection parameter was small or even compatible with zero away from the low intensity event, while during the latter it reached the highest values ().


![[Uncaptioned image]](/html/astro-ph/0509692/assets/x21.png)
![[Uncaptioned image]](/html/astro-ph/0509692/assets/x22.png)
![[Uncaptioned image]](/html/astro-ph/0509692/assets/x23.png)
![[Uncaptioned image]](/html/astro-ph/0509692/assets/x24.png)
![[Uncaptioned image]](/html/astro-ph/0509692/assets/x25.png)
![[Uncaptioned image]](/html/astro-ph/0509692/assets/x26.png)
![[Uncaptioned image]](/html/astro-ph/0509692/assets/x27.png)
![[Uncaptioned image]](/html/astro-ph/0509692/assets/x28.png)
![[Uncaptioned image]](/html/astro-ph/0509692/assets/x29.png)
![[Uncaptioned image]](/html/astro-ph/0509692/assets/x30.png)
By adopting this spectral decomposition we found evidence also for changes in the absorption parameter () and photon index () during the observation. The hydrogen column density varied between atoms cm-2, reaching the highest values just before and after the low intensity event. Note that the average ISM absorption value in the direction of GX 1+4 (computed using the nh tool provided by heasarc) is atoms cm-2, meaning that most of the absorption is due to local material.
The power law index decreases by 10-20% when the source enter in the Compton reflection dominated phase (interval D) and the spectrum remained hard until interval H, where a flaring event occurred. This was followed by an abrupt decrease with spectral softening, and then a recovering to a harder value.
| A | B | C | D-a | D-b | E | |
| atoms cm | ||||||
| Pexrav | ||||||
| Pexrav (keV) | ||||||
| Pexrav rel-refl | ||||||
| Pexrav Norm () | ||||||
| Fe line (keV) | ||||||
| line Width (keV) | ||||||
| line Eqw (eV) | ||||||
| line Norm () | ||||||
| Fe line (keV) | ||||||
| line Width (keV) | ||||||
| line Eqw (eV) | ||||||
| line Norm () | ||||||
| 1.1(221dof) | 1.2(225) | 1.3(226) | 1.3(114) | 1.3(141) | 1.2 (125) | |
| Unab Flux (erg cm-2s-1) | ||||||
| F | G | H | I | J | ||
| atoms cm | ||||||
| Pexrav | ||||||
| Pexrav (keV) | ||||||
| Pexrav rel-refl | ||||||
| Pexrav Norm () | ||||||
| Fe line (keV) | ||||||
| line Width (keV) | ||||||
| line Eqw (eV) | ||||||
| line Norm () | ||||||
| 1.1(147) | 1.2(166) | 1.18(92) | 1.08(138) | 1.05(185) | ||
| Unab Flux (erg cm-2s-1) |
All time-resolved spectra showed at least a Fe line emission feature. In all intervals but D and E, only one broad (0.3 keV) Fe line emission was present at 6.55 keV. In several other sources a broad Fe line was detected around this energy, but then observations with higher spectral resolution instruments (Chandra-HETG and XMM-Newton) disentangled the blending of two narrow lines at 6.4 and 6.7 keV (Audley 1997; Gallo et al. 2004). In order to investigate the possible occurrence of blending, we fitted the spectra adding to the continuum model two Gaussians with fixed peak energies at 6.4 and 6.7 keV (neutral and He-like Fe , respectively), and forcing their widths to be equal. The fit gave narrow widths (0.1 keV, which is the energy resolution of the instrument at that energy) and a ratio between the two line normalisations was variable in time ranging between . However, the reduced chi-squared remained close to one with three more parameters and the F-test revealed the addition of a new Gaussian function not significant. Only high resolution observations could shed more light on this topic.
In intervals D and E, while the continuum reduced substantially, an additional narrow line at 7.05 keV was clearly revealed. At the same time, the broad line at 6.55 keV became narrower and its centroid shifted at slightly lower energies. The keV line was possibly present also in higher intensity spectra but being too weak to be detected because of the intense continuum emission. A natural interpretation is that the broad line detected during the high emission results from the blending of a 6.4 keV neutral Fe and a 6.7 keV He-like Fe, while the two narrow lines in the low intensity emission are the neutral Fe K and K. The K flux is about 20% that of the K, slighly larger than the expected value of 15-16% (Molendi et al. 2003). However, we would like to stress the fact that the relatively poor MECS energy resolution makes our interpretation of these lines quite uncertain. For example, we cannot exclude that the line at keV can be, at least in part, due to the 6.93 keV Fe XXVI line.
In some spectra (especially during intervals A and G, there was a weak evidence for an absorption feature in the 32-37 keV range, similar to an edge or a cyclotron line. An absorption edge at this energies is unlikely, while fitting a cyclotron model (cyclabs in Xspec) we found an improvement of the chi-square value with an F-test probability of and for interval A and G, respectively. If real, the feature can be interpreted as an electron cyclotron feature. The inferred surface magnetic field of the NS would then be G, much lower than the value proposed by interpreting the torque reversal of the source (Dotani et al. 1989). In order to better study the possible presence of a cyclotron line, we made a Pulse Phase Spectroscopy (PPS) analysis in time-intervals A and G in the whole 1–200 keV energy band. In fact cyclotron lines are often expected to have a spin-phase dependent strength, but unfortunately the PPS analysis did not yield any improvement of the line significance. Further observations (e.g. INTEGRAL) are needed to confirm this very weak evidence.
4 DISCUSSION
We reported on the results of a long BeppoSAX observation of the X-ray binary pulsar GX 1+4 , during which the source entered a phase of low X-ray emission. During the low event: i) a Compton reflection dominated spectrum was clearly detected, for the first time in this source, ii) pulsations were not detectable with the low energy instruments, while they were clearly visible above keV and iii) an emission line at 7.05 keV was revealed for the first time in this source.
Moreover we found that the pulse profile of GX 1+4 is highly energy and time dependent, and the pulse minimum at the higher energies systematically shifted in phase during the whole observation. A broad Fe line at 6.5 keV, detected also with past missions, was present in all spectra while the substantial reduction of the continuum emission during the low intensity event, allowed us to reveal, for the first time, a second Fe line at 7.05 keV.
A similar (although shorter) low emission event was observed in GX 1+4 with RXTE (Giles et al. 2000; Galloway et al. 2000), but due to the poor RXTE spectral resolution a comparison between the spectra of these two events is not straightforward. During a few occasions GX 1+4 was detected by RXTE in an unusual low flux non-pulsating state (Cui 1997; Cui & Smith 2004). The source fluxes in such observations were comparable to the flux of the source during the low intensity event reported here. Cui (1997) also pointed out that the X-ray spectrum was harder than usual and interpreted these non-pulsating events as due to an onset of a centrifugal barrier during the transition to the propeller regime. However, although such events were extremely similar to the one reported here, an interpretation in terms of the onset of centrifugal barrier appears less likely since no pulsations are expected in the propeller regime, if accretion onto the magnetic poles is halted, neither at low nor at high energies. There could also be particular magnetospheric configurations through which, even in the propeller regime, matter might reach the magnetic poles of the NS causing pulsations (see also Campana et al. 2001). However, even in this case, it is not obvious to explain why pulsations are visible only at high X-ray energies and the pulse minima shift in phase with time.
In order to interpret the low intensity event occurred during the BeppoSAX observation, we present below different models we have examined.
A crucial insight derived from the fact that we found a common spectral model that describes spectra taken at all the observed intensity states, merely by varying the relative contribution of the reflected component. The onset of a Compton reflection component is unlikely to be due to a different emission state of the source itself. It is instead most probably associated with the reprocessing of the NS emission by some Compton thick material (possibly the accretion disc that partially intercepts the NS X-ray beam). Moreover, the high variability in the absorption value detected during the BeppoSAX observation and the lack of X-ray pulsations at low energies during the low event, do not find a natural explanation in a scenario were the onset of the low state is caused by a variation of emission of the NS itself.
Another possibility is a variation in the accretion rate from the companion star (as proposed by Galloway et al. 2000 for the other low emission event). While variations might well be present, they cannot explain alone the onset of a pronounced reflection component, the highly variable absorption, the unpulsed emission at low energies or the varying shift in phase of the high-energy folded lightcurves.
Our spectral analysis indicates that the spectrum observed during the low intensity event should not be due to the direct NS surface emission. Rather most of the photons we see, reach us after reflection off material located in the proximity of the NS. This material might be due to the disc surrounding the NS or to the high density wind of the companion, perhaps accompanied by a sort of eclipse from the giant companion itself. Below we discuss these possibilities.

The observed decrease in X-ray intensity might be due to a partial eclipse, for instance the direct NS emission might be hidden, from our line of sight, by the limb of the giant companion. In this case, the X-ray spectrum observed during the eclipse would be mainly produced through the Compton reflection off the material surrounding the companion, e.g. its dense stellar wind.
The observed changes in are naturally explained by this scenario. Since the stellar wind is denser and denser approaching the giant surface, is expected to reach the highest values soon before the eclipse ingress (interval C) and soon after the eclipse egress (interval E), because at these epochs the direct X-ray photons pass through a more dense material before their detection.
Furthermore, if the emission lines observed with BeppoSAX would be a blending of the 6.4 and 6.7 keV Fe during the high-intensity emission (respectively neutral and ionized Fe; see also section 3.2) and the 6.4 and 7.0 keV features would be neutral Fe lines during the low emission event, this could be in agreement with the eclipse scenario. In fact, during the partial eclipse the regions closer to the NS, which are expected to be the most ionized, are covered by the companion. We then expect to detected ionization lines when the NS is not obscured and lines from neutral material during the eclipse, when only the farther regions are visible.
However, in order to produce such highly reflection dominated spectrum, this model requires that the Compton thick material is distributed along a wide solid angle around the source, and this distribution is difficult to be ascribed by stellar companion wind material only. Moreover, taking in account the large size of the companion star compared with the NS radius, the occurrence of a 90 ks eclipse requires an ad hoc fine tuning of the system inclination. Both problems might be partially reduced if we assume that at least part of the scattering material is located in the accretion disc. For certain inclination angles, the disc could subtend a wide solid angle around the NS, and because of the large disc size, compared to the NS radius, a lesser degree of fine tuning would be required. However, this scenario requires a different tuning, now on the inclination of the disc itself.
Another possible scenario, the one we favor, is one in which the material responsible for the occultation of the direct NS emission might be provided by a torus-like accretion disc around the compact source (see Fig.6). The increase in the accretion rate from the companion star, possibly due to a change in the wind parameters, would cause the inner torus to thicken222Note that the occurrence of accretion rate changes in the history of this source is well supported by the detections of spin-torque variations in the pulse timing history (Chakrabarty et al. 1997b)., thus hiding the direct emission of the NS from our line of sight.
In this scenario the Compton reflected emission observed during the low event is well explained in terms of emission reflected by the side of the torus facing our line of sight.
In order to prevent light-travel time smearing of the pulsations, the reflecting zone should not be farther than cm (where c is the light velocity and the source spin period). The inner radius of the accretion disc is dictated by the magnetospheric radius () of the NS. Since torque reversals has been detected in GX 1+4 must be close to the corotation radius, cm, which is smaller than . Furthermore, for a =134.925(1) s pulsar a phase shift between pulse minima of , as that observed across intervals A and D (see section 3.1), corresponds to a delay time of s and to a difference in photon path of cm. In this picture, the lack of low energy pulsations may be explained if we consider a reflecting material composed of different layers, the near at the NS the Compton thicker, the farther the Compton thiner. In fact if the Compton thiner material is expected to be mainly responsable for the low-energy reflection, it could be too far from the source to keep the coherence in the low-energy photons that are reflecting.
Moreover, the variation can be understood as follow: by increasing the torus the amount of materials in the line of sight starts to increase, and so the value (intervals B and C). When the direct emission is completely hidden (interval D) the value decreases because only the reflected component is seen. The egress from the low state is an epoch when the torus starts to shrink down again (intervals E and F) and the direct emission slowly re enter into view, in the beginning through a large amount of material.
This scenario strengthes the interpretation of the two narrow lines present during the event as the neutral Fe and and the broad line as the blending of the neutral Fe and the He–like Fe . In fact, since out of the low intensity event the whole disc emission is visible (in particular the disc regions close to the NS which are highly ionised by the intense NS X-ray beam) we then expect to see both neutral and ionised Fe emission lines. On the other hand, when the torus hides the NS from the direct view, only the reflection by the external regions is visible, we then expect to detect only neutral lines.
The intensity of the neutral iron line is expected to correlate with the intensity of the reflection component (e.g. Matt et al. 1991, George & Fabian 1991). Unfortunately, the poor BeppoSAX energy resolution makes difficult to separate the neutral and ionized lines. Nevertheless, we tried to fit the iron line with two unresolved (i.e. -functions) lines with energies fixed to 6.4 and 6.7 keV (the neutral and He-like ions, respectively). The fit is as good as the one with the broad line. The EW of the neutral line is very large (of the order of 1-2 keV) when the reflection component dominates the spectrum, as in interval D, as expected from MonteCarlo simulations (e.g. Matt et al. 1991). In intervals A-C the line EW is much smaller (up to about 250 eV), because of the dilution by the direct power law. In intervals F-J, when the reflection component is very small, there is still a substantial neutral line (EW of about 100-200 eV), which can be due to the absorbing matter, which has a large covering factor (e.g. Matt 2002). Interval E is instead puzzling, as there is still a very large neutral iron line (EW800 eV) and a small reflection component. In the framework of our proposed scenario, however, it is possible that the torus, while shrinking, becames also less optically thick (or at least does so the visible part of it). In fact, for Thomson optical depths of a few tenths a still very intense iron line is expected, while the reflection continuum is much reduced, especially above 10 keV (Matt et al. 2003).
The model described above is analogous to that proposed for some AGN (Walter et al. 2003; Revnivtsev et al. 2003; Matt & Guainazzi 2003).
The value observed in GX 1+4 during some part of the observation is similar to that measured in some of the highly absorbed INTEGRAL sources, we could speculate that the highly absorbed INTEGRAL sources are compact binary systems (as GX 1+4 ) where, due to a particular line of sight and inclination, the direct emission of the compact object does not reach the observer being always hidden by the inner accretion torus.
While this work was being drafted, Naik et al. (2004) published a
paper on the same observation. Their spectral modeling is not fully
consistent with ours. Naik et al. claimed the presence of a soft
excess that we do not detect. One possibility could be the different
technique they adopted for the background extraction. The technique
they used may led to underestimate the background at energies
2 keV, then a low-energy excess might have resulted (see Sec. 2
and 3 for further explanation). Moreover, they fit the spectrum of the
low intensity event with a Comptonization model with a higher
temperature of seed photons and a higher absorption value than in the
normal emission state. However, it is not clear how a hot Comptonizing
material might produce a 2.1 keV equivalent width neutral Fe emission
line, as present during this low intensity event. These authors did
not use the HPGSPC instrument in the analysis, which gives a large
help in constraining the broad band spectrum, furthermore they divided
the observation in three time intervals, which we believe not
enough to reveal and model the whole spectral changes occurred during
the observation.
N.R. acknowledges Andrzej Zdzriaski, in charge as the referee of the COSPAR proceedings, and the referee for several key comments. N.R. thanks A. Antonelli, F. Fiore and T. Mineo for their advices on the BeppoSAX analysis, F.Verrecchia for the analysis of the Wide Field Camera observations and F. Mirabel for enlightening questions during a seminar in Saclay where this work was presented. N.R. also thanks L. Burderi, T. Di Salvo and M. Méndez for useful discussions. This work was partially supported by ASI and MIUR grants. N.R. is supported by a Marie Curie Fellowship to NOVA.
References
- (1) Audley M. D., 1997, PhD Thesis
- (2) Becker et al. 1978, ApJ, 221,912
- (3) Belczynski K., Mikotajewska J., Munari U., Ivison R.J., Fiedjung M., 2000, A&AS, 146, 407
- (4) Beurle K., Bewick A., Harper P., Quenby J., Spooner N., Fenton A., Fenton K., Giles A., et al., 1984, AdSpR, 3(10-12), 43
- (5) Bianchi S., Matt G., Balestra I., Guainazzi M., Perola G.C., 2004, MNRAS, 421, 491
- (6) Boella, G., et al. 1997a, A&AS, 122, 299
- (7) Boella, G., et al. 1997b, A&AS, 122, 327
- (8) Campana, S., Gastaldello, F., Stella, L., Israel, G. L., Colpi, M., Pizzolato, F., Orlandini, M., Dal Fiume, D., 2001, ApJ, 561, 924
- (9) Chakrabarty D., Roche P., 1997, ApJ, 489, 254
- (10) Cui W., 1997, ApJ, 482, L163
- (11) Cui W., Jablonski F., Galloway D., 2002, A&AS,
- (12) Cui W., 2003, HEAD, 35, 1706C
- (13) Cui W. & Smith 2004, ApJ, 602, 320
- (14) Done C., 2004, in Frontiers of X-ray astronomy. Edited by A. C. Fabian, K. A. Pounds, R. D. Blandford. Cambridge (UK): Cambridge University, p. 89
- (15) Davidsen A., Malina R. , Bowyer S., 1977, ApJ, 211 , 866
- (16) Dotani T., Kii T., Nagase F., Makishima K., Ohashi T., Sakao T., Koyama K., Tuohy I.R., 1989, PASJ, 41, 427
- (17) Frontera F. et al. 1997, A&AS, 122, 357
- (18) Gallo L. C., Boller Th.,Brandt W. N., Fabian A. C.,Vaughan S, 2004, A & A, 417, 29-38
- (19) Galloway D.K., Giles A.B., Wu K., Greenhill J.G., 2000, MNRAS, 325, 419
- (20) Galloway D.K., Sokoloski J. L., Kenyon, Scott J., 2002, ApJ, 580, Issue 2, 1065
- (21) George I.M., Fabian A.C., 1991, MNRAS, 249, 352
- (22) Giles A.B., Galloway D.K., Greenhill J.G., Storey M.C., Wilson C.A., 2000, ApJ, 529, 447
- (23) Greenhill J.G., Sharma D.P., Dieters S. W.B., Sood R.K., Waldron L., Storey M.C., 1993, MNRAS, 260, 21
- (24) Hirano T., Hayakawa S., Nagase F., Masai K., Mitsuda K., 1987, PASJ, 39, 619H
- (25) Jager R. et al. 1997, A&AS, 125, 557
- (26) Joss P.C. & Rappaport S.A. 1984, Ann. Rev. A&A, 22,537
- (27) Lewin W.H.G., Rickter G.R. & McClintock J.E, 1971, ApJ, 169, L17
- (28) Lightman A.P. & White T.R. 1988, ApJ, 335, 57L
- (29) Magdziarz P. & Zdziarski A.A., 1995, MNRAS, 273, 837
- (30) Manzo G. et al. 1997, A&AS, 122, 341
- (31) Masetti, N., Dal Fiume, D., Cusumano, G., Amati, L., et al. 2002, A&A, 382, 104
- (32) Matt G., Perola G.C., Piro L., 1991, A&A, 247, 25
- (33) Matt G., 2002, MNRAS, 337, 147
- (34) Matt G., Guainazzi M., Maiolino R., 2003, MNRAS, 342, 422
- (35) Molendi S., Bianchi S., Matt G., 2003, MNRAS, 343, L1
- (36) Naik S., Paul B. & Callanan, P.J., 2004, ApJ 618, 866
- (37) Nagase, F. 1989, PASJ, 41, 1N
- (38) Nandra K. & Pounds K.A., 1994, MNRAS 268, 405
- (39) Parmar A.N. et al 1997, A&AS, 122, 309
- (40) Parmar A.N., Oosterbroek T., Orr A. et al. 1999, BeppoSAX Low-Energy Concentrator Spectrometer background subtraction techniques) A&AS 136, 407 (with an erratum later)
- (41) Pereira M.G., Braga J., Jablonski F., 1999, ApJL, 526, L105
- (42) Perola G.C., et al., 2002, A&A, 389, 802
- (43) Pounds K. A., Nandra K., Stewart G. C., George I. M., Fabian A. C. 1990, Nature, 344, 132
- (44) White N.E, Pravdo et al. 1980; ApJ 239, 655
- (45) White N.E., Nagase F. & Parmar A.N., 1995, X-ray Binaries, Lewin W.H.G., van Paradijs J., van den Heuvel E.P.J., eds., Cambridge University Press, p. 1-57
- (46) White T.R., Lightman A.P. & Zdziarski A.A., 1988, ApJ, 331, 939W