Near-Infrared search for C IV absorption counterparts along the line-of-sights to pair quasars1,2
Abstract
We carried out a Subaru and UKIRT near infrared imaging survey for H emitting galaxies around two pair quasar systems (Q0301-005/Q0302-003 and Q2343+125/Q2344+125), and a triple quasar system (KP76/KP77/KP78). Narrow band near infrared filters covering the H emission expected for galaxies at the confirmed C iv absorption redshift toward the quasar systems were used for this survey. These quasar pairs or triplet are separated at most by 17 arcmins ( 5 Mpc in proper distance) from each other on the sky, and have common C iv absorption lines at almost identical redshifts at = 2.24 – 2.43, which suggests there could be a Mpc-scale absorbing systems such as a cluster, or a group, of galaxies that cover all the line-of-sights to the pair/triple quasars. Using narrow-band deep images, we detected five candidates for H emitting galaxies around two of the six fields, Q2343+125 and Q2344+125, whose apparent star formation rates are, extremely high, 20 – 466 M⊙ yr-1. However, all or most of them are not likely to be galaxies at the absorption redshift but galaxies at lower redshift, because of their extreme brightness. In the fields of the other quasars, we detected no star-forming galaxies, nor did we find any number excess of galaxy counts around them. This no-detection results could be because the luminosities and star formation rates of galaxies are lower than the detection limits of our observations ( 21 and 1.8–240M⊙ yr-1). They could be located outside of the observed field around Q0301 and Q0302, since our targetting field covers only 2% of this pair quasar field. But this is not the case for the other pair/triple quasar fields, because we got effectively large field coverage fractions ( 33 – 75%). Otherwise, most C iv absorption lines could be ascribed not to cluster of galaxies, but to isolated star forming pockets far from bright galaxies and could be analogous objects to weak Mg ii absorbers.
1 Introduction
Several quasars, which are separated from each other on the sky by a few arcmins, have sometimes common metal absorption lines at almost identical redshifts (e.g., Shaver, Boksenberg, & Robertson 1982; Jakobsen et al. 1986; Crotts & Fang 1998). The presence of such common metal absorption lines implies that Mpc-scale gas clouds exist at the redshift, and that they are covering both lines of sight to the quasars. Since it is difficult to assume that a single homogeneous Mpc scale absorber covers both the lines of sight to those quasar pairs based on the framework of the prevalent CDM dominant universe, these metal lines could be produced by gas clouds that are clustering and forming Mpc-scale system (e.g., clouds in galaxies that are members of a Mpc-scale cluster (group) of galaxies). Francis & Hewett (1993) estimated the probability of having strong Ly absorption lines (i.e., analogue of metal lines) at almost same redshift in two lines of sight separated by a few arcmins is an order of . If there is a cluster (group) of galaxies, the probability would be increased. Although several high- cluster of galaxies have recently discovered, it is still observationally difficult to detect emission lines of star forming galaxies in the redshift desert at 1.5. However, observations around pair quasars with common metal absorption systems are quite promising (e.g., Francis et al. 1996). High- cluster of galaxies are excellent targets to investigate star formation histories.
To date, several cluster (group) of galaxies have been detected at 2. They are often detected around radio-loud quasars or radio galaxies. Pentricci et al. (2000) found 14 Ly emitting galaxies within the projected distance of 1.5 Mpc from the powerful radio galaxy Q1138-262 at =2.16. Pascarelle et al. (1996) also detected two Ly emitting galaxies at 2.39 in the field around the weak radio galaxy, 53W002, and also confirmed them spectroscopically. There are several other candidates for cluster (group) of galaxies at 2 discovered by narrow-band () imaging observations (e.g., LeFvre et al. 1996, Hu & McMahon 1996). Not only Ly but H and [O iii] are also useful lines for identification of star forming galaxies (e.g., Teplitz, Malkan, & McLean 1998; Iwamuro et al., 2000). Galaxies have also been discovered in the fields around quasars as counterparts of strong absorption systems. C iv absorption systems with (rest-frame equivalent width) 0.4 Å and Mg ii absorption systems with 0.3 Å are thought to have 70 and 40 kpc sizes around galaxies, by comparing Press-Schechter function (as luminosity function of galaxy) and the number densities of these absorption systems per redshift. Charlton & Churchill (1996) showed that both spherical halo and randomly oriented disks with only 70–80% covering factors of gas clouds can recover the observed properties of Mg ii absorbers, by performing a Monte Carlo simulation. This means that the distribution of the Mg ii absorbers around galaxies are not smooth but patchy. There are some galaxy surveys around single quasars (e.g., Bergeron & Boisse 1991; Steidel, Dickinson, & Persson 1994; Lanzetta et al. 1998; Chen & Lanzetta 2001; Chen et al. 2001). However, for pair quasar regions, only a few observations have been carried out based on common metal absorption lines of pair quasars (e.g., Teplitz et al., 1998; Francis, Woodgate, & Danks 1997; Francis et al., 1996), in spite of its high potential.
In this paper, we report the results of our near-infrared (NIR) imaging survey of the fields around pair/triple quasars that have common metal absorption lines at 2.3. They are separated at most by 17 arcmins ( 5 Mpc in proper distance, with =/72 km s-1 Mpc-1). Our objectives are to search for star forming galaxies that produce the common metal absorption lines, and see if there are galaxies that are member of the cluster (or group) of galaxies including those star forming galaxies.
We present the outline of the observations and data reduction in 2, and the brief description of the photometric analysis in 3. In 4, we present the result for each quasar field. We summarize and discuss our results in 5. Throughout this paper, we assume =72 km s-1 Mpc-1, = 0.3, = 0.7, and =0.5.
2 Observation and Data Reduction
We observed the fields of pair/triple quasars. These quasars have common absorption systems (at least contain C iv doublets in them) with small redshift difference, 0.005, which corresponds to velocity difference, 500 km s-1, in the frame of the absorbers. However, we should notice that if redshift difference is caused by the Hubble flow, these absorbers would be separated by much larger than the typical size of cluster of galaxies along the line of sight. We chose filters which cover redshifted H emission lines. Filter name, central wavelength, band width, corresponding redshift for H emission line detection, and the bandpass ratio of to broad-band (-band), are listed in Table 1. To see the color excess, we also carried out -band imaging observations. The observations were performed with either the Cooled Infrared Spectrograph and Camera for OHS (CISCO; Motohara et al. 1998) on the Subaru Telescope (Iye et al. 2004), or UKIRT First-Track Imager (UFTI; Roche et al. 2002) on the UKIRT. Both instruments have HAWAII 1024 1024 pixel HgCdTe arrays that cover a field of view (FoV) of 108′′ 108′′ and 92′′ 92′′, respectively. We summarize the observation logs in Table 2; columns (1) and (2) are quasar name and its emission redshift. Absorption redshift of common metal lines is given in column (3). Identified ion transition is listed in column (4). The data was taken on the date in column (6) using the filter in column (5). Exposure time and average seeing size are in columns (7) and (8). Columns (9) and (10) are detection limit with 3 and 5 levels, which are magnitudes of the faintest artificial objects that are placed in the observed frame and extracted with 3 or 5 detection level. We will describe the simulation in detail in § 3. In columns (11) and (12) we also present 3 detection limits of H emission line and correspondent star formation rate. References of spectroscopic observations are given in column (13).
Data reduction was processed in a standard manner with IRAF. All objects are identified by the Source Extractor program (Bertin & Arnouts 1996) with detecting-threshold of 2.0. We evaluated the magnitudes of objects in circular apertures twice as large as seeing size.
3 Photometric Analysis
In the color-magnitude (CM) analysis to isolate H emitting objects, we need an accurate evaluation of the photometric errors. Therefore we have created 10,000 artificial stars with the seeing size of each frame. Their magnitude distribution is homogeneous between = 15–22 mag. We placed them in both and frames randomly. We plot CM diagrams to compare the detected objects against the simulated artificial objects. The candidates for intervening galaxies at 2.3 have color excess because their H emission lines are redshifted into the filter bandpass, which makes them deviated from the distributions of the artificial objects. We regard all the objects as candidates of H emitters, if they are deviated toward the positive direction in the vertical axis (i.e., ) more than 3 from the distribution of the artificial objects in CM diagrams. It is unlikely that the color excess is caused by other lines whose rest-frame wavelength are shorter than H, such as Ly, [O ii], or [O iii] lines, because galaxies should be at 17.5, 5.0, and 3.5 if these lines are redshifted into the bandpass of filters. Flux of these objects would be too weak to detect in our observations. On the other hand, if candidate objects are much brighter than the typical magnitudes of H emitting galaxies that produce metal absorption lines; 22.5, 21.5, and 20.8 (Teplitz et al. 1998), these color excess could be due to near-infrared emission lines from galaxies at lower redshift, such as [Fe ii]1.257, [Fe ii]1.644, Pa, Pa, and Br, which is described in § 5.
If we assume that the color excess is attributed to H emission lines, we can estimate the flux of H line from the and magnitudes by
| (1) |
where and are magnitude zeropoints (i.e., a magnitude corresponding to the flux, one count per second on each pixel) for and filters (e.g., Iwamuro et al. 2000). Here, the constant, , is defined as follows,
| (2) |
where is the band width of the filter and is a total H line flux (without the continuum flux) that is covered by the filters. We define 1, 2, and 3 deviation borders in CM diagram as the equation (1) with fixed -value that cover 68.3, 95.5, and 99.7 % of all the artificial objects.
From the luminosity of H emission line, (ergs s-1), we can also evaluate star formation rate () using the conversion relation described in Kennicutt (1998),
| (3) |
where we assume the Salpeter initial mass function with lower and upper mass cutoffs of 0.1 and 100 .
4 Results
The color-magnitude analysis of all the objects detected in the six fields around pair/triple quasars yielded two and three candidates for star forming galaxies around Q2343+125 and Q2344+125, respectively. In this section, we describe the result for each quasar field.
4.1 KP76/KP77/KP78
The quasar triplet (KP76:Q1623+2651A at = 2.467, KP77:Q1623+2653 at = 2.526, and KP78:Q1623+2651B at = 2.605) is located on the sky within a small FoV of 3 arcmin: 147′′ between KP76 and KP77, 127′′ between KP76 and KP78, and 177′′ between KP77 and KP78 (e.g., Crotts & Fang 1998). All of them have C iv absorption lines at 2.24 in their spectra with total equivalent widths, 0.14, 0.08, and 2.34 Å, respectively. Other transitions of metal lines such as C i, C ii, Si ii, Si iii, Si iv, N v are also identified. The radial velocity separations of these absorption lines are within 500 km s-1 of each other in the frame of the absorbers. The linear angular distance on the sky between these systems corresponds to 1 Mpc at 2.24, which is comparable to the typical size of cluster of galaxies in the local universe.
We carried out two deep imaging observations of the fields around KP76 with UKIRT + UFTI with FoV of 90′′ 90′′ (i.e., 500 kpc 500 kpc), and KP77/KP78 with Subaru + CISCO with FoV of 108′′ 108′′ (i.e., 600 kpc 600 kpc). Although we found two objects around KP76 that were detected only in filters, they are confirmed to be ghost images of brightest sources in the frames. There are not any other candidates for star forming galaxies with 6.8 M⊙ yr-1 ( 2.410-17 ergs s-1 cm-2) in KP76 field or 1.8 M⊙ yr-1 ( 6.310-18 ergs s-1 cm-2) in KP77/KP78 field, with 3 detection limit of 21.
4.2 Q0301-005/Q0302-003
This pair quasar is separated by about 17′ from each other on the sky, which corresponds to 5.5 Mpc at 2.43 (e.g., Dobrzycki & Bechtold 1991). They have common C iv and/or Si iv doublets at 2.96, 2.72, and 2.43 (Cowie et al., 1995; Songaila 1998; Steidel 1990), of which only H emissions at 2.43 can be identified by the filter of our observation. We took two images with UKIRT + UFTI around both quasars by putting them at the centers of frames. We identified no candidates for star forming galaxies with 236 M⊙ yr-1 ( 6.910-16 ergs s-1 cm-2) in Q0301 field and 23 M⊙ yr-1 ( 6.710-17 ergs s-1 cm-2) in Q0302 field. The 3 detection limits are = 20.1 around Q0301-005 and = 21.1 around Q0302-003.
4.3 Q2343+125/Q2344+125
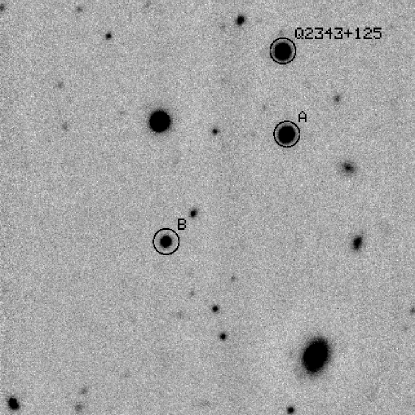
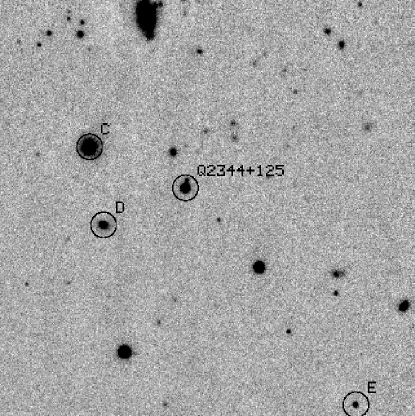
Q2343+125 has C iv absorption lines at =2.4285 and 2.4308, while Q2344+125 has corresponding strong C iv absorption lines at =2.4265 and 2.4292 (Sargent, Boksenberg, & Steidel 1988). The velocity separation of these absorption lines along the line of sight is smaller than 400 km s-1. These quasars are separated from each other only by 5′ ( 1.6 Mpc) at 2.43. The C iv absorption system in Q2343+125, which was classified as Damped Ly system (Lu, Sargent, & Barlow 1998), has other metal lines such as Al ii 1670, Fe ii 1608, Si ii 1526.
To date, several deep imaging observations have been carried out for this field. Bergvall et al. (1997) took an optical narrow-band deep images to search Ly emitting objects around both of the quasars, but did not find any candidates. Ly emissions, however, are strongly affected by dust extinction, which makes it difficult to detect. Therefore, Teplitz et al. (1998) took deep NIR images with a small FoV (38′′ 38′′) around Q2343+125 to search H emitters, but nothing was detected. Bunker et al. (1999) also carried out a long-slit K-band spectroscopic search for H emitters in the vicinity (within 11′′ 2.′′5) of Q2343+125, but found nothing above 3 limit ( = 6.5–1610-17 ergs s-1 cm-2).
In our NIR images taken with Subaru + CISCO, we detected two candidates (objects A and B) for star forming galaxies at 2.43 around Q2343+125 (Figure 1) and three candidates (objects C, D, and E) around Q2344+125 (Figures 2), whose magnitude, H flux, and are listed in Table 3, by assuming that they are actually galaxies at 2.43. Unfortunately, it is difficult to tell the morphological type of the identified objects because of low spatial resolutions in the observed images. The 3 detection limits of these images are = 20.5 and 21.1, respectively. These objects were outside of the frame (or just at the borders of FoV) in the previous observation by Teplitz et al. (1998). The CM diagrams are also presented in Figures 3 and 4. All candidates are bright ( 18.3) and their apparent s are very large ( 20 M⊙ yr-1). We will discuss them in the next section.


5 Summary and Discussion
We detected five candidates (objects A – E) for intervening galaxies around two of six pair/triple quasar fields, by NIR imaging observations. They are all bright ( 18.3) with large H fluxes ( 5.7 ergs s-1 cm-2).
Teplitz et al. (1998) detected 13 H emitters, using same method to ours, of which the brightest two objects (=15.42 with = 249 10-17 ergs s-1 cm-2 around Q0114-089 and =18.15 with = 581 10-17 ergs s-1 cm-2 around PC2149+0221) have similar properties to ours. Teplitz et al. (1998) regarded them as Seyfert I galaxies, because they are extremely compact and one of them had broad emission lines. However, all (or at least substantial fraction) of our objects with absolute magnitude, 245, are not likely to be Seyfert galaxies at 2.43, because their volume density111We evaluated this value by assuming that all five objects exist within 1.6 Mpc from each other along line of sight, which is consistent to the separation of the lines of sight to the pair quasars at 2.43. (5.2 Mpc-3) is much larger than the global density of AGNs with similar luminosities at similar redshift (10-6 Mpc-3; Warren, Hewett, & Osmer 1994). Some of them could be foreground (active) galaxies at 0.04, 0.20, 0.37, 0.76, and 0.79, whose Br, Pa, [Fe ii]1.644, Pa, and [Fe ii]1.257 emission lines are redshifted into the bandpass of filters. These are most prominent emission lines of active galaxies in window (e.g., Simpson et al. 1996; Kawara, Nishida, & Taniguchi 1988; Goodrich, Veilleux, & Hill 1994). Actually, Tamura et al. (2001) found a galaxy at =0.132 whose is strong, = 3.410-17 ergs s-1 cm-2 by imaging observation. Thus, it seems unlikely that there exists cluster (group) of bright galaxies at 2.43.
In the fields of other pair/triple quasars, we detected no galaxies at redshifts of the common C iv absorption lines. There are at least four possible reasons as follows.
First, this could be because the star formation rates are too low to detect in the observed frames. The minimum and H flux we can detect in each observed frame is described in the previous section and summarized in Table 2. Typical s of individual field galaxies at 2 have been estimated to be 10–35M⊙ yr-1 (without dust extinction correction) by infrared imaging surveys with narrow-band filters and spectroscopic observations (e.g., Moorwood et al. 2000; Iwamuro et al. 2000). Similar is derived for Lyman break galaxies at 2–3, from spectroscopic observation based on H emission lines ( 20–70 M⊙ yr-1) with one exception (270 M⊙ yr-1) (Pettini et al. 1998). Juneau et al. (2005) also estimated s of field galaxies at 2 from UV continuum luminosities with dust extinction correction, and again got similar values ( 30 M⊙ yr-1). Teplitz et al. (1998) searched star forming galaxies at same redshift as metal absorption systems, and found 11 H emitters at = 2.3–2.5 within 250 kpc of quasar lines of sight. Their average is 50 M⊙ yr-1. The 3 detection limits of in Q0301/Q0302 fields are comparable or larger than the average at 2 in the literature. In this case, star forming galaxies could not be detected unless they have extremely large s. On the other hand, image depths of the other fields are enough to detect field star forming galaxies with typical s, which means that absorbers corresponding to C iv absorption lines could have lower s, compared with field galaxies at same redshift.
Second possible reason of no-detection is that typical star forming galaxies could be faint compared to the detection limits of our observations. At 2, an average magnitude of star forming galaxies detected based on metal absorption lines is 20.8 (Teplitz et al. 1998). On the other hand, of six fields observed, one (or four) fields were observed to provide deep images enough to detect such faint star forming galaxies with the 5 (or 3) detectability. Although observed images are very deep for most of the fields, these could not enough for some fields (i.e., Q0301 and Q2343 fields). We also confirmed that there was no number excess of galaxy counts in the fields around the pair quasars (Figure 5), compared with the global value of field galaxies around Subaru Deep Field (Maihara et al. 2001). Thus, we cannot yet reject existences of cluster (group) of galaxies in our pair/triple quasar fields, because they could contain only faint galaxies with 21.

Thirdly, it is also possible that our targetting fields did not cover star forming galaxies by chance. We calculated field coverage fractions (i.e., fraction of the area covered by our observations to the area of the pair quasar field222This means the area of circles on which all pair/triple quasars are located. For example, this area would be evaluated to be (150′′)2 for Q2343/Q2344 pair quasars that are separated by 300′′ from each other on the sky. Areas used here are the lower limit of the size of possible cluster (group) of galaxies, because member galaxies probably distribute outside of this circles if they really exist.). We got effectively large values as 75% and 33% for KP76/KP77/KP78 and Q2343/Q2344 fields, respectively, while the coverage fraction for Q0301/Q0302 field is very small, 2%. It seems unlikely that we happened to miss both star forming galaxies and a number excess of galaxies in the fields around KP76/KP77/KP78 and Q2343/Q2344 pair/triple quasars, if cluster of galaxies really exist. In the case of Q0301/Q0302 field, the result is still open to some uncertainties (e.g., coverage fraction could be underestimated, if galaxies are distributed not spherically but filamentally in the scale of 5Mpc along the pair quasars).
Finally, perhaps, most of C iv lines, whose counterparts were not identified, could arise in star forming pockets outside bright galaxies (e.g., the ejecta of Type Ia supernovae, dwarf galaxies, or low surface brightness galaxies), which have already been suggested as counterparts of weak ( 0.3 Å) Mg ii lines (Rigby et al. 2002). These pockets have multiple phases; kiloparsec scale higher ionization phase to produce C iv, and compact scale ( 10pc) low ionization phase with high density to produce Mg ii (Charlton et al. 2003). The redshift path density of weak Mg ii systems is twice of the strong Mg ii systems that have almost always corresponding luminous galaxies (Steidel 1995). Weak Mg ii systems also have high metallicity; solar or super-solar (Charlton et al. 2003). Nonetheless, corresponding luminous galaxies are rarely found within 50 kpc of the quasars (Churchill et al. 1999). All the properties of weak Mg ii systems are consistent with the no-detection of star forming galaxies in our observations.
With -band imaging observations, we placed photometric and
upper limits of H emitters corresponding to C iv absorption lines
toward the lines of sight of pair/triple quasars. Deeper imaging
surveys for wider fields that cover completely pair/triple quasar
fields are necessary before concluding whether galaxy clusterings
corresponding to metal absorption lines really exist or not. A large
number of multiple quasars also have recently been discovered by the
large scale surveys such as Sloan Digital Sky Survey (SDSS; Schneider
et al. 2005) and 2dF QSO Redshift Survey (2QZ; Croom et al. 2004),
which enable us to extend this survey in the future.
References
- Bergvall et al. (1997) Bergvall, N., Östlin, G., Karlsson, K. G., Örndahl, E., and Rönnback, J., 1997, A&A, 321, 771
- Bergeron and Boissé (1991) Bergeron, J., and Boissé, P., 1991, A&A, 243, 344
- Bertin and Arnouts (1996) Bertin, E., and Arnouts, S., 1996, A&AS, 117, 393
- Bunker et al. (1999) Bunker, A.J., Warren, S.J., Clements, D.L., Williger, G.M., and Hewett, P.C., 1999, MNRAS, 309, 875
- Charlton et al. (2003) Charlton, J.C., Ding, J., Zonak, S.G., Churchill, C.W., Bond, N.A., Rigby, J.R., 2003, ApJ, 589, 111
- Charlton and Churchill (1996) Charlton, J. C. and Churchill, C. W., 1996, ApJ, 465, 631
- Churchill et al. (1999) Churchill, C. W., Rigby, J. R., Charlton, J. C., and Vogt, S. S, 1999, ApJS, 120, 51
- Chen et al. (2001) Chen, H.-W., Lantezza, K. M., and Webb, 2001, ApJ, 556, 158
- Chen et al. (2001) Chen, H.-W., Lantezza, K. M., Webb, J. K., and Barcons, X., 2001, ApJ, 559, 654
- Cowie et al. (1995) Cowie, L.L., Songaila, A., Kim, T.-S., and Hu, E.M., 1995, AJ, 109, 1522
- Croom et al. (2004) Croom, S. M., Smith, R. J., Boyle, B. J., Shanks, T., Miller, L., Outram, P. J., and Loaring, N. S., 2004, MNRAS, 349, 1397
- Crotts and Fang (1998) Crotts, A. P. S., and Fang, Y., 1998, ApJ, 502, 16
- Dobrzycki et al. (1991) Dobrzycki, A., and Bechtold, J., 1991, ApJ, 377, 69
- Francis and Hewett (1993) Francis, P. J., and Hewett, P. C., 1993, AJ, 105, 1633
- Francis et al. (1996) Francis, P. J., Woodgate, B. E., Warren, S. J., Møller, P., Mazzolini, M., Bunker, A. J., Lowenthal, J. D., Williams, T. B., Minezaki, T., Kobayashi, Y., and Yoshii, Y., 1996, ApJ, 457, 490
- Francis, Woodgate, and Danks (1997) Francis, P. J., Woodgate, B., and Danks, A. C., 1997, ApJ, 482, 25
- Goodrich, Veilleux, and Hill (1994) Goodrich, R.W., Veilleux, S., and Hill, G.J., 1994, ApJ, 422, 521
- Hu and McMahon (1996) Hu, E.M., and McMahon, R.G., 1996, Nature, 382, 231
- Iwamuro et al. (2000) Iwamuro, F., Motohara, K., Maihara, T., Iwai, J., Tanabe, H., Taguchi, T., Hata, R., Terada, H., Goto, M., Ohya, S., Iye, M., Yoshida, M., Karoji, H., Ogasawara, R., and Sekiguchi, K., 2000, PASJ, 52, 73
- Iye et al. (2004) Iye, M., et al., 2004, PASJ, 56, 381
- Jakobsen et al. (1986) Jakobsen, P., Perryman, M. A. C., Ulrich, M. H., Macchetto, F., and di Serego Alighieri, S., 1986, ApJ, 303, 27
- Juneau et al. (2005) Juneau, S., et al., 2005, ApJ, 619, 135
- Kawara, Nishidat, Taniguchi (1988) Kawara, K., Nishida, M., and Taniguchi, Y., 1988, ApJ, 328, L41
- Kennicutt (1998) Kennicutt, R. C. Jr., 1998, ARA&A, 36, 189
- Lanzetta et al. (1998) Lanzetta, K. M., Chen, H.-W., Webb, J. K., and Barcons, X., 1998, invited review for IAU Colloquium 171, The Low Surface Brightness Universe
- LeFevre et al. (1996) LeFvre, O.L., Deltorn, J.M., Crampton, D., and Dickinson, M., 1996, ApJ, 471, 11
- Lu, Sargent, and Barlow (1998) Lu, L., Sargent, W.L.W., and Barlow, T.A., 1998, AJ, 115, 55
- Maihara et al. (2001) Maihara, T. et al., 2001, PASJ, 53, 25
- Moorwood et al. (2000) Moorwood, A.F.M., van der Werf, P.P., Cuby, J.G., and Oliva, E., 2000, A&A, 362, 9
- Motohara et al. (1998) Motohara, K., et al., 1998, in Proc. SPIE 3354: Infrared Astronomical Instrumentation, ed. A. M. Fowler, 659
- Pascarelle et al. (1996) Pascarelle, S.M., Windhorst, R.A., Driver, S.P., Ostrander, E.J., and Keel, W.C., 1996, ApJ, 456, 21
- Pentricci et al. (2000) Pentricci, L., Kurk, J. D., Röttgering, H. J. A., Miley, G. K., van Breugel, W., Carilli, C. L., Ford, H., Heckman, T., McCarthy, P., and Moorwood, M., 2000, A&A, 361, L25
- Pettini et al. (1998) Pettini, M., Kellogg, M., Steidel, C.C., Dickinson, M., Adelberger, K.L., and Giavalisco, M., 1998, ApJ, 508, 539
- Rigby, Charlton, and Churchill (2002) Rigby, J.R., Charlton, J.C., and Churchill, C., 2002, ApJ, 565, 743
- Roche et al. (2002) Roche P.F. et al. 2002, Proc Spie 4841, Instrument Design and Performance for Optical/IR Ground-Based Telescopes, eds. M Iye and A.F Moorwood
- Sargent, Boksenberg, and Steidel (1988) Sargent, W.L.W., Boksenberg, A., and Steidel, S.S., 1988, ApJS, 68, 539
- Schneider et al. (2005) Schneider, D. P., et al., 2005, astro-ph/0505679
- Shaver, Boksenberg, and Robertson (1982) Shaver, P. A., Boksenberg, A., and Robertson, J. G., 1982, ApJ, 261, 7
- Simpson et al. (1996) Simpson, C., Forbes, D.A., Baker, A.C., and Ward, M.J., 1996, MNRAS, 283, 777
- Smette et al. (1995) Smette, A., Robertson, J.G., Shaver, P.A., Reimers, D., Wisotzki, L., and Koehler, T., 1995, A&AS, 113, 199
- Songaila (1998) Songaila, A., 1998, AJ, 115, 2184
- Steidel (1995) Steidel, C.C., 1995, in QSO Absorption Lines, ed. G. Meylan (Garching: Springer Verlag), 139
- Steidel, Dickinson, and Persson (1994) Steidel, C. C., Dickinson, M., and Persson, S. E., ApJ, 437, 75
- Steidel (1990) Steidel, C.C., 1990, ApJS, 74, 37
- Teplitz, Malkan, and McLean (1998) Teplitz. H.I., Malkan, M., and McLean, I. S., 1998, ApJ, 506, 519
- Tamura et al. (2001) Tamura, N., Ohta, K., Maihara, T., Iwamuro, F., Motohara, K., Takata, T., and Iye, M., 2001, PASJ, 53, 653
- Warren et al. (1994) Warren, S. J., Hewett, P. C., and Osmer, P. S., 1994, ApJ, 421, 412
| (1) | (2) | (3) | (4) | (5) |
|---|---|---|---|---|
| Filter | aaCentral wavelength of the filter. | bbBandpass width of the filter with 50 % transmission. | ccRedshift of a star-forming galaxy whose H emission line is redshifted into the center of the filter. | / ddBandpass ratio of narrow-band to band filters in percent. |
| () | () | (%) | ||
| 2.122 eeFilter available with UKIRTUFTI. | 2.119 | 0.031 | 2.229 | 9.1 |
| 2.248S eeFilter available with UKIRTUFTI. | 2.253 | 0.035 | 2.433 | 10.3 |
| ffFilter available with SubaruCISCO. | 2.250 | 0.022 | 2.428 | 6.9 |
| ffFilter available with SubaruCISCO. | 2.120 | 0.020 | 2.230 | 6.3 |
| (1) | (2) | (3) | (4) | (5) | (6) |
|---|---|---|---|---|---|
| Field | Object | aaTotal flux of H emission line, without a correction for the effects of [N ii] line. | SFR bbStar formation rate in unit of solar-mass per year. | FWHM | |
| (mag) | (ergs s-1 cm-2) | (M⊙ yr-1) | (′′) | ||
| Q2343125 | A | 14.92 | 1.35 | 466 | 0.97 |
| B | 16.87 | 2.17 | 75 | 0.99 | |
| Q2344125 | C | 16.29 | 3.14 | 108 | 0.82 |
| D | 17.64 | 9.34 | 32 | 0.80 | |
| E | 18.28 | 5.67 | 20 | 0.65 |
| (1) | (2) | (3) | (4) | (5) | (6) | (7) | (8) | (9) | (10) | (11) | (12) | (13) |
|---|---|---|---|---|---|---|---|---|---|---|---|---|
| QSO | Ion | Filter | Date | Exposure | Seeing | 3 | 5 | ()a | SFR()b | Reference | ||
| (sec) | (′′) | (mag) | (mag) | (ergs s-1 cm-2) | (M⊙ yr-1) | |||||||
| KP76 c | 2.467 | 2.2462 | C iv, Si iv | K98 | May 24–25 2002 | 11760 | 0.42 | 21.39 | 21.03 | 6.8 | 1 | |
| 2.122 | May 24–25 2002 | 33100 | 0.42 | 20.91 | 20.39 | |||||||
| KP77/KP78 d | 2.526,2.605 | 2.2445,2.2417 | C iv, Si iv | May 14 2003 | 1440 | 0.40 | 21.09 | 20.42 | 1.8 | 1 | ||
| May 14 2003 | 5760 | 0.39 | 20.00 | 19.34 | ||||||||
| Q0301005 c | 3.223 | 2.4291 | C iv, Si iv | K98 | Dec 22–23 2002 | 4860 | 0.82 | 20.06 | 19.34 | 236 | 2 | |
| 2.248S | Dec 22–23 2002 | 11700 | 0.88 | 18.77 | 18.14 | |||||||
| Q0302003 c | 3.285 | 2.4233 | C iv, Si iv | K98 | Dec 22 2002 | 4860 | 0.48 | 21.07 | 20.44 | 23 | 2 | |
| 2.248S | Dec 22 2002 | 12600 | 0.50 | 20.15 | 19.59 | |||||||
| Q2343125 d | 2.515 | 2.4285,2.4308 | C iv | Nov 19 2000 | 3260 | 0.94 | 20.54 | 20.03 | 5.5 | 3 | ||
| Nov 19 2000 | 8640 | 0.93 | 19.21 | 18.51 | ||||||||
| Q2344125 d | 2.763 | 2.4265,2.4292 | C iv | Nov 7 2003 | 1920 | 0.52 | 21.14 | 20.52 | 3.2 | 3 | ||
| Nov 7 2003 | 5760 | 0.52 | 20.74 | 20.07 |
References. — (1) Crotts & Fang 1998; (2) Steidel 1990, Cowie et al. 1995; Dobrzycki & Bechtold 1991; (3) Teplitz et al. 1998