Swift XRT Observations of the Afterglow of GRB 050319
Abstract
Swift discovered the high redshift GRB 050319 with the Burst Alert Telescope and began observing with its narrow field instruments only 225 s after the burst onset. The afterglow X-ray emission was monitored by the XRT up to 28 days after the burst. The light curve shows a decay with three different phases, each characterized by a distinct slope: an initial steep decay with a power law index of 5.5, a second phase characterized by a flat decay slope of 0.54, and a third phase with a decay slope of 1.14. During the first phase the spectral energy distribution is softer than in the following two phases and the photon index is consistent with the GRB prompt spectrum. The extrapolation of the BAT light curve to the XRT band suggests that the initial fast decaying phase of the XRT afterglow might be the low energy tail of the prompt emission. The second break in the afterglow light curve occurs about s after the burst. The spectral energy distribution before and after the second break does not change and it can be tentatively interpreted as a jet break or the end of a delayed or continuous energy injection phase.
1 Introduction
The Swift Gamma-Ray Burst Explorer (Gehrels et al. 2004), successfully launched on 2004 November 20, is dedicated to the discovery and study of gamma-ray bursts and their X-ray and optical afterglows. Its fast autonomous pointing capability, compared to previous satellites, allows Swift to repoint towards GRB sources approximately 100 s after the burst detection by the Burst Alert Telescope (BAT) and to study, for the first time, the early phases of the afterglow evolution. Moreover, the very broad energy band allows for a simultaneous study of the afterglow in the optical, soft and hard X-ray bands.
The Burst Alert Telescope (Barthelmy et al. 2005a) on board Swift detected and located GRB 050319 at 09:31:18.44 UT (Krimm et al. 2005a). A re-analysis of the BAT data showed that the GRB050319 onset was 135 s before the trigger time given in Krimm et al. (2005a). The GRB light curve was characterized by several peaks, spaced out in time. The Swift spacecraft was slewing at the epoch of the GRB onset and the BAT trigger was switched-off. The GRB was recognized only during the last peak, 50-60 s after the end of the slew, activating the Swift GRB follow-up sequence. The measure of the entire burst duration yields a = 149.6 0.7 s. The time-averaged energy distribution was modeled by a simple power law with a photon index = 2.1 0.2 (90% confidence level) in the 20-150 keV energy range. The burst fluence over the interval in the 15-350 keV band was 1.6 10-6 erg cm-2. At the known redshift of 3.24, the isotropic equivalent –ray energy is 3.7 10erg 111We used =0.27, =0.73, =71 km s-1 Mpc-1. Given the soft spectrum of this burst (), the bolometric correction is small.
The spacecraft executed an immediate slew and promptly began observing with its narrow field instruments to monitor the afterglow. The X-Ray Telescope (XRT; Burrows et al. 2005) and the Ultraviolet and Optical Telescope (UVOT; Roming et al. 2004, 2005) were on target at 09:32:45.53 UT, 90 s after the BAT trigger, i.e. s after the burst onset. UVOT revealed a new source inside the BAT error circle at RAJ2000 = 10h16m47s.76(3), DecJ2000 = +43∘ 32 549(5) (Boyd et al. 2005). The source intensity faded, during a time interval of 17000 s, from 17.5 to 20.6 mag and from 18.8 to 21.2 mag in the and band, respectively. No signal was detected in the band with an upper limit of 19 mag. A full description of UVOT results is presented in Mason et al. (2005).
Ground-based follow-up observations were performed in different wavelength bands. ROTSE-IIIb detected a 16th mag fading source at RAJ2000 = 10h16m47s.9, DecJ2000 = +43∘32545, 27 s after the trigger. The intensity decreased to the 18th mag after 940 seconds (Rykoff et al. 2005) following a power law () with = 0.59 0.05 (Quimby et al. 2005). The intensity decay of the optical afterglow was confirmed by Kiso 1.05-m, Lulin 1-m, ART 14-inch and Mt. Maidanak 1.5-m telescopes (Yoshioka et al. 2005; Torii 2005; Sharapov et al. 2005a,b). Woz̀niak et al. (2005) presented extensive early-time photometry starting 25.4 s after the trigger. From their detailed light curve, one of the best sampled available to date, they infer a break time at about 450 s after the trigger with pre- and post-break slopes 0.37 and 0.91. Spectra of the GRB 050319 afterglow obtained by the Nordic Optical Telescope revealed several absorption features, including strong Ly, OI+SiII, SiIV and CIV. Their detection implies a redshift (Fynbo et al. 2005). GRB 050319 was also detected in the near infrared by the NICMOS camera in the PRL 1.2m telescope to a -band mag of about 13 (George et al. 2005) 6.2 hours after the burst. Radio 8.5 GHz observations with the Very Large Array did not detect a radio source at the position of the optical afterglow; the derived 2 upper limit was 70 Jy (Soderberg 2005a,b).
In the following, we report the results on the GRB afterglow observed by the Swift XRT. The details of the X-ray observations and the data reduction are described in Section 2; temporal and spectral analysis results are reported in section 3 and discussed in section 4 where we draw our conclusions.
2 Observations and Data Reduction
The Swift XRT is designed to perform automated observations of newly discovered bursts in the X-ray energy band 0.2-10 keV. Four different read-out modes have been implemented, each dependent on the count rate of the observed sky region. The transition between two modes is automatically performed on board (see Hill et al. 2004 for a detailed description on XRT observing modes).
XRT was on target 90 s after the BAT trigger and it observed GRB 050319 for 17 consecutive orbits for a total elapsed time of 105678 s. Moreover, GRB 050319 was further observed several times up to 28 days later. The observation log is presented in Table 1.
During the first observation, XRT observed in windowed timing (WT) and photon counting (PC) mode, in the later observations only PC mode was used. In the WT mode only the central of the field of view is read out, providing one dimensional imaging and full spectral capability with a time resolution of 1.8 ms. The PC mode provides, instead, full spatial and spectral resolution with a timing resolution of 2.5 seconds.
| Observation # | Start Time | End Time | Start Time since GRB onset | WT Exposure | PC Exposure |
|---|---|---|---|---|---|
| (yyyy-mm-dd hh:mm:ss) UT | (yyyy-mm-dd hh:mm:ss) UT | (s) | (s) | (s) | |
| 1 | 2005-03-19 09:33:02 | 2005-03-20 14:54:20 | 222.7 | 9443 | 12985 |
| 2 | 2005-03-24 01:52:04 | 2005-03-24 05:34:44 | 410120.0 | – | 986 |
| 3 | 2005-03-26 10:16:04 | 2005-03-28 10:50:53 | 607651.0 | – | 8486 |
| 4 | 2005-04-07 03:40:55 | 2005-04-07 19:48:45 | 1620708.0 | – | 2844 |
| 5 | 2005-04-08 03:48:41 | 2005-04-08 16:45:57 | 1707573.0 | – | 1101 |
| 6 | 2005-04-09 16:45:30 | 2005-04-11 05:57:21 | 1840723.0 | – | 3639 |
| 7 | 2005-04-13 01:28:15 | 2005-04-13 22:16:58 | 2131148.0 | – | 2397 |
| 8 | 2005-04-14 09:26:38 | 2005-04-14 14:30:58 | 2246250.0 | – | 754 |
| 9 | 2005-04-15 06:06:40 | 2005-04-15 21:00:59 | 2320473.0 | – | 3371 |
| 10 | 2005-04-16 01:20:12 | 2005-04-16 14:11:23 | 2389865.0 | – | 3891 |
XRT data were first processed by the Swift Data Center at NASA/GSFC to produce calibrated event lists (level 1 data products). They were therefore filtered and screened using the XRTDAS (v.1.2) software package to produce cleaned photon list files. Only observing time intervals with a CCD temperature below -50 degrees Celsius were used. Further non-standard selections were performed to remove time intervals with high background rate caused by either dark current or by the bright Earth limb. The total exposure after all the cleaning procedures were 9443 s and 40454 s for data accumulated in WT and PC mode, respectively. Hot and flickering pixels were further removed with an ad hoc procedure.
For the spectral analysis we used a 0-4 grade selection for data in PC mode. Such a selection provides the best combination of spectral resolution and detection efficiency. Ancillary response files were generated for each spectrum through the standard xrtmkarf task (v0.4.13) with an input mirror file obtained using experimental gold reflectivity coefficients derived by Owens et al. 1996. Response file swxpc0to4_20010101v007.rmf has been used to fit PC spectra.
For the timing analysis we selected events with 0-12 and 0-2 grades for the PC and WT data, respectively. This selection maximises the light curve statistics. Hereafter, errors are reported with a 90% single parameter confidence level.
The XRT times are referred to the GRB050319 onset 2005 Mar 19.39517 UT (2005 Mar 19, 09:29:02.70 UT).
3 Data Analysis
3.1 Spatial analysis
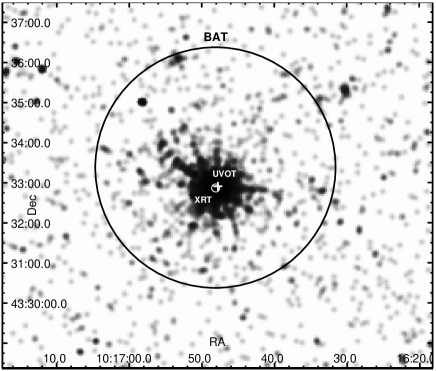
Fig. 1 shows the XRT image accumulated in PC mode with a 0.2-10 keV energy selection. The GRB afterglow position derived with xrtcentroid (v0.27) is RAJ2000 = 10h16m48s.1, DecJ2000 = +43∘524. The GRB position uncertainty is 6 (90% confidence level). This uncertainty is mostly due to the preliminary calibration of the boresight accuracy and to the residual misalignment between the XRT optical axis and the star trackers. The afterglow candidate position is consistent with the UVOT new source position (Boyd et al. 2005).
In the same figure we plot the XRT error box circle together with the BAT error box and the optical counterpart coordinates derived by UVOT. The XRT derived coordinates are from the BAT ones (Krimm et al. 2005a) and 49 from the optical counterpart (Boyd et al. 2005).
3.2 Timing analysis
During the first orbit the spacecraft was pointing 5.7 away from the BAT GRB centroid computed by the on board software, causing the GRB 050319 centroid to fall 4 pixels outside the XRT WT window. WT data from this orbit were extracted from a rectangular region 16 pixels wide at the boundary of the image strip. These counts were then corrected taking into account the Point Spread Function (PSF) fraction of the selected region. The correction factor was evaluated by weighting the energy dependent PSF by the counts extracted from the selected region. The selected extraction region amounts to about 14% of the XRT PSF. This correction allowed us to coherently include the first orbit WT data in the light curve together with PC data. The spacecraft pointing was corrected in the following orbits and the GRB image was centered in the WT window. All the following WT data were extracted in a rectangular region 40 pixels wide along the image strip that includes about 98% of the PSF.
The intensity of the source during the first four orbits is high enough to cause a pileup in the PC frames. In order to correct for the pileup, we extracted counts from an annular region with an outer radius of 30 pixels (708) and an inner radius of 6 pixels (1416). These values were evaluated by comparing the analytical PSF with the profile extracted in the first 30 seconds of observation when the intensity has the highest value. The extracted counts were corrected for the fraction of the PSF of the selected region. Again, the correction factor was evaluated by weighting the energy-dependent PSF by the counts extracted from the annular region. Such a region amounts to about 30% of the PSF. In the following 13 orbits data were extracted from the entire circular region of 30 pixels radius to have the maximum available statistics, particulary important in the last part of the afterglow decay light curve.
The background level for the WT light curve was extracted from a rectangular region 80 pixels wide, far from the source and affected by minimal contamination from other sources in the field. The background level for the PC data was extracted in an annular region with an inner radius of 50 pixels and an outer radius of 100 pixels centered on the source position and free from other sources contribution. The background values, normalized to the source extraction regions, were 2.1 10-3 counts s-1 and 5.0 10-2 counts s-1 for PC and WT, respectively. The background level did not vary with time and the same average values were then used over the whole light curve. In the first GRB observation, WT and PC data were binned in order to have a constant signal to noise ratio of 4.5. In the second and third observations (Table 1) the source is barely detectable. We extracted only one time bin for each of them with a significance of 2.0 and 2.6 standard deviations, respectively. From observation 4 to 10 we derived only an upper limit. Fig. 2 shows the background-subtracted light curve in the 0.2-10 keV energy band. The source is clearly fading with time.
We fit the X–ray light curve, using only data from the first observation. The light curve decay is not consistent with a single power law ( 2.0, with 78 d.o.f.). A broken power law ( for and for ) improves the fit, giving a break at 370 18 s from the GRB onset and a resulting 1.3 (76 d.o.f.). However, the residuals show a systematic trend with a negative slope after the break time. Adding a second break to the model ( for ; for and for ) the fit improves to a 0.75 (74 d.o.f.) and the Ftest yields a chance probability of 6.0 10-10. This last model reveals the presence of a second break at (2.7 0.7) 104 s. Table 2 shows the best fit results obtained with the three models. In Fig. 2 we also plot the best fit model obtained with the broken power law with two breaks. Moreover, Fig. 2 shows that the extrapolation of the best fit model is consistent with the detections obtained in the second and third observations and with the 3 upper limit of 4.43 10-14 erg cm-2 s-1 derived from observations 4-10. We also tried to fit the light curve with a power law or a single break broken power law allowing the reference time to be a free parameter. The did not improve, and the best fit was consistent with zero i.e. with the GRB onset) for the power law ( = 800 1000 s) and with a negative value (i.e. a time before the GRB onset) for the broken power law ( = -74 26 s).
We checked that our results are not affected by the PSF correction we applied on both PC and WT data: we produced a PC light curve by selecting counts only in the annular region of 6 and 30 pixels radii for all the first observation. Again the best fit model is a broken power law with two breaks; the best fit parameters are consistent within the errors with those reported in Table 2. In this case, however, the significance level of the second break is lower since this extraction region contains only 30% of the source counts.
| Parameter | Single power law | Broken power law | Double broken power law |
|---|---|---|---|
| 0.67 0.02 | 5.53 0.66 | 5.53 0.67 | |
| (s) | – | 370 18 | 384 22 |
| – | 0.65 0.0 | 0.54 0.04 | |
| (s) | – | – | (2.60 0.70) 104 |
| – | – | 1.14 0.2 | |
| (d.o.f.) | 2.02 (78) | 1.2 (76) | 0.75 (74) |
Note. — , and are the decay slopes for the distinct phases of the afterglow (see section 3.3). and are the epochs of the decay slope discontinuity, measured from the GRB onset.
3.3 Spectral analysis
The presence of two breaks in the decay light curve of GRB 050319 suggests looking for spectral variations across the breaks. We therefore extracted three spectra from the PC data of the first observation, corresponding to the three time intervals delimited by the two breaks. Hereafter we call them A, B and C. Spectrum A was extracted from the same annular region used for the timing analysis of the first four orbits. In the second interval pileup is still present but the lower intensity of the source allows us to reduce the inner radius of the annular region to 4 pixels. Thus, spectrum B is extracted from an annular region including 44% of the PSF. Spectrum C was extracted from the entire circular region of 30 pixels radius. We ignored energy channels below 0.2 keV and above 10 keV and rebinned the spectra to at least 20 counts per bin to allow the use of statistics. The background spectrum was extracted from the same region as for the timing analysis.
The spectrum of each interval was fitted with an absorbed power law with the absorption column density fixed to the Galactic value of 1.13 1020 cm-2 (Dickey & Lockman 1990). This model gives a good description of data for all the three spectra. A blackbody model does not reproduce the energy distribution of the three phase interval spectra ( 5). The photon index of spectrum A is significantly softer than the other two. The XRT spectra for the three intervals and the spectral residuals are shown in Fig. 3. Table 3 shows best fit parameters.
We checked for intrinsic absorption in the host galaxy by adding a redshifted observation component (ZWABS model in XSPEC v11.3.1) with redshift fixed to 3.24 (Fynbo et al. 2005). Only spectra B and C had enough counts to permit this test. The fits gave a value for the additional column density of (0.38 0.22) 1022 cm-2 and (0.37 0.35) 1022 cm-2 for B and C, respectively. However, the improvement in the fits is not significant.
The soft photon index in spectrum A is in agreement with the results from the hardness ratio analysis: the interval A yields a (3-10 keV)/(0.2-3 keV) of 0.075 0.02, the interval BC gives a value of 0.14 0.01.
| Parameter | A | B | C |
|---|---|---|---|
| Galactic (1020 cm | 1.13 | 1.13 | 1.13 |
| 2.60 0.22 | 1.69 0.06 | 1.8 0.08 | |
| (photons keV-1 cm-2 s-1 at 1 keV) | (1.7 0.3) 10-2 | (1.53 0.09) 10-3 | (3.96 0.3) 10-4 |
| Flux0.2-10keV (erg cm-2 s-1) | (9.2 0.8) 10-11 | (1.1 0.04) 10-11 | (2.68 0.13) 10-12 |
| (erg s-1) | 1.9 1049 | 8.3 1047 | 2.3 1047 |
| (d.o.f.) | 1.1 (9) | 1.4 (42) | 0.8 (18) |
Note. — is the photon index. is the isotropic luminosity calculated for a redshift . Fluxes and luminosities reported here are averaged over long time intervals. Accurate instantaneous values for the flux should be derived from Fig. 2.


4 Discussion
XRT monitored GRB 050319 X-ray emission from 220 s after the burst onset up to 28 days. The afterglow light curve is characterized by an initial steep decay () followed by a less rapid decline. Similar steep declines followed by a flattening have been observed in other GRB afterglows promptly detected by Swift thanks to its unprecedentedly fast repointing capability: GRB 050117a (Hill et al. 2005, in preparation), GRB 050126, GRB 050219a (Tagliaferri et al. 2005), and GRB 050315.
What is remarkable for the GRB 050319 X-ray afterglow is that the intensity decay cannot be modeled either by a simple power law or by a broken power law with only one break. The GRB050319 light curve of the first s after the trigger shows evidence of three different phases (A, B and C according to section 3.3), each of them characterized by a distinct decay slope (see Fig. 2 and Table 2). We also found that the extrapolation of phase C decay is consistent with the emission detected 8 days after the burst and with the flux upper limit measured after 28 days.
The spectral analysis shows that in phase A the spectral energy distribution is significantly softer () than in phases B and C, where the two are consistent; their weighted average is . This might indicate a different emission process acting during the initial phase of GRB 050319 afterglow.
Fig. 2 reports the extrapolation to the 0.2-10 keV band of the BAT prompt light curve. Fluxes were evaluated adopting a conversion factor computed by extrapolating the BAT spectral best fit model to the XRT energy band. The first steep phase of the afterglow light curve, extrapolated back to the trigger epoch, is consistent with the BAT fluxes. Moreover, the photon indices of the last peak of the prompt emission (2.2 0.2; Krimm et al. 2005b) and of the phase A X–ray afterglow (2.6 0.2; Table 3) are marginaly consistent within the errors. This indicates that the early, steep and soft X–ray afterglow might be the low energy tail of the last peak of the GRB emission. Thanks to the XRT better sensitivity and lower energy band we can in principle observe prompt emission in X–rays longer than in -rays. If our hypothesis is correct, the data of Phase A should be referred to the peak time of last spike of the prompt emission (= 137 s after the burst onset). In fact, the tails of each previous spike would largely have decayed at the time of the Phase A and only the last spike would be relevant. In such a way, we obtain a decay slope for segment A of 2.90.5 and the model extrapolation (see the inset in Fig. 2) back to the end of the prompt emission is marginaly consistent with the end of the BAT data. A more detailed analysis of the evidences recentely provided by Swift that early time X-ray fluxes can represent the lower energy tail of the prompt emission is presented in Barthelmy et al. 2005b. The authors use GRB050319 as one of the best examples. In this scenario the first break might be due to the emergence of the afterglow after fading of the GRB last peak emission.
The most straightforward interpretation of the second temporal break is a jet break. Within this scenario, a steepening of the observed emission occurs when the relativistic beaming angle of the emitted radiation becomes larger than the geometrical opening angle of the jet because of the deceleration caused by the interaction with the external medium. If we assume that the external medium is a uniform interstellar medium with particle density , then we can assume that emission in phases B and C is due to synchrotron radiation from shock-accelerated electrons in the slow cooling regime with , where is the cooling frequency. The latter is a standard condition in the X-ray band. The electron energy distribution index determines both the light curve slope and the spectral index before and after the jet break (Rhoads 1999). The temporal index before the jet break, when the spherical expanding shell model can be used, is expected to be = , while after the jet break = is foreseen. The spectral index is expected to remain unchanged before and after the break. This model is consistent with the second break of the GRB 050319 afterglow having , and for . Such a low value of the electron distribution index is not common in late afterglow fits, but could be generated by the mechanism discussed by Bykov & Mészáros (1996). According to this interpretation, the second break in the light curve would imply a jet opening angle of , where cm-3, is the break time, is the conversion efficiency of internal energy to -ray radiation and we used the values 3.24 and 3.7 erg for the redshift and the isotropic equivalent emitted energy in -rays respectively (Sari et al. 1999). This value of the opening angle is on the low-end tail of the observed distribution of jet opening angles presented by Bloom, Frail and Kulkarni (2003). Moreover, the time of this break is earlier than typical jet breaks which are seen at t s. Also, the initial and final slopes are both flatter than previous jet break observations.
A possibility to avoid low values and explain both the second break in the afterglow and the unusually flat decay slope during phase B is based on refreshed shocks (Sari & Mészáros 2000) or continuous energy injection from a Poynting flux dominated flow (Zhang & Mészáros 2002). Note that the phase C decay slope and spectral index are consistent with and for . This is what expected for fireball expansion in a uniform ISM when (here represents the typical X–ray frequency and is the characteristic frequency of synchrotron radiation from shock-accelerated electrons). Within this scenario, delayed energy injection due to the catching up of slower shells with the bulk of the expanding flow or long lasting emission from the central engine in the form of a Poynting flux dominated outflow could be responsible for the flatter decay of the afterglow in phase B. In this case a transition to the standard afterglow evolution (i.e. a break) with no remarkable spectral changes is expected when the addiditonal energy supply ends. Consequences of a continuously injecting central engine like a highly magnetized millisecond pulsar on GRB afterglow emission have been investigated by Zhang & Mészáros (2001). According to their analysis, for an injection law of the form , the injection would influence the fireball evolution if . A decay slope is expected for the afterglow light curve until injection stops. For GRB 050319, being and , we can derive –. This value would be explained by a central long–lived black hole–torus system with reduced activity. This interpretation would predict also a cooling break at later times with and becoming steeper by 1/4 and 1/2 respectively when the cooling frequency crosses the X–ray band. According to Panaitescu & Kumar (2000) the non detection of such a further break in the X–ray light curve up to about seconds after the trigger could be explained by a low density medium ( cm-3) and a low magnetic field in the post-shock fluid ().
A rich optical dataset is available for this burst, even if part of the data are badly calibrated. For an extended discussion about them we refer to Mason et al. (2005) and to Woźniak et al. (2005). About the latter paper, we only want to stress that, as the authors were unaware of the true GRB onset time s before the trigger, their break time and temporal slopes are referred to the trigger time. A very simple time shift of their data gives a break time at 614.20.6 s (not consistent with any of the breaks in the X–ray light curve) and slopes before and after the break equal to 0.710.06 and 1.000.07 respectively, with a of 3.3. The data are also consistent with a single power law decay with slope 0.840.03 (). With this new reference time, the presence of a break may even no longer be required: the introduction of a break time improves the fit, but the significance of the improvement is not compelling according to an F-test (chance probability ). The non correspondance of any of this slopes to what seen in X–rays is clearly challenging standard interpretations.
5 Acknowledgments
This work is supported at INAF by funding from ASI on grant number I/R/039/04, at Penn State by NASA contract NASS5-00136 and at the University of Leicester by the Particle Physics and Astronomy Research Council on grant numbers PPA/G/S/00524 and PPA/Z/ S00507. We gratefully acknowledge the contribution of dozens of members of the XRT team at OAB, PSU, UL, GSFC, ASDC and our subcontractors, who helped make this instrument possible.
References
- Barthelmy et al. (2005a) Barthelmy, S.D., et al. 2005a, Space Science Rev., in press
- Barthelmy et al. (2005b) Barthelmy, S.D., et al., 2005b, , submitted
- Boyd et al. (2005) Boyd, P., et al. 2005, GCN 3129
- Bloom, Frail & Kulkarni (2003) Bloom, J.S., Frail D.A. & Kulkarni, S.R. 2003, ApJ, 594,674
- Burrows et al. (2005) Burrows, D.N., et al. 2005, Space Science Rev., in press
- Bykov & Mészáros (1996) Bykov, A.M. & Mészáros, P. 1996, ApJ, 461, L37
- Fynbo et al. (2005) Fynbo, J.P.U., et al. 2005, GCN 3136
- (8) Dickey, J.M. & Lockman, F.J. 1990, ARA&A, 28, 215
- Gehrels et al. (2004) Gehrels, N., et al. 2004, ApJ, 611, 1005
- George et al. (2005) George, K., et al. 2005, GCN 3126
- Hill et al. (2004) Hill, J.E., et al. 2004, SPIE, 5165, 217
- Hill et al. (2005) Hill, J.E., et al. 2005, in preparation
- Krimm et al. (2005a) Krimm, H., et al. 2005a, GCN 3117;
- Krimm et al. (2005b) Krimm, H., et al. 2005b, GCN 3119
- Mason et al. (2005) Mason, K. et al. 2005, in preparation
- Panaitescu & Kumar (2000) Panaitescu, A. & Kumar, P. 2000, ApJ 543, 66
- Owens et al. (1996) Owens, A., Bayliss, S.C., Durham, P.J., Gurman, S.J. and Fraser, G.W. 1996, ApJ, 468, 451
- Quimby et al. (2005) Quimby, R.M., et al. 2005, GCN 3135
- Rhoads (1999) Rhoads, J.E. 1999, ApJ, 525, 737
- Roming et al. (2004) Roming, P.W.A., et al. 2004, SPIE, 5165, 262
- Roming et al. (2005) Roming, P.W.A., et al. 2005, Space Science Rev., in press
- Rykoff et al. (2005) Rykoff, E., Schaefer, B. & Quimby, R. 2005, GCN 3116
- Sari (1999) Sari, E., Piran, T. & Halpern J.P. 1999, ApJ, 519, L17
- Sari & Mészáros (2000) Sari, R., & Mészáros, P. 2000, ApJ, 535, L33
- Sharapov et al. (2005a) Sharapov, D., et al. 2005a, GCN 3124
- Sharapov et al. (2005b) Sharapov, D., et al. 2005b, GCN 3140
- Soderberg (2005a) Soderberg, A.M. 2005a, GCN 3127
- Soderberg (2005b) Soderberg, A.M. 2005b, GCN 3132
- Taglia (2005) Tagliaferri, G., et al., 2005, Nature, submitted
- Torii et al. (2005) Torii, K. 2005, GCN 3121
- Woz̀niak et al. (2005) Woz̀niak, P.R., et al. 2005, A&A, in press (astro-ph/0505336)
- Yoshioka et al. (2005) Yoshioka, T., et al. 2005, GCN 3120
- Zhang & Mészáros (2001) Zhang & Mészáros 2001, ApJ, 552, L35
- Zhang & Mészáros (2002) Zhang & Mészáros 2002, ApJ, 566, 712