LINER-like Extended Nebulae in ULIRGs: Shocks Generated by Merger Induced Flows
Abstract
In this work we studied the two-dimensional ionization structure of the circumnuclear and extranuclear regions in a sample of six low Ultraluminous Infrared Galaxies using Integral Field Spectroscopy. The ionization conditions in the extranuclear regions of these galaxies ( kpc) are typical of LINERs as obtained from the Veilleux-Osterbrock line ratio diagnostic diagrams. The range of observed line ratios is best explained by the presence of fast shocks with velocities of 150 to 500 km s-1, while the ionization by an AGN or nuclear starburst is in general less likely. The comparison of the two-dimensional ionization level and velocity dispersion in the extranuclear regions of these galaxies shows a positive correlation, further supporting the idea that shocks are indeed the main cause of ionization.
The origin of these shocks is also investigated. Despite the likely presence of superwinds in the circumnuclear regions of these systems, no evidence for signatures of superwinds such as double velocity components are found in the extended extranuclear regions. We consider a more likely explanation for the presence of shocks, the existence of tidally induced large scale gas flows caused by the merging process itself, as evidenced by the observed velocity fields characterized by peak-to-peak velocities of 400 km s-1, and velocity dispersions of up to 200 km s-1.
1 INTRODUCTION
Ultraluminous Infrared Galaxies (ULIRGs), defined as objects with an infrared luminosity similar to that of optically selected quasars () may be the local counterpart of some high-z galaxy populations (see Sanders & Mirabel, 1996; Genzel & Cesarsky, 2000; Frayer et al., 2003; Le Floc’h et al., 2004). Most (if not all) of them show signs of mergers and interactions (e.g. Clements et al., 1996; Scoville et al., 2000; Surace, Sanders, & Evans, 2000b; Borne et al., 2000) and it has been found that they could be the progenitors of intermediate-mass elliptical galaxies (Genzel et al., 2001; Tacconi et al., 2002, and references therein). They have large amounts of gas and dust and they are undergoing intense starburst activity. Some of these objects may harbor an active galacic nucleus (AGN) although its importance as source of energy in ULIRGs is still under debate.
The origin of the ionization of gas in these objects has been mainly studied in the innermost (nuclear) regions (e.g. Kim & Sanders, 1998). These studies show that of their nuclei have a LINER-like ionization independently of the luminosity while the fraction of Seyfert-like spectrum increases with luminosity. However, due to their complex structure, studies based on nuclear optical spectroscopy may lead to misclassifications. This can be due to several causes. For instance, the actual nucleus of the system may be obscured in the optical or, alternatively, the dominant region in the emission-line may not be coincident with the nucleus. An example where both effects have been reported is IRAS 12112+0305 (Colina et al., 2000). In addition, standard slit spectroscopic observations may be affected by other type of technical uncertainties like, for instance, misalignment of the slit, differential atmospheric refraction, etc.
ULIRGs, as systems that are undergoing an intense starburst activity phase (and with AGN activity in some cases), are good candidates to produce superwinds (see Veilleux, Cecil & Bland-Hawthorn, 2005). Evidence of superwinds has already been reported in several systems, on the basis of the properties of the emission (Heckman, Armus, & Miley, 1990; Lehnert & Heckman, 1996; Arribas et al., 2001) and absorption (Heckman et al., 2000; Rupke et al., 2002, 2005a, 2005b; Martin, 2005) lines. Although superwinds are probably playing a role in the ionization of the circumnuclear region of ULIRGs, their importance in the extranuclear regions is unclear. In them, tidally induced forces associated to the interaction process itself has been also proposed as the mechanism responsible of shocks (McDowell et al., 2003; Colina et al., 2004).
The present article is focused in the study of the 2D structure and mechanisms of ionization of six ULIRGs based on the use of Integral Field Spectroscopy (IFS). This observational technique is well suited for this goal since it allows to obtain simultaneously spectral information of in a 2D field. The present work is part of a program aimed at studying the internal structure and kinematics of (U)LIRGs, on the basis of this technique and high-resolution images obtained with HST (see Colina et al., 2005, and refereces therein). The paper is structured as follows: In section §2, we briefly describe the sample of galaxies analysed and summarize how observations where performed. In section §3, the reduction process and data analysis are described. Section §4 presents the results obtained both in the external parts and the nuclear regions and discuss the mechanisms responsible of the observed ionization. Section §5 summarize the main conclusions.
Thoroughout the paper, a Hubble constant of 70 km s-1 Mpc-1 is assumed. This implies a linear scale between 0.89 and 2.58 kpc arcsec-1 for the systems analyzed.
2 SAMPLE AND OBSERVATIONS
2.1 The Sample of Galaxies
The sample of galaxies consists of six low-z ULIRGs (see general properties in table 1) covering a relative wide range of dynamical states of the merging process. Three of the galaxies (IRAS 08572+3915, IRAS 12112+0305, and IRAS 143481447) are interacting pairs separated by projected distances of up to 6 kpc, while the rest of the galaxies (IRAS 15206+3342, IRAS 15250+3609, and IRAS 172080014) are more evolved, single nucleus ULIRGs, some with a light profile and overall kinematics close to that of intermediate mass ellipticals (e.g. IRAS 172080014, Genzel et al. 2001). The two-dimensional kinematic properties (velocity field and velocity dispersion) have been studied in detail before using integral field optical spectroscopy (see Colina et al. 2005 and references therein).
The complexity of the two-dimensional ionization field in these galaxies is such that previous long-slit spectroscopic studies have classified the nucleus of several of the galaxies differently. For example, IRAS 08572+3915 was originally classified as Seyfert 2 (Sanders et al., 1988) although both nuclei were classified as LINERs later on (Kim & Sanders, 1998); IRAS 143481447 has been classified either as LINER (Kim & Sanders, 1998) or Seyfert 2 (Sanders et al., 1988); IRAS 15206+3342 has been identified both as a Seyfert 2 (Sanders et al., 1988; Surace & Sanders, 2000a) and as an H ii (Kim & Sanders, 1998), and IRAS 15250+3609 is classified both as H ii and LINER (Kim et al., 1995; Baan et al., 1998). The other two galaxies, IRAS 12112+0305 and IRAS 172080014 are classified as LINER (Veilleux et al., 1999) and H ii (Kim et al., 1995), respectively. Our IFS data disagree with some of the previous classifications, in particular the two nuclei of IRAS 08572+3915 are classified as H ii (Arribas et al. 2000), and the true, optically hidden, nucleus of IRAS 172080014 is classified as a LINER (Arribas & Colina, 2003).
2.2 Observations
Data were obtained with the INTEGRAL system (Arribas et al., 1998) plus the WYFFOS spectrograph (Bingham et al., 1994) in the 4.2 m WHT at the Observatorio del Roque de los Muchachos (Canary Islands). Spectra were taken using the fiber bundle SB2 and a 600 lines mm-1 grating with an effective resolution of 4.8 Å. Fibers in an INTEGRAL bundle are arranged in two sets: most of them (189 for SB2) form a rectangular area centered on the object while the rest of them form a circle around it and observe simultaneously the sky. In the case of SB2 the covered field is of 165123. Data were taken under photometric conditions and the seeing was of 10–15 except for the 1 April 1998 observing run when it was about 20. Table 2 summarises the parameters of the observations. Besides, HST imaging in the I-band (WFPC2 F814W filter) is available for all of them and, with the exception of IRAS 15206+3342 (catalog ), also in the H-band (NICMOS F160W filter).
3 DATA REDUCTION AND ANALYSIS
The basic reduction process includes bias subtraction, scattered light removal, extraction of the apertures, wavelength calibration, throughput and flatfield correction, sky substraction, cosmic ray rejection and relative flux calibration. Though it is not strictly necessary for the present paper, an absolute flux calibration was also performed (Monreal-Ibero, 2004).
For the present analysis the strongest optical emission lines including [O i], H, [N ii] and [S ii] have been used. Each emission line profile was fitted to a single Gaussian function using the DIPSO package inside the STARLINK environment111http://www.starlink.rl.ac.uk/. The set of lines H+[N ii]6548,6584 was fitted simultaneously, fixing the separation in wavelength between the three lines, assuming that all lines had the same width and fixing the ratio between the nitrogen lines to 3. Sulfur lines were fitted fixing the distance between them and assuming the same width for both lines. In all cases, a constant value was assigned to the local continuum. A single (gaussian) component is in general a good representation of the observed line profiles, with the exception of some nuclear regions. For these regions a two-component fit was necessary. The ionized gas velocity dispersion was derived from the H line width (after subtracting the instrumental profile in quadrature).
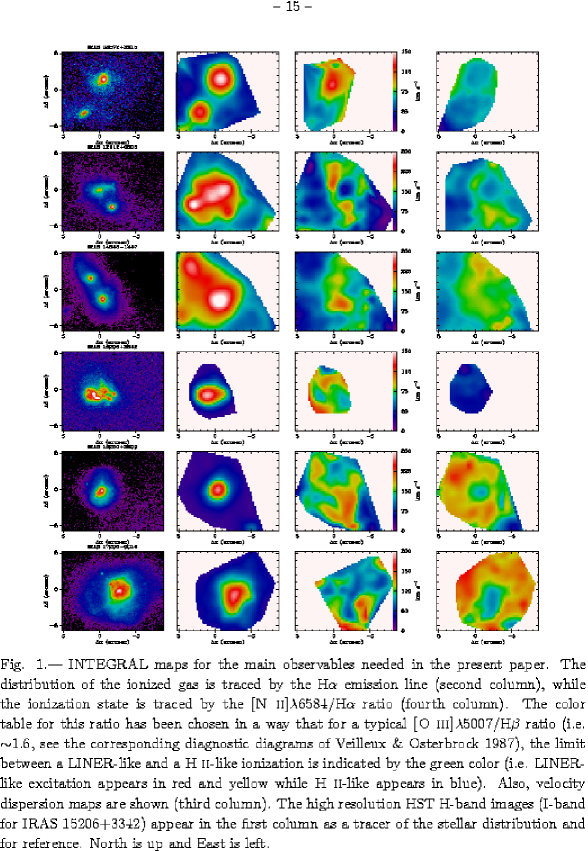
To study the ionization state, the line ratios [O i]6300/H, [N ii]6584/H and [S ii]6717,6731/H were calculated for each spectrum. Since the H emission line was detected in an area substantially smaller than for the H, these line ratios were not corrected from extinction. For the [N ii]6584/H ratio, the two lines involved are so close one from the other that reddening is negligible. In the case of the [S ii]6717,6731/H ratio, if extinction is moderate, the value of the ratio may change slightly, while in the regions where it is more elevated (), the extinction produces somewhat smaller ratios (typically by 0.1 dex). However, this small difference does not change the main conclusions of the present analysis. To better visualize the spatial distribution of the relevant magnitudes (e.g. H flux, velocity dispersion, [N ii]6584/H), two-dimensional images (maps) were created using a Renka & Cline two-dimensional interpolation method (Fig. 1). All theses images have 8181 pixels, with an scale of 021 pix-1.
4 RESULTS AND DISCUSSION
The kinematical properties of the galaxies under analysis have already been studied by Colina et al. (2005), who conclude that the global motions of the gas (i.e. velocity fields) are dominated by merger-induced flows, showing peak-to-peak velocity differences of 400 km s-1. Only one out of our six systems (IRAS 172080014 (catalog )) shows clear evidences of ordered rotational motions although there are also some hints of rotation in IRAS 08572+3915 (catalog ). The ionized gas velocity dispersion maps revealed high-velocity regions (70-200 km s-1) that do not trace any special mass concentration.
In the following section, we discuss the results derived from Figure 1, and in particular those from the H and velocity dispersion maps.
4.1 Two-dimensional Ionization Structure of the extranuclear Emission Line Nebulae
Typical values of [O iii]5007/H in the brightest regions of these galaxies are around 1–2.5. Assuming similar values for fainter regions (where this ratio cannot be obtained due to the faintness of the lines), the [N ii]6584/H ratio can be used to distinguish between LINER and H ii-like ionization (see the diagnostic diagrams of Veilleux & Osterbrock, 1987).
In general, the [N ii]6584/H maps (see Fig. 1) show a complex ionization structure. According to this ratio, LINER-like emission is found in the extended extranuclear regions in three systems: IRAS 143481447 (catalog ), IRAS 15250+3609 (catalog ), and IRAS 172080014 (catalog ). Contrary, for IRAS 08572+3915 (catalog ), IRAS 15206+3342 (catalog ) and IRAS 12112+0305 (catalog ) this line ratio suggests a dominant H ii-like ionization.
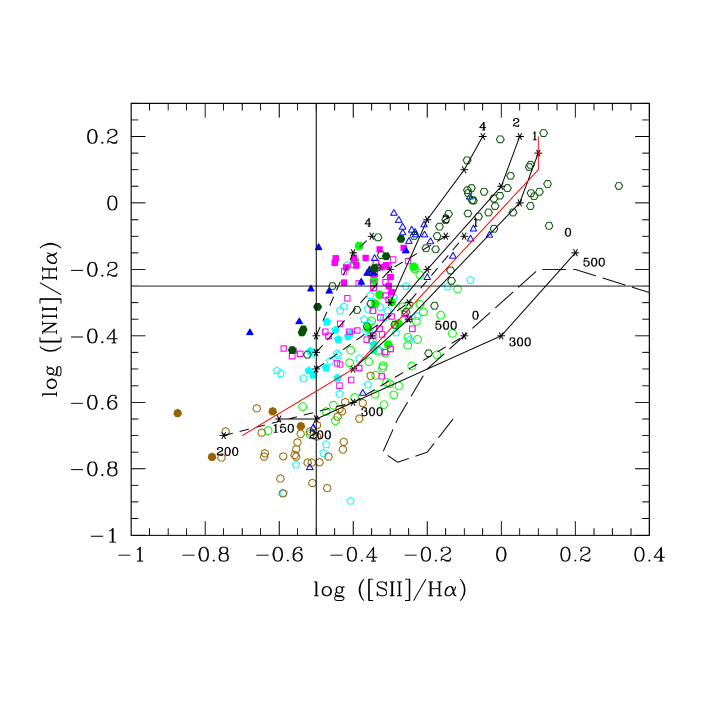
Similarly, the [S ii]6717,6731/H and the [O i]6300/H ratios have also been obtained, although in smaller field due to poorer signal (the maps are not shown, but individual values are presented in Figures 2 and 4). As discussed by Dopita & Sutherland (1995), these line ratios, and specially [O i]6300/H, are more reliable in distinguishing between H ii and LINER like ionization. It is interesting to note that in general these line ratios indicate an ionization state higher than that inferred from the [N ii]6584/H ratio. This is shown in Figure 2, which shows the [N ii]6584/H vs. [S ii]6717,6731/H for all the individual spectra/regions of the six systems of the sample ([S ii]/H instead of [O i]/H has been selected for this plot since it covers a larger 2D region). In this figure, vertical and horizontal lines represent the frontier between H ii and LINER type of ionization. Many more spectra are classified as LINER according the [S ii]6717,6731/H ratio (i.e. points located to the right of the vertical line) than according to [N ii]6584/H (i.e. points above the horizontal line). In addition, most of the data points are located either in the LINER-like region according to both line ratios (i.e. upper right quadrant) or in the region where the [S ii]6717,6731/H ratio is typical of LINER but [N ii]6584/H typical of H ii regions (i.e. right bottom quadrant).
For the shake of the following discussion we define circumnuclear regions as those confined within the central 3 arcsec (i.e. r 1.5 arcsec, and it is covered by 6 fibers/spectra), and extranuclear regions those which typically extends for several kpc outwards of this region (i.e. r 1.5 arcsec). In Fig. 2 we represent the circumnuclear and extranuclear regions with solid and open symbols, respectively. Note that the circumnuclear region corresponds roughly with the areas studied previously via long-slit spectroscopy. The circumnuclear data in this plot seem to be distributed in a more compact region, where the extranuclear data cover in general a wider range of these line quotients.
In order to investigate the different ionization alternatives, the line ratios predicted by different mechanisms are shown in Figure 2. Based in the apparent continuity between LINER and Seyfert spectra, along with the discovery of X-ray emision and the existence of a wide component in the H emision line of some LINERs, photoionization by a power law spectrum coming from an AGN has been proposed as a possible ionizing mechanism (e.g. Ho, Filippenko, & Sargent, 1993; Groves et al., 2004). Although some of these models could in principle explain the line ratios measured in the circumnuclear regions, none of the nuclei of the sample is clearly located in the region identified by these models (see Figure 2, where we have shown one of the models of as example). In general, the circumnuclear data show either an H ii like spectra (indicative of an intense star formation) or spectra of compound nature (LINER+H ii). This agrees with the classification in the mid-infrared for these objects (Taniguchi et al., 1999; Rigopoulou et al., 1999) that includes them in the group of starburst using the line-to-continuum ratio of PAH at m.
Regarding the extranuclear regions, the AGN models (Ho, Filippenko, & Sargent, 1993; Groves et al., 2004) are not, in general, likely to be representative of these low-density ( cm-3) regions, as it is also indicated by the relatively small fraction of data points located within the area defined by these models. However it is interesting to note that the case of IRAS 172060014 may represent an exception in this context (see discussion in 4.2). In short, although we cannot discard a possible contribution of AGN-like ionization in some regions, clearly this mechanism cannot explain in general the observed lines ratios represented in Figure 2.
Ionization by young stars could be an obvious alternative mechanism to explain the line ratios. Barth & Shields (2000) have shown that starburst models during the Wolf-Rayet dominated phase can explain the spectra of some LINERs, but only under very restricted conditions. In Figure 2 we have plotted the Barth & Shields’ model that best fits the locus of our data as a red line. This corresponds to an instantaneous burst model of 4 Myr, , Initial Mass Function (IMF) power-law slope of 2.35 and M⊙ and an interstellar medium characterized by an electron density () of 103 cm-3. These conditions are very unlikely to be representative of the extranuclear regions of all these ULIRGs, especially taking into account the relatively young and short-lived population involved (i.e. for clusters younger than 3 Myr or older than 6 Myr, and for models with a constant star formation rate, the softer ionizing continuum results in an emission spectrum more typical of H ii regions. Furthermore, the fraction of ULIRGs with hints of WR signatures in their spectrum (i.e. broad optical feature at 4660 Å) is less than 10% (Armus et al., 1989).
The most likely mechanism to explain the observed ionization in the extended, extranuclear regions is the presence of large scale shocks. Figure 2 presents the predicted line ratios for a representative set of shock models (Dopita & Sutherland, 1995). These ratios agree with the range of observed values for shock velocities of 150 km s-1 to 500 km s-1 in either a neutral (continuous lines), or a pre-ionized medium (dashed lines). Moreover, such high speed flows are routinely detected in the extranuclear regions of ULIRGs as shown by detailed two-dimensional kinematic studies (Colina et al., 2005). Velocity fields inconsistent in general with ordered motions, and with typical peak-to-peak velocities of 200 to 400 km s-1 are detected in the tidal tails, and extranuclear regions of ULIRGs on scales of few to several kpc away from the nucleus, and almost independent of the dynamical phase of the merger (see Colina et al., 2004, 2005, and references therein). Moreover, the presence of highly turbulent gas, as identified by large velocity dispersions of 70 to 200 km s-1 (Colina et al. 2005), further supports the scenario of fast shocks as the main ionization mechanism in these regions.
In summary, the ionization of the extranuclear regions in the ULIRGs studied here, can be hardly explained by accretion powered AGN or by young starbursts, but is consistent with fast, large scale shocks.
4.2 Excitation and Velocity Dispersions: Further Evidence for Ionization by Shocks
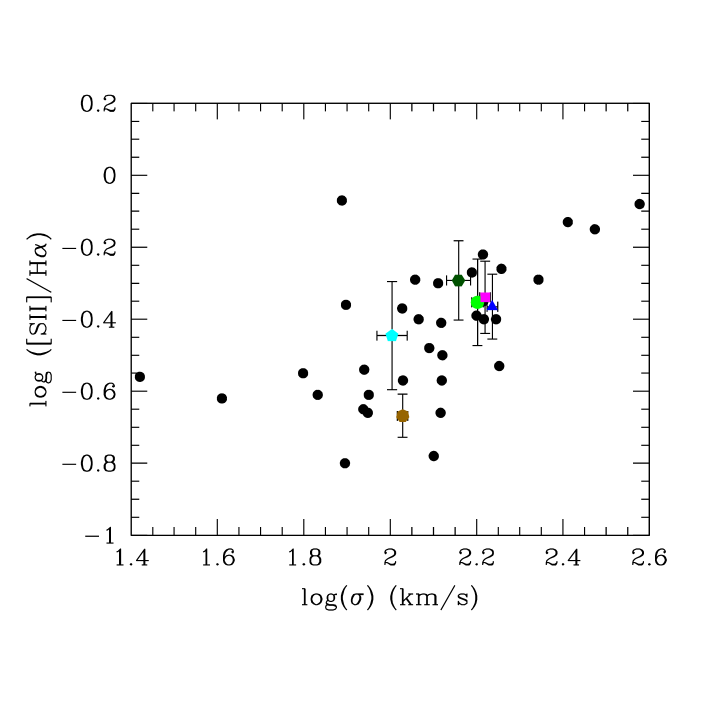
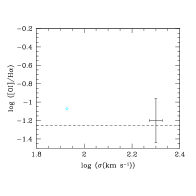
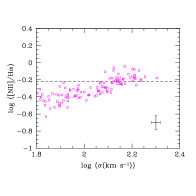
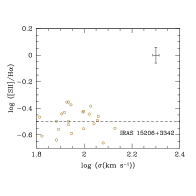
The positive correlation between the velocity dispersion and ionization found by some authors using circumnuclear (slit) spectra of ULIRGs has been considered as further evidence supporting the presence of shocks in these objects (Armus et al., 1989; Dopita & Sutherland, 1995; Veilleux et al., 1995). The present study also supports the correlation previously observed. As shown in Figure 3, the [S ii]6717,6731/H and velocity dispersion values derived from the integrated spectra – i.e. combining the individual spectra for each object, are consistent with previous results (Armus et al., 1989). However, these spectra are not necessarily representative of the extranuclear regions.
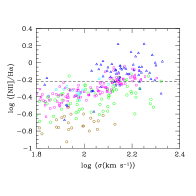
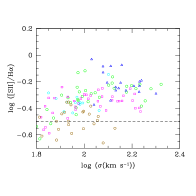
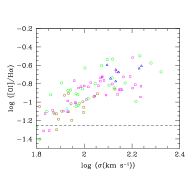
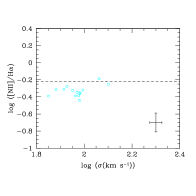
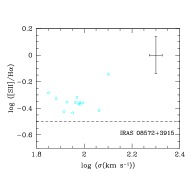
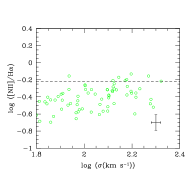
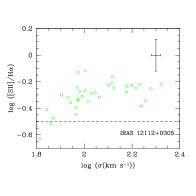
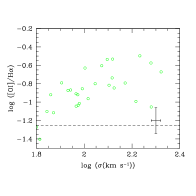
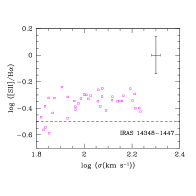
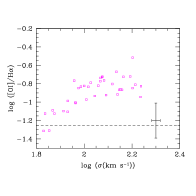
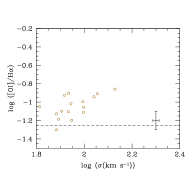
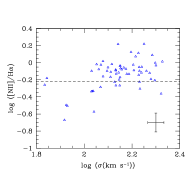
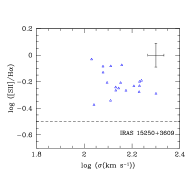
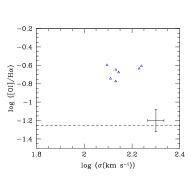
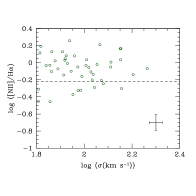
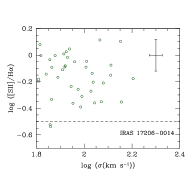
In Figure 4 we present similar plots, but now each data point represents the value for a specific spectrum (fiber) (i.e. different position in the extranuclear nebula) but excluding the circumnuclear region, for each individual galaxy, and using three different line ratios ([N ii]6584/H, [S ii]6717,6731/H, [O i]6300/H). The dashed horizontal lines indicate the borderline between H ii and LINER ionization. In the top panels the data for the individual galaxies (except IRAS 172080014, see below) are combined. These panels indicate that, while the correlation of the velocity dispersions with the line-ratio is not so well defined for [N ii]6584/H, for the other two line ratios, and specially [O i]6300/H (i.e. the most reliable diagnostic ratio to detect ionization by shocks according to models by Dopita & Sutherland, 1995), the correlation is clear. The fact that the extranuclear data of these five systems follow a well defined relation between the line-ratio and the velocity dispersion reinforces the idea that shocks are also the dominant ionization source at large scales ( 2-3 kpc). Individually, two systems, IRAS 12112+0305 and IRAS 143481447, show a clear correlation in the three line ratios. For three of the remaining systems, IRAS 08572+3915,IRAS 15206+3342 and IRAS 15250+3609, the range in velocity dispersion is relatively small to show the correlation.
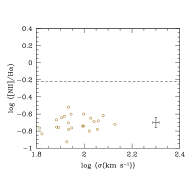
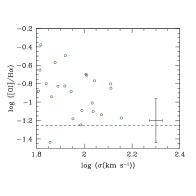
Finally, IRAS 172080014 does not follow the mean behavior observed in the other systems, showing a wider range of line ratio values. This galaxy has been studied in detail by Arribas & Colina (2003) and Colina et al. (2005), and it is the only clear case in this sample showing rotation on scales of several kpc. This may be an indication that this system is in a different (probably more evolved) dynamical phase and/or it has had a different merging history. At any event, the fact that the gas kinematics indicates a more relaxed and virialized system suggests that shocks are not the dominant ionization mechanism in this galaxy and, therefore the above mentioned correlation should not be expected. For this galaxy the origin of the LINER-like ionization in the extranuclear region should be different (note that the three line ratios shown in Fig. 4 are consistent with LINER-like ionization). A hint that this is the case comes from the detection of an extended ( 4 kpc) hard X-ray nebula in this galaxy (Ptak et al., 2003), which would provide an ionizing spectrum similar to that of an AGN. This may explain the fact that the excitation of this object is higher than that of the rest of the galaxies and similar to that expected from a low luminosity AGN (Fig.2; Ho, Filippenko, & Sargent, 1993).
4.3 Origin of the Shocks in the Circumnuclear and Extranuclear Regions: Superwinds and Merger Induced Flows
In previous sections shocks have been identified as the main ionization mechanism in the extended, extranuclear ionized regions. Moreover, the detection of a positive correlation between the ionization status of the gas, as best indicated by the shock tracer [O i]6300/H ratio, and the velocity dispersion of the gas, suggests a direct causal relation between the LINER ionization and the presence of shocks. What is the origin of the shocks in the circumnuclear, and in the extranuclear regions extended at distances of up to 10-15 kpc from the nucleus? Some authors have found evidence supporting the existence of so-called superwinds generated by the combined effect of massive stars winds and supernova explosions in intense nuclear starbursts (Heckman, Armus, & Miley, 1990). These superwinds, identified by the presence of kinematically distinct components in the profiles of the emission (Heckman, Armus, & Miley, 1990) or absorption lines (Martin, 2005; Rupke et al., 2005a, b), generate shocks in the circumnuclear regions as the stellar winds move through the interstellar medium.
Recent studies in a large sample of LIRGs and ULIRGs conclude that the presence of superwinds has to be an almost universal phenomenon in the circumnuclear regions of ULIRGs (typical angular sizes of about of 1′′ or 1 to 2 kpc, depending on redshift) as kinematically distinct components of the neutral interstellar NaD lines, blueshifted by a median velocity of 350 km s-1 are detected in at least 70% of ULIRGs (Martin, 2005; Rupke et al., 2005a, b). These velocity components are also detected in our integral field spectra for some systems. Out of the six galaxies in the sample, our data show the presence of double H line profiles in the circumnuclear regions of the northern and southern nucleus of the interacting pairs IRAS 12112+0305 and IRAS 143471448 (see Figure 5). These secondary velocity components are blueshifted with respect to system by 150 km s-1 and 300 km s-1, respectively. In addition to these galaxies, similar signatures have been identified in the circumnuclear regions of more evolved ULIRGs such as IRAS 15250+3609 ( km s-1, Monreal-Ibero 2004), and Arp 220 (peak-to-peak velocity of 1000 km s-1, Arribas et al., 2001). However, our IFS data show that the presence of double components, when detected, is always confined to the nuclear and circumnuclear regions, i.e. distances of 1 to 2 kpc from the nucleus. The lack of detection of double components in the extranuclear regions, at distances of several kpc away from the nucleus, can be interpreted as if the high velocity outflows associated with the nuclear superwinds were not present at these distances, or as if they were of much lower amplitude (less than 100 km s-1), therefore not been detected as kinematically distinct components with the present spectral resolution.
On the other hand, the complex two-dimensional velocity field and velocity dispersion structure of the extranuclear ionized regions of ULIRGs (Colina et al., 2004, 2005) shows in general large velocity gradients with peak-to-peak velocities of few to several hundreds km s-1 associated with tidal tails and extranuclear regions at distances of several kpc away from the massive circumnuclear starbursts. Moreover, the largest values of the velocity dispersion in many ULIRGs (up to 200 km s-1) are detected not in the nucleus but in extranuclear regions (Colina et al., 2005), implying therefore the presence of an extended, highly turbulent medium on kpc-size scales. As shown by specific models of the nearest ULIRG, Arp 220, tidally induced flows lead to relative gas velocities that are much larger than the original impact velocities of the galaxies (McDowell et al., 2003), and therefore high speed flows of several hundreds km s-1 are a natural consequence of the merging process associated with ULIRGs. The presence of these tidally induced, high velocity flows and highly turbulent medium will generate shocks that in turn will heat and ionize the interstellar medium producing the observed LINER type spectra as in the nearest ULIRG, Arp 220 (McDowell et al., 2003; Colina et al., 2004).
In short, the lack of superwind signatures and the kinematic properties of the gas in the extranuclear regions, supports the idea that merger induced flows are the origin of the fast shocks producing the LINER-like excitation in these extended regions.
5 CONCLUSIONS
Integral Field Spectroscopy with the INTEGRAL fiber system has been used to analyze the circumnuclear and extranuclear ionization structure of six low- ULIRGs. The main results can be summarized as follows:
-
1.
The two-dimensional ionization characteristics of the extranuclear regions of these galaxies correspond to these of LINERs. This is clearly indicated by the [S ii]6717,6731/H and especially the [O i]6300/H line ratios which allow to discriminate reliably between the H ii and LINER ionization in low excitation conditions (i.e. [O iii]5007/H 2.5).
-
2.
The observed LINER-type line ratios in the extranuclear regions are in general better explained with ionization by fast shocks with velocities of 150 to 500 km s-1, rather than with AGN or starburst photoionization. Further evidence pointing to shocks as the dominant source of ionization comes from a positive correlation between the ionization state and the velocity dispersion of the ionized gas. The present two-dimensional data show that this correlation holds especially if the [O i]6300/H line ratio is used.
-
3.
Although signatures for superwinds are observed in the circumnuclear regions of some systems, no kinematic evidence for such a mechanism is found in the extranuclear regions. Alternatively, the shocks that produce the observed LINER-type ionization in the extranuclear regions could be due to a different phenomenon. Taking into account the general 2D kinematic characteristics of the extranuclear regions in these objects, which indicate disordered motions with peak-to-peak velocities of about 400 km s-1, and velocity dispersions of up to 200 km s-1, the origin of the shocks are most likely caused by tidally induced large scale flows produced during the merging process.
-
4.
The galaxy IRAS 172080014 presents a peculiar kinematical and ionization structure. For this galaxy the origin of the LINER-type ionization in the extranuclear region is most likely explained by the presence of the recently detected hard X-ray extended (4 kpc) emission that would produce an ionizing spectrum similar to that of an AGN. This may explain the fact that the excitation of this object is higher than that of the rest of the galaxies, and compatible with that expected in low luminosity AGNs.
References
- Armus et al. (1989) Armus, L., Heckman, T. M., & Miley, G. K. 1989, ApJ, 347, 727
- Arribas & Colina (2003) Arribas, S. & Colina, L. 2003, ApJ, 591, 791
- Arribas et al. (2001) Arribas, S., Colina, L., & Clements, D. 2001, ApJ, 560, 160
- Arribas et al. (1998) Arribas, S. et al. 1998 Proc. SPIE, 3355,821
- Baan et al. (1998) Baan, W. A., Salzer, J. J., & Lewinter, R. D. 1998, ApJ, 509, 633
- Barth & Shields (2000) Barth, A. J. & Shields, J. C. 2000, PASP, 112, 753
- Bingham et al. (1994) Bingham, R. G., Gellatly, D. W., Jenkins, C. R., and Worswick, S. P. 1994, Proc. SPIE, 2198, 56
- Borne et al. (2000) Borne, K. D., Bushouse, H, Lucas, R. A., and Colina, L. 2000, ApJ, 529, 77
- Clements et al. (1996) Clements, D. L., Sutherland, W. J., McMahon, R. G., and Saunders, W. 1996, MNRAS, 279, 477
- Colina et al. (2005) Colina, L., Arribas, S., & Monreal-Ibero, A. 2005, ApJ, 621, 725
- Colina et al. (2004) Colina, L., Arribas, S., & Clements, D. 2004, ApJ, 602, 181
- Colina et al. (2000) Colina, L., Arribas, S., Borne, K. D., & Monreal, A. 2000, ApJ, 533, L9
- Dopita & Sutherland (1995) Dopita, M. A. & Sutherland, R. S. 1995, ApJ, 455, 468
- Frayer et al. (2003) Frayer, D. T., Armus, L., Scoville, N. Z., Blain, A. W., Reddy, N. A., Ivison, R. J., & Smail, I. 2003, AJ, 126, 73
- Genzel & Cesarsky (2000) Genzel, R. & Cesarsky, C. J. 2000, ARA&A, 38, 761
- Genzel et al. (2001) Genzel, R., Tacconi, L. J., Rigopoulou, D., Lutz, D., & Tecza, M. 2001, ApJ, 563, 527
- Groves et al. (2004) Groves, B. A., Dopita, M. A., & Sutherland, R. S. 2004, ApJS, 153, 9
- Heckman, Armus, & Miley (1990) Heckman, T. M., Armus, L., & Miley, G. K. 1990, ApJS, 74, 833
- Heckman et al. (2000) Heckman, T. M., Lehnert, M. D., Strickland, D. K., & Armus, L. 2000, ApJS, 129, 493
- Ho, Filippenko, & Sargent (1993) Ho, L. C., Filippenko, A. V., & Sargent, W. L. W. 1993, ApJ, 417, 63
- Kim & Sanders (1998) Kim, D.-C. & Sanders, D. B. 1998, ApJS, 119, 41
- Kim et al. (1995) Kim, D.-C., Sanders, D. B., Veilleux, S., Mazzarella, J. M., & Soifer, B. T. 1995, ApJS, 98, 129
- Le Floc’h et al. (2004) Le Floc’h, E., et al. 2004, ApJS, 154, 170
- Lehnert & Heckman (1996) Lehnert, M. D. & Heckman, T. M. 1996, ApJ, 462, 651
- Martin (2005) Martin, C. L. 2005, ApJ, 621, 227
- McDowell et al. (2003) McDowell, J. C., et al. 2003, ApJ, 591, 154
- Monreal-Ibero (2004) Monreal-Ibero, A. (2004), Ph.D. Thesis, University of La Laguna
- Moshir et al. (1993) Moshir, M., et al. 1993, VizieR Online Data Catalog, 2156, 0
- Ptak et al. (2003) Ptak, A., Heckman, T., Levenson, N. A., Weaver, K., & Strickland, D. 2003, ApJ, 592, 782
- Rigopoulou et al. (1999) Rigopoulou, D., Spoon, H. W. W., Genzel, R., Lutz, D., Moorwood, A. F. M., & Tran, Q. D. 1999, AJ, 118, 2625
- Rupke et al. (2002) Rupke, D. S., Veilleux, S., & Sanders, D. B. 2002, ApJ, 570, 588
- Rupke et al. (2005a) Rupke, D. S., Veilleux, S., & Sanders, D. B. 2005, astro-ph/0506611
- Rupke et al. (2005b) Rupke, D. S., Veilleux, S., & Sanders, D. B. 2005, astro-ph/0506610
- Sanders & Mirabel (1996) Sanders, D. B., and Mirabel, I. F. 1996, ARA&A, 34, 749
- Sanders et al. (1988) Sanders, D. B., Soifer, B. T., Elias, J. H., Madore, B. F., Matthews, K., Neugebauer, G. and Scoville, N. Z. 1988, ApJ, 325, 74
- Scoville et al. (2000) Scoville, N. Z. et al. 2000, AJ, 119, 991
- Surace & Sanders (2000a) Surace, J. A., and Sanders, D. B. 2000a, AJ, 120, 604
- Surace, Sanders, & Evans (2000b) Surace, J. A., Sanders, D. B., and Evans, A. S. 2000b, ApJ, 529, 170
- Tacconi et al. (2002) Tacconi, L. J., Genzel, R., Lutz, D., Rigopoulou, D., Baker, A. J., Iserlohe, C., & Tecza, M. 2002, ApJ, 580, 73
- Taniguchi et al. (1999) Taniguchi, Y., Yoshino, A., Ohyama, Y., & Nishiura, S. 1999, ApJ, 514, 660
- Veilleux & Osterbrock (1987) Veilleux, S. & Osterbrock, D. E. 1987, ApJS, 63, 295
- Veilleux et al. (1999) Veilleux, S., Kim, D.-C., & Sanders, D. B. 1999, ApJ, 522, 113
- Veilleux, Cecil & Bland-Hawthorn (2005) Veilleux, S., Cecil, G., & Bland-Hawthorn, J. 2005, astro-ph/0504435
- Veilleux et al. (1995) Veilleux, S., Kim, D.-C., Sanders, D. B., Mazzarella, J. M., & Soifer, B. T. 1995, ApJS, 98, 171
 |
 |
 |
 |
 |
 |
 |
 |
 |
 |
 |
 |
 |
 |
 |
 |
 |
 |
 |
 |
 |


| Galaxy | Scale | 11Moshir et al. (1993) | 11Moshir et al. (1993) | 11Moshir et al. (1993) | 11Moshir et al. (1993) | ||
|---|---|---|---|---|---|---|---|
| (kpc arcsec-1) | (Jy) | (Jy) | (Jy) | (Jy) | |||
| IRAS 08572+3915 | 0.05822Kim & Sanders (1998) | 1.20 | 12.15 | 0.32 | 1.70 | 7.43 | 4.59 |
| IRAS 12112+0305 | 0.07322Kim & Sanders (1998) | 1.52 | 12.30 | 0.11 | 0.51 | 8.50 | 9.98 |
| IRAS 143481447 | 0.08322Kim & Sanders (1998) | 1.72 | 12.31 | 0.14 | 0.49 | 6.87 | 7.07 |
| IRAS 15206+3342 | 0.12522Kim & Sanders (1998) | 2.60 | 12.18 | 0.08 | 0.35 | 1.77 | 1.89 |
| IRAS 15250+3609 | 0.05433Kim et al. (1995) | 1.12 | 12.03 | 0.20 | 1.32 | 7.29 | 5.91 |
| IRAS 172080014 | 0.04333Kim et al. (1995) | 0.89 | 12.40 | 0.19 | 1.66 | 3.11 | 3.49 |
| Galaxy | RA | Dec | Spectral Range | texp | Air mass | P.A. | Date |
|---|---|---|---|---|---|---|---|
| hh:mm:ss | gr:mm:ss | (Å) | (s) | (o) | |||
| IRAS 08572+3915 | 09:00:25.4 | +39:03:54.1 | 52008100 | 18006 | 1.093 | 0.0 | 1998 Apr 01 |
| IRAS 12112+0305 | 12:13:46.0 | +02:48:41.0 | 49007900 | 18005 | 1.178 | 0.0 | 1998 Apr 02 |
| 12:13:46.3 | +02:48:29.7 | 51008100 | 15004 | 1.143 | 180.0 | 2001 Apr 14 | |
| IRAS 143481447 | 14:37:38.4 | 15:00:22.8 | 52008200 | 18004 | 1.438 | 0.0 | 1998 Apr 01 |
| IRAS 15206+3342 | 15:22:38.0 | +33:31:36.6 | 50008100 | 18004 | 1.095 | 0.0 | 1998 Apr 03 |
| IRAS 15250+3609 | 15:26:59.4 | +35:58:37.6 | 49007900 | 18005 | 1.031 | 0.0 | 1998 Apr 02 |
| IRAS 172080014 | 17:23:22.0 | 00:17:00.1 | 50008100 | 18004 | 1.243 | 180.0 | 1998 Apr 03 |