RHESSI and SOHO/CDS Observations of Explosive Chromospheric Evaporation
Abstract
Simultaneous observations of explosive chromospheric evaporation are presented using data from the Reuven Ramaty High Energy Solar Spectroscopic Imager (RHESSI) and the Coronal Diagnostic Spectrometer (CDS) onboard SOHO. For the first time, co-spatial imaging and spectroscopy have been used to observe explosive evaporation within a hard X-ray emitting region. RHESSI X-ray images and spectra were used to determine the flux of non-thermal electrons accelerated during the impulsive phase of an M2.2 flare. Assuming a thick-target model, the injected electron spectrum was found to have a spectral index of 7.3, a low energy cut-off of 20 keV, and a resulting flux of 41010 ergs cm-2 s-1. The dynamic response of the atmosphere was determined using CDS spectra, finding a mean upflow velocity of 23038 km s-1 in Fe XIX (592.23 Å), and associated downflows of 3616 km s-1 and 4322 km s-1 at chromospheric and transition region temperatures, respectively, relative to an averaged quiet-Sun spectra. The errors represent a 1 dispersion. The properties of the accelerated electron spectrum and the corresponding evaporative velocities were found to be consistent with the predictions of theory.
1 INTRODUCTION
Current solar flare models (Antiochos & Sturrock 1978; Fisher, Canfield, & McClymont 1984, 1985a, 1985b, 1985c; Mariska, Emslie, & Li 1989) predict two types of chromospheric evaporation processes. “Gentle” evaporation occurs when the chromosphere is heated either directly by non-thermal electrons, or indirectly by thermal conduction. The chromospheric plasma subsequently loses energy via a combination of radiation and low-velocity hydrodynamic expansion. “Explosive” evaporation takes place when the chromosphere is unable to radiate energy at a sufficent rate and consequently expands at high velocities into the overlying flare loops. The overpressure of evaporated material also drives low-velocity downward motions into the underlying chromosphere, in a process known as chromospheric condensation.
From a theoretical perspective, Fisher, Canfield, & McClymont (1985a) investigated the relationship between the flux of non-thermal electrons () and the velocity response of the atmosphere for the two classes of evaporation. For gentle evaporation, non-thermal electron fluxes of 1010 ergs cm-2 s-1 were found to produce upflow velocities of tens of kilometres per second. In contrast, explosive evaporation was found to be associated with higher non-thermal electron fluxes ( 3 1010 ergs cm-2 s-1) which drive both upflows of hot material at velocities of several hundred kilometres per second and downflows of cooler material at tens of kilometres per second.
Observationally, previous studies have identified blue-shifted Soft X-Ray and EUV lines indicative of chromospheric evaporation. Using the Bent Crystal Spectrometer onboard the Solar Maximum Mission, Antonucci & Dennis (1983) and Zarro & Lemen (1988) reported upflow velocities of 400 km s-1 and 350 km s-1, respectively, in Ca XIX lines (3.1–3.2 Å). More recently, Czaykowska et al. (1999), Teriaca et al. (2003), and Del Zanna et al. (2005) observed velocities of 140–200 km s-1 in Fe XIX (592.23 Å), using the Coronal Diagnostic Spectrometer (CDS; Harrison et al. 1995) onboard the Solar and Heliospheric Observatory (SOHO). Simultaneous upflows and downflows during a Hard X-Ray (HXR) burst indicative of explosive evaporation have been observed using CDS and Yohkoh/Hard X-Ray Telescope by Brosius & Phillips (2004). While these studies provided a measurement of the dynamic response of the flaring chromosphere, they were unable to provide a measurement of the flux of electrons responsible for driving such motions, nor the spatial relationship between the two.
In this Letter, simultaneous Reuven Ramaty High Energy Solar Spectroscopic Imager (RHESSI; Lin et al. 2002) and CDS observations are combined for the first time to investigate the relationship between the non-thermal electron flux and the response of the solar atmosphere. In Section 2 the analysis techniques employed are described, while the results are presented in Section 3. Our Conclusions are then given in Section 4.
2 OBSERVATIONS AND DATA ANALYSIS
This study focuses on a GOES M2.2 flare, which began at 12:44 UT on 2003 June 10. The event was selected from a sample of approximately 50 flares jointly observed by RHESSI and CDS. The limited field of view, cadence, and operating schedule of CDS, coupled with RHESSI nighttime and South Atlantic Anomaly passes, make simultaneous observations by the two instruments quite rare.
2.1 The Coronal Diagnostic Spectrometer (CDS)
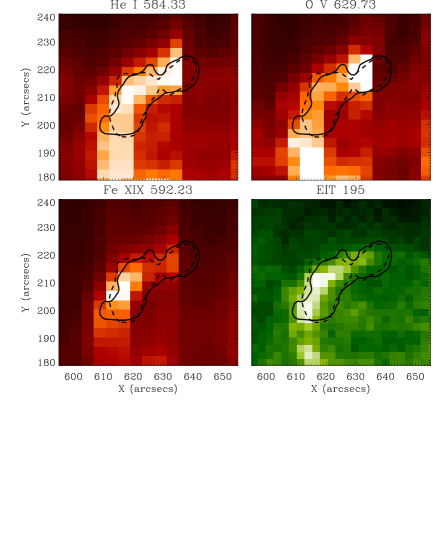
The CDS observations reported here were obtained with the FLARE_AR observing sequence. FLARE_AR contains five 4 Å wide spectral windows centered on He I (584.33 Å; log T = 4.5), O V (629.73 Å; log T = 5.4), Mg X (624.94 Å; log T = 6.1), Fe XVI (360.76 Å; log T = 6.4), and Fe XIX (592.23 Å; log T = 6.9). Each raster consists of 45 slit positions, each 15 seconds long, resulting in an effective cadence of 11 minutes. The slit itself is 4″180″ yielding a 180″180″ field of view. A zoomed-in region of the He I, O V, and Fe XIX rasters from the impulsive phase of the flare is given in Figure 1. Also shown is the Extreme ultraviolet Imaging Telescope (EIT; Delaboudinière et al. 1995) 195 Å passband image obtained at 12:48 UT. A series of subsequent EIT images makes it clear that the He I and O V brightenings come from a flare ribbon rather than two distinct footpoints as Figure 1 may suggest.

The spectrum from each CDS pixel was fitted with a broadened Gaussian profile (Thompson, 1999), for each of the five spectral windows. Velocity maps were created by measuring Doppler shifts relative to quiet-Sun spectra, which were assumed to be emitted by stationary plasma. Preliminary fits to the Fe XIX line during the impulsive phase of the flare revealed an asymmetric broadening beyond the instrumental resolution of CDS. The strongest blue asymmetries were found within the flare ribbon during the impulsive phase. Outside this area, and after the impulsive phase, the Fe XIX line was observed to have a width comparible to the instrumental width. Figure 2 shows a sample of spectra taken from the spectral window centered on the Fe XIX (592.23 Å) emission line. Panel ‘a’ shows a spectrum from a quiet Sun area in which no Fe XIX emission was visible. Instead, a weak emission line was observed at 592.6 Å which Del Zanna & Mason (2005) have identified as Fe XII. Panel ‘b’ shows a stationary Fe XIX emission line extracted from a bright region, but after the impulsive phase at 12:50 UT when no significant flows are expected. An emission line with a strong blue asymmetry is shown in panel ‘c’. This was extracted from the flare ribbon during the impulsive phase. The best fit to this line was consistent with stationary and blue-shifted components, both with widths comparible to the instrumental resolution. As Fe XIX is not observed in quiet-Sun spectra, and following from Teriaca et al. (2003), the Doppler velocity was measured as the shift between these two components. A heliographic correction was also applied, due to the longitude of the observations and assuming purely radial flows,

2.2 The Reuven Ramaty High Energy Spectroscopic Imager (RHESSI)
RHESSI is an imaging spectrometer capable of observing X- and -ray emission over a wide range of energies (3 keV–17 MeV). During this event the thin attenuators on RHESSI were in place thus limiting the energy range to 6 keV. Flare emission was not observed above 60 keV. The flare lightcurves are shown in the top panel of Figure 3. Both the RHESSI images and spectra were obtained over a 64 second period from 12:47:34–12:48:38 UT to coincide with the timerange over which CDS observed blue asymmetries in the Fe XIX line. This time interval lies within the impulsive 25–60 keV HXR burst and is indicated by two vertical dotted lines in the top panel of Figure 3. RHESSI images in two energy bands (12–25 and 25–60 keV) were reconstructed using the Pixon algorithm (Hurford et al., 2002). Contours at 10% of the peak intensity in each band are overlayed on each EUV image in Figure 1.
The RHESSI spectrum was fitted assuming an isothermal distribution at low energies, and thick-target emission at higher energies (bottom panel of Figure 3). A thick-target model was chosen over a thin-target model as it is believed that the density of the flare loop is insufficent to thermalise the electrons as they propagate to the chromosphere. The thick-target model is used in the vast majority of cases (e.g. Holman 2003, Veronig et al. 2005). Furthermore, in this flare the HXR source is clearly aligned with the He I ribbon as seen by CDS, which implies that the accelerated electrons are losing their energy in the dense chromosphere rather than in the coronal loops. The total power of non-thermal electrons above the low energy cut-off () was calculated from ergs s-1, where electrons keV-1 s-1 is the thick-target electron injection spectrum and is the associated spectral index (Brown, 1971). Because of the steepness of the RHESSI spectrum at high energies, the non-thermal flux is quite sensitive to the value of the low energy cut-off. In order to put a constraint on this value, the temperature of the thermal component was obtained by another independent method, i.e. the equivalent width of the Fe line complex at 6.7 keV (Phillips 2004). The value of the equivalent width of this line, which is quite sensitive to the temperature, was used to estimate the temperature of the thermal component. Having fixed this value, the entire RHESSI spectrum was fitted using a least-squares fit.
3 RESULTS
The thick-target model fitted to the RHESSI spectrum in Figure 3 was consistent with an electron distribution having 20 keV and 7.3. The break energy of 20 keV is consistent with earlier works (e.g. Holman 2003, Sui, Holman, & Dennis 2005). The total power in non-thermal electrons was therefore 11029 ergs s-1. Exploring the possible range of values for the break energy for this flare would yield an electron power value of 41029 ergs s-1 for = 15.0 keV while = 25.0 keV would give a power value of 61028 ergs s-1. However, either of these break energies would give a worse value than obtained from the original fit. By comparison, the total thermal power for the same time interval was found to be 1.21028 ergs s-1.
Using the reconstructed 25–60 keV image, an upper-limit to source size was calculated to be 2.31018 cm2. This was found by summing over all pixels with counts greater than 10% of the peak value. This threshold was chosen to eliminate sources outside of the main HXR-emitting region, which were assumed to be unreal; the source area was not found to be highly sensitive to this value. For example, a threshold of 5% yielded an area of 3.21018 cm2 and 15% yielded 21018 cm2. This area was also confirmed using the Fourier modulation profiles from each of RHESSI’s nine detectors, which are sensitive to spatial scales from 2.2″to 183″. Assuming a filling factor of unity, the resulting non-thermal electron flux was calculated to be 41010 ergs cm-2 s-1.
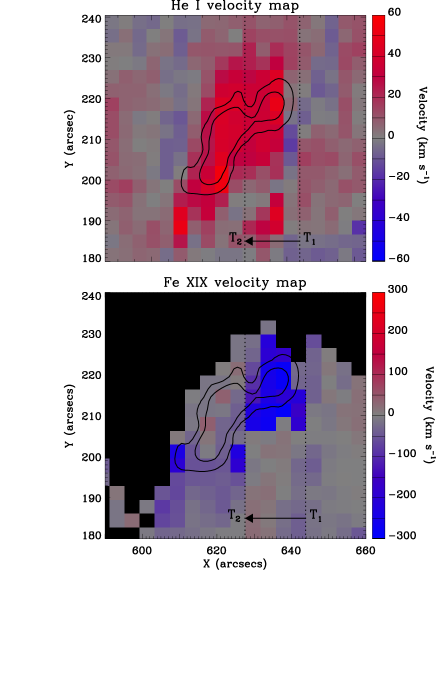

Figure 4 shows velocity maps in the He I and Fe XIX lines. The He I map shows consistent downflows of 20–50 km s-1 until the slit leaves the flaring region at 12:50 UT. A velocity map in O V showed a similar trend. However, the Fe XIX map shows strong upflow velocities of 190–280 km s-1 during the HXR peak, indicated by ‘T1’ and ‘T2’ on Figures 3 and 4. No significant upflows were evident once the HXRs begin to diminish from time T2 onwards.
By identifying each pixel in the Fe XIX map that required a two-component fit to the line profile, between times T1 and T2, the velocity was measured for the corresponding pixel in each of the five CDS rasters. Figure 5 shows the mean velocity as a function of temperature for each line using the methods described in Section 2. The error bars represent a 1 dispersion. At chromospheric and transition region temperatures, plasma velocities show red-shifts of 3616 km s-1 and 4322 km s-1, respectively, while the blue-shift observed in the 8 MK Fe XIX line corresponds to a velocity of 23038 km s-1. No significant flows were observed in the Mg X and Fe XVI lines. The combination of high-velocity upflows and low-velocity downflows, together with a non-thermal electron flux of 41010 ergs cm-2 s-1 provides clear evidence for explosive chromospheric evaporation.
4 DISCUSSION AND CONCLUSIONS
For the first time, co-spatial and co-temporal HXR and EUV observations of chromospheric evaporation are presented using RHESSI and SOHO/CDS. High upflows velocities (230 km s-1) were clearly observed in high-temperature Fe XIX emission during the impulsive phase of an M2.2 flare, while much lower downflow velocities (40 km s-1) were observed in the cooler He I and O V lines. The value of the non-thermal electron flux (41010 ergs cm-2 s-1) and the resulting velocity response are indicative of an explosive evaporation process occuring during this flare, as laid out in Fisher, Canfield, & McClymont (1985a) and Mariska, Emslie, & Li (1989).
The combination of HXR and EUV observations presented in this Letter have enabled us to obtain a greater understanding of the characteristics of chromospheric evaporation, a fundamental process in solar flares. We have presented the first detection of explosive mass motions within HXR footpoints, and determined the flux of non-thermal electrons responsible for driving such flows.
References
- Antiochos & Sturrock (1978) Antiochos, S. K., & Sturrock, P. A. 1978, ApJ, 220, 1137
- Antonucci & Dennis (1983) Antonucci, E., & Dennis, B. R. 1983, Sol. Phys., 86, 67
- Brosius & Phillips (2004) Brosius, J. W., & Phillips, K. J. H. 2004, ApJ, 613, 580
- Brown (1971) Brown, J. C. 1971, Sol. Phys., 18, 489
- Czaykowska et al. (1999) Czaykowska, A., De Pontieu, B., Alexander, D., & Rank, G. 1999, ApJ, 521, L75
- Del Zanna & Mason (2005) Del Zanna, G., & Mason, H. E. 2005, A&A, 433, 731
- Del Zanna et al. (2005) Del Zanna, G., Berlicki, A., Schmieder, B., & Mason, H. E. 2005, Sol. Phys., In Press
- Delaboudinière et al. (1995) Delaboudinière, J. -P., et al. 1995, Sol. Phys., 162, 291
- Fisher, Canfield, & McClymont (1984) Fisher, G. H., Canfield, R. C., & McClymont, A. N. 1984, ApJ, 281, L79
- Fisher, Canfield, & McClymont (1985a) Fisher, G. H., Canfield, R. C., & McClymont, A. N. 1985a, ApJ, 289, 414
- Fisher, Canfield, & McClymont (1985b) Fisher, G. H., Canfield, R. C., & McClymont, A. N. 1985b, ApJ, 289, 425
- Fisher, Canfield, & McClymont (1985c) Fisher, G. H., Canfield, R. C., & McClymont, A. N. 1985c, ApJ, 289, 434
- Harrison et al. (1995) Harrison, R. A., et al. 1995, Sol. Phys., 162, 233
- Holman (2003) Holman, G. D. 2003, ApJ, 586, 606
- Hurford et al. (2002) Hurford, G. J., et al. 2002, Sol. Phys., 210, 61
- Lin et al. (2002) Lin, R. P., et al. 2002, Sol. Phys., 210, 3
- Mariska, Emslie, & Li (1989) Mariska, J. T., Emslie, A., G., & Li, P. 1989, ApJ, 341, 1067
- Phillips (2004) Phillips, K. J. H. 2004, ApJ, 605, 921
- Sui, Holman, & Dennis (2005) Sui, L., Holman, G. D., & Dennis, B. R. 2005, ApJ, 626, 1102
- Teriaca et al. (2003) Teriaca, L., Falchi, A., Cauzzi, G., Falciani, R., Smaldone, L. A., & Andretta, V. 2003, ApJ, 588, 596
- Thompson (1999) Thompson, W. T. 1999, CDS Software Note No. 53
- Veronig et al. (2005) Veronig, A. M., Brown, J. C., Dennis, B. R., Schwartz, R. A., Sui, L., & Tolbert, A. K. 2005, ApJ, 621, 482
- Zarro & Lemen (1988) Zarro, D. M., & Lemen, J. R. 1988, ApJ, 329, 456