11email: mosca@ca.astro.it 22institutetext: INAF, Osservatorio Astrofisico di Arcetri, Largo E. Fermi 5, 50125 Firenze, Italy
22email: lt@arcetri.astro.it 33institutetext: Division of Physics, Mathematics, and Astronomy, California Institute of Technology, MS 105-24, Pasadena, CA 91125, USA
33email: rsf@astro.caltech.edu 44institutetext: National Radio Astronomy Observatory USA
55institutetext: Institute of Space and Astronautical Science, Yoshinodai 3-1-1, Sagamihara, Kanagawa 229-8510, Japan
First results from a VLBA proper motion survey of H2O masers in low-mass YSOs: the Serpens core and RNO 15-FIR.
This article reports first results of a long-term observational program aimed to study the earliest evolution of jet/disk systems in low-mass YSOs by means of VLBI observations of the 22.2 GHz water masers. We report here data for the cluster of low-mass YSOs in the Serpens molecular core and for the single object RNO 15-FIR. Towards Serpens SMM1, the most luminous sub-mm source of the Serpens cluster, the water maser emission comes from two small ( 5 AU in size) clusters of features separated by 25 AU, having line of sight velocities strongly red-shifted (by more than 10 km s-1) with respect to the LSR velocity of the molecular cloud. The two maser clusters are oriented on the sky along a direction that is approximately perpendicular to the axis of the radio continuum jet observed with the VLA towards SMM1. The spatial and velocity distribution of the maser features lead us to favor the interpretation that the maser emission is excited by interaction of the receding lobe of the jet with dense gas in the accretion disk surrounding the YSO in SMM1. The line of sight velocities of several features decrease at a rate of 1 km s-1 month-1 and the sky-projected relative motion of two features appears to be accelerated (decelerated) at a rate of 10–15 km s-1 month-1. We propose that the shocks harboring the maser emission are slowed down as they proceed through the dense material surrounding the YSO. Towards RNO 15-FIR, the few detected maser features have both positions and (absolute) velocities aligned along a direction that is parallel to the axis of the molecular outflow observed on much larger angular scales. In this case the maser emission likely emerges from dense, shocked molecular clumps displaced along the axis of the jet emerging from the YSO. The protostar in Serpens SMM1 is more massive than the one in RNO 15-FIR. We discuss the case where a high mass ejection rate can generate jets sufficiently powerful to sweep away from their course the densest portions of circumstellar gas. In this case, the excitation conditions for water masers might preferably occur at the interface between the jet and the accretion disk, rather than along the jet axis.
Key Words.:
Masers – Instrumentation:interferometers – ISM:jets and outflows – Stars:low-mass, brown dwarfs1 Introduction
The scenario based on the disk/jet system for the formation of an isolated low-mass star (Shu et al. 1987) is supported both by millimeter interferometer (i.e. Simon et al. (2000)) and optical and near-infrared observations (Bally et al. 2000). Notwithstanding the observational and theoretical efforts, basic questions connected to the mass accretion and ejection process are still to be answered. First of all, it has still to be clarified what causes the end of the accretion process, determining the final mass of a newly born protostar. If, in the earliest evolutionary phases, winds and/or jets are believed to play a fundamental role to expel excess angular momentum and allow mass accretion, in a later phase these structures might evolve and be responsible for stopping the mass flow towards the protostar’s surface. Therefore the study of the protostellar jet dynamics and the mechanisms of jet acceleration and collimation is of great importance.
The earliest evolutionary phase of the forming YSO (Young Stellar Object), the so-called Class 0 phase (Andre & Montmerle 1994), is characterized by the most active accretion-ejection phenomena. It is now believed that most of the stellar mass is accreted during the Class 0 phase, while the mass accretion rate drops rapidly during the subsequent Class I phase. It is clear that these are the most relevant phases for the investigation of the evolution of protostellar jets and their possible relationship with the accretion process. To characterize this relationship, it is essential to resolve jet structure close to the central engine on a spatial scale of 10 AU. However, the spatial resolution of 1000 AU provided by present millimeter interferometer observations is insufficient to perform such a study. At present, only Very Long Baseline Interferometry (VLBI) applied to water maser lines allows us to explore the kinematics of the jet gas in the vicinity — down to sub-AU scales — of the accretion disk.
Water masers at 22.2 GHz are well known to be associated with outflow phenomena and with the earliest evolutionary phases of star formation. Using the Nobeyama 45-m telescope, Furuya et al. (2001, 2003) performed a multi-epoch H2O maser survey and revealed that maser activity is high during the earliest stages of low-mass star formation, i.e. the Class 0 phase. The survey also showed that the maser activity fades towards Class I, at the end of the main accretion and outflow phase, and completely disappears after the pre-main sequence evolution (Class II), when the star is optically visible and no significant accretion is occurring.
There are only a few published VLBI water maser studies towards low- and intermediate-mass young stellar objects (Claussen et al. 1998; Furuya et al. 2000; Patel et al. 2000; Seth et al. 2002). These VLBA studies indicated that the water masers trace predominantly knot and shock structures at the base of and along the protostellar jets, and can also emerge from parts of the protostellar disks. The main advantage of VLBA H2O maser observations with respect to other techniques are that they: 1) probe the inner region of the disk/jet system where the high extinction, especially in Class 0 objects, prevent observations at shorter wavelengths; 2) measure proper motions and line of sight velocities, and hence derive the 3-dimensional (3D) velocity structure of the maser environment, with a time sampling of only a few weeks, much shorter than the (typically) several years required by conventional high-resolution optical and near-infrared techniques (HST and adaptive optics).
We have been using the VLBA to observe 22.2 GHz water maser emission towards a sample of low-mas YSOs in different evolutionary stages (from Class 0 to Class I) with the final aim to study the evolution of the disk/jet system as traced by the water masers. Our ultimate goal is to reconstruct the kinematic structure of the masing gas by means of milliarcsecond proper motion observations. Whenever possible we will use the phase-referencing technique, which allows to measure absolute positions of the water maser features at each epoch. In this paper we report the results of the first two sessions of VLBA multi-epoch observations towards the cluster of low-mass YSOs in the Serpens molecular core and towards RNO 15-FIR. For this latter source we were able to obtain absolute proper motions.
| Sources | First Run | Second Run | Third Run | Fourth Run |
| yr month day | yr month day | yr month day | yr month day | |
| Serpens SMM1 | 2003 April 1 | 2003 April 22 | 2003 May 19 | 2003 June 8 |
| Serpens SMM3 | 2003 November 21 | |||
| Serpens SMM4 | 2003 November 21 | |||
| RNO 15-FIR | 2003 October 19 | 2003 November 7 |
2 Sample selection and strategy
Water masers in low mass YSOs are on average much fainter than those observed in massive star forming regions. Additionally, the extensive single dish and VLA search and monitoring project towards low mass young stellar objects of Furuya et al. (2003) has clearly shown that maser features are (as for high-mass stellar objects) transient and highly variable. Many sources alternate quiescent and active periods. These probably correspond to the formation, evolution and fading of masing spots in the circumstellar regions.
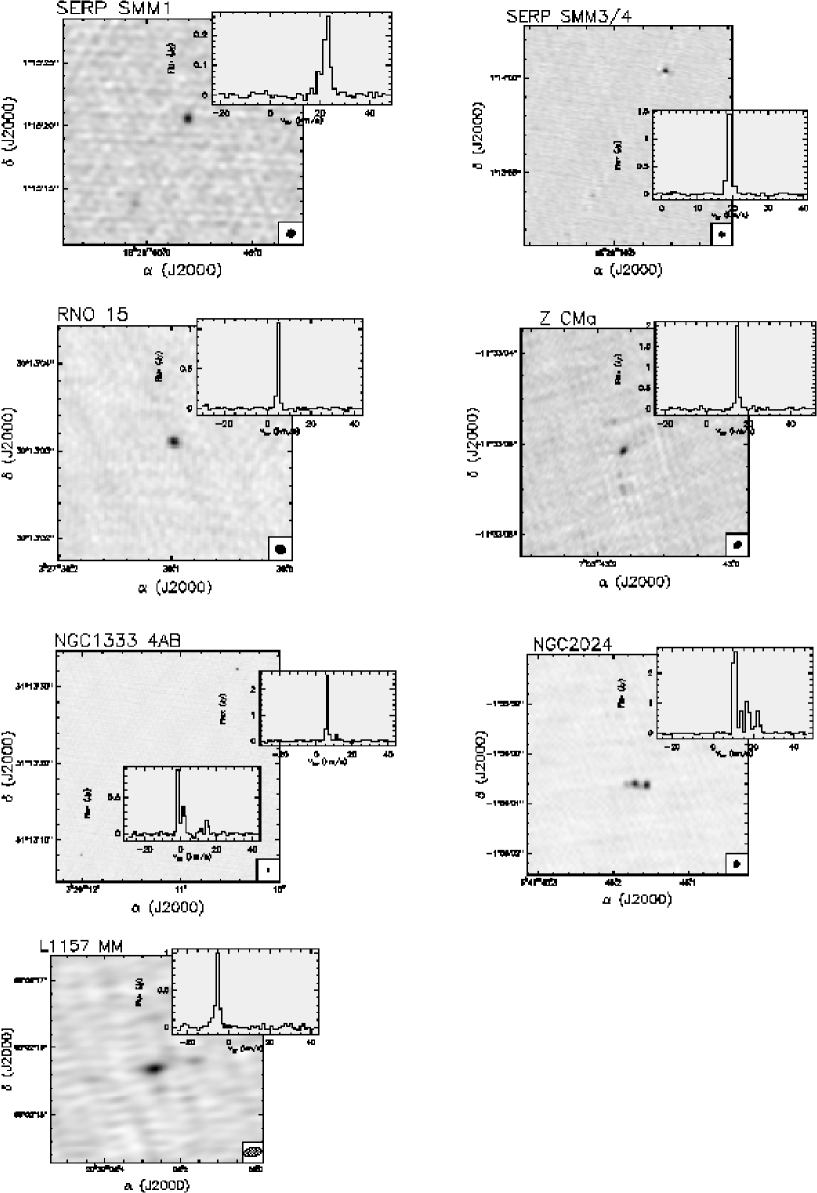
In order to be able to efficiently use the VLBA time, we decided to perform snapshot surveys using the VLA of a large list of objects from the survey of Furuya et al. (2003). The selected objects span a wide range of bolometric temperature (Gregersen et al. 1997), corresponding to evolutionary stages from Class 0 to Class I. All objects in our sample were detected at least in one epoch by Furuya et al. (2003). In March and September 2003 all sources in our sample were observed and, consistent with our expectations, only a relatively small fraction of the sources were detected. The sources detected in our VLA snapshot survey are: L1157 MM, NGC1333 4AB, NGC2024, RNO 15-FIR, Serpens SMM1 and SMM3/4, Z CMa. Except for NGC2024 (where more diffuse emission appears), the VLA maps of these sources show isolated maser spots, indicating that the water maser emission associated with each YSO is distributed within an area of diameter of a few tenths of an arcsecond. Fig. 1 shows the VLA maps and spectra of all the detected sources.
The sources selected for the VLBA follow-up were the Class 0 and I sources SMM1, 3, and 4 in the Serpens molecular core and the Class I source RNO 15-FIR. All the Serpens sources are associated with molecular outflows and are among the brightest members of the Serpens protocluster at millimeter wavelengths (Testi & Sargent 1998; Testi et al. 2000). On the other hand, RNO 15-FIR is a relatively isolated YSO, with a well detected bipolar outflow (Davis et al. 1997b).
3 Observations
We used the VLBA (NRAO111The National Radio Astronomy Observatory (NRAO) is operated by Associated Universities, Inc., under cooperative agreement with the National Science Foundation.) to observe the H2O maser line (at rest frequency 22235.080 MHz) towards Serpens SMM1 for four epochs each separated by about 20 days in April-June 2003. A second session of VLBA multi-epoch observations was not completed, and included a single epoch (November 2003) towards the two Serpens sources SMM3 and SMM4, and two epochs (separated by 19 days in October-November 2003) towards RNO 15-FIR. Table 1 lists the dates of the observing runs. In each observing run all ten antennas of the VLBA took part in the observations, except for the last epoch towards SMM1, when the Kitt Peak antenna was undergoing major maintenance and the Pie Town antenna was replaced by a VLA antenna. Each epoch consisted of 7 hours of integration on the target maser source(s), interrupted every 1-2 hours with a few-minute scan on strong continuum calibrators (3C345, J1751+0939, J2005+7752 for the Serpens sources; 3C84, DA193, J0102+5824 for RNO 15-FIR) for calibration purposes. At the time of our VLBA observations, no suitable phase-reference calibrator was known within a distance of a few degrees from the Serpens sources. For the source RNO 15-FIR, we found an intense, compact continuum source sufficiently close (within 3°) to the maser target. In this case, we used a phase-referencing technique, which allows the derivation of absolute positions and motions of the maser features. The phase-reference source, J0336+3218, belongs to the list that defines the International Celestial Reference Frame (ICRF), and its absolute position is known with high accuracy ( mas). The 4 cm VLBA map of J0336+3218 shows an elongated structure (10 mas in size) with a peak flux density of 0.5 Jy beam-1.
Both circular polarizations were recorded using 16 MHz bandwidth for the sources SMM3, SMM4 and RNO 15-FIR, and 4 MHz bandwidth for the source SMM1. The data were processed at the VLBA correlator in Socorro (New Mexico, USA) using either 512 (for the 4 MHz bandwidth) or 1024 spectral channels (for the 16 MHz bandwidth), corresponding to a velocity resolution of 0.1 km s-1 and 0.2 km s-1, respectively.
Data reduction was performed using the NRAO AIPS package, following the standard procedure for VLBI line data. Total power spectra of the strong continuum calibrators were used to derive the bandpass response of each antenna. Amplitude calibration was performed using the information on the system temperature and the gain curve provided automatically by each antenna to the VLBA correlator.
For each observing epoch, a single scan of a strong calibrator was used to derive the (time-independent) single-band delay and the phase offset between the two polarizations.After removing these major instrumental effects, all calibrator scans were fringe-fitted to determine the residual (time-dependent) delay and the fringe rate. In all cases the residual delays (always 15 ns) and fringe rates (always 5 mHz) were found to be sufficiently small not to require the maser line data to be further corrected for these minor instrumental effects.
For each source and epoch, the visibilities of all the spectral channels were referred in phase to the velocity channel of maximum emission in the total power spectra. The selected (phase-)reference features were detected with high signal-to-noise ratio (SNR) at each observing epoch, and, after imaging that velocity channel, we verified that they always exhibited a simple spatial structure consisting of a single, almost unresolved maser spot. The visibilities of the reference channel were fringe-fitted to find the residual fringe rate produced both by differences in atmospheric fluctuations between the calibrators and the maser source, and by errors in the model used at the correlator. After correcting for the residual fringe rate, the visibilities of the reference channel were self-calibrated to correct for rapid time variations of atmospheric path lengths and to remove any possible effect induced by extended spatial structure. The self-calibration process was effective in reducing the RMS noise level, , on the reference channel map by a factor of 2 – 4 (depending on the observing epoch). Finally, the corrections derived from the reference channel were applied to the visibility data of all spectral channels. For the source RNO 15-FIR, the absolute position of the reference maser channel was derived applying the standard phase-referencing technique. The data of the phase-reference calibrator were fringe-fitted and the derived phase solution applied to the reference maser channel before imaging.
At first, by producing tapered, channel–averaged maps, we searched for maser emission over the whole velocity range where signal was visible in the total-power spectra, and over a sky area of centered on the reference feature. For each source (and epoch), we found maser emission centers to be distributed within an area with a maximum distance of from the reference feature. The region of detection of maser emission was then imaged at full angular and velocity resolution, producing sensitive, naturally weighted maps. The CLEAN beam was an elliptical Gaussian with a FWHM size, slightly varying from source to source, of 1.2 – 1.5 mas along the major axis and 0.4 – 0.6 mas along the minor axis. In each observing epoch, the RMS noise level on the channel maps, , is close to the theoretical thermal value, 3 mJy beam-1, for channels where no signal is detected, and increases to 10 mJy beam-1 for channels with the strongest components.
Every channel map was searched for emission above a conservative detection threshold (in the range 5–10 ), and the detected maser spots have been fitted with two-dimensional elliptical Gaussian, determining position, flux density, and FWHM size of the emission. Hereafter, we use the term of “spot” to refer to compact maser emission in a single channel map and the term of “feature” to indicate a collection of spectrally and spatially contiguous maser spots. Contour plots of every channel map with relevant maser emission were produced in order to check whether the number of fitted Gaussian components corresponded with the number of “spots” visible in the image. A maser feature was considered real if it was detected in at least three contiguous channels, with a position shift of the intensity peak from channel to channel smaller than the FWHM size.
The uncertainty in the relative positions of the maser spots was estimated using the expression
| (1) |
where is the full width at half maximum size of the spot without deconvolution, is the peak intensity and is the no-signal RMS of the image (Reid et al. 1988). By using this formula, for most of the spots the positional uncertainty was found to be of the order of 1 – 10 as.
4 Results
4.1 H2O maser spectra
Fig. 2 shows, for each source and observing epoch, the comparison between the Pie Town total-power spectrum and the integrated flux densities of the VLBI channel maps. We note that the difference between the total-power flux and the flux recovered in the imaged VLBI field of view is always within the amplitude calibration errors of 20 – 30%. This suggests that our observations are consistent with the assumption that all the maser emission within the VLBA primary beam is concentrated in the regions around the sources selected for correlation of the data.
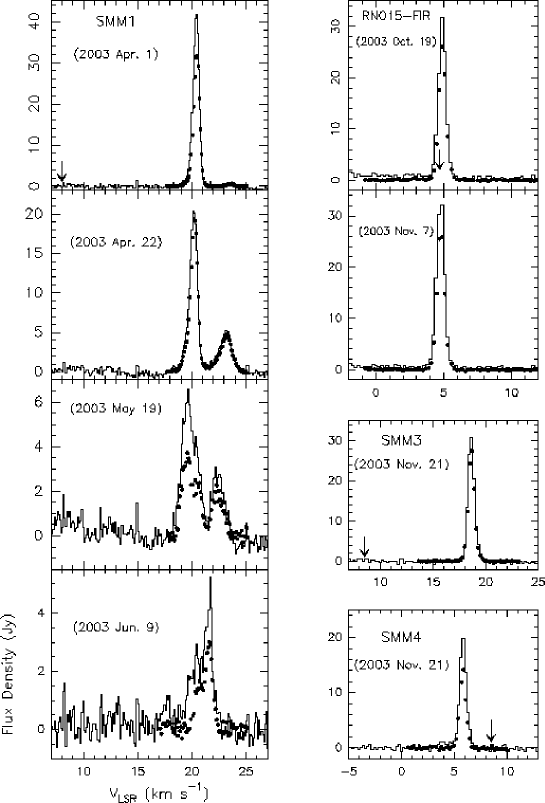
Figure 2 provides evidence that the maser emission peak towards the source SMM1 has decreased from 40 Jy to 4 Jy over a time span of two months. On the contrary, the maser spectrum towards the source RNO 15-FIR does not show any significant variation over 20 days.
We have compared the maser spectra in our VLA and VLBA observations with the results presented by Furuya et al. (2003). All the sources selected for the VLBA follow-up were highly variable in the single dish monitoring program, and the spectral complexity and the intensity of the features was very different from source to source.
RNO15: The single dish observations showed only a single faint feature at only one epoch. Our observations reveal a single spectral feature at approximately the same velocity as the single dish data from January 1999.
Serp SMM1: The single dish spectra show a complex and highly variable structure (Furuya et al. 2003). In our VLA and VLBA observations we only detect a group of features near V km s-1, while the strong component near 10 km s-1 detected in the single dish spectra of June 1999 was not detected in 2003.
Serp SMM3/4: These two sources could not be resolved in the Furuya et al. (2003) single dish monitoring. The Nobeyama data show only a faint feature detected in January 1999 near V km s-1. Our VLA observations show two distinct groups of maser features, emitting at VLSR 20 km s-1 towards SMM3, and at VLSR6 km s-1 towards SMM4.
| Source | Feature | |||||||||
|---|---|---|---|---|---|---|---|---|---|---|
| name | (km s-1) | (Jy) | (mas) | (mas) | (km s-1) | (km s-1) | (km s-1) | |||
| SMM1 | 1 | 20.0 | 13.96 | 53.80 (0.34) | 53.22 (0.20) | 17.8 (4.1) | 26.5 (3.5) | 31.9 (3.7) | ||
| 2 | 20.3 | 4.68 | 53.19 (0.04) | 53.50 (0.08) | ||||||
| 3 | 20.2 | 0.14 | 52.98 (0.05) | 54.38 (0.11) | ||||||
| 4 | 19.7 | 0.50 | 51.59 (0.04) | 53.62 (0.07) | 36.1 (2.7)† | 22.1 (3.0) | 42.3 (2.8) | |||
| 5 | 19.4 | 0.16 | 65.75 (0.04) | 50.88 (0.08) | 25.0 (0.4) | 12.7 (1.1) | 28.1 (0.6) | |||
| 6 | 20.9 | 0.32 | 62.87 (0.04) | 51.63 (0.07) | 26.7 (1.1) | 25.1 (1.2) | 36.7 (1.1) | |||
| 7 | 23.6 | 0.91 | –0.22 (0.04) | 0.95 (0.07) | –17.4 (3.6) | 1.7 (3.4) | 17.4 (3.6) | |||
| 8 | 22.5 | 1.47 | 0 | 0 | 0 | 0 | 0 | |||
| 9 | 20.8 | 0.10 | 57.39 (0.09) | 53.49 (0.09) | ||||||
| 10 | 22.7 | 2.00 | –2.20 (0.13) | 2.12 (0.15) | ||||||
| 11 | 18.0 | 0.16 | 47.98 (0.09) | 53.40 (0.09) | ||||||
| 12 | 20.3 | 1.57 | 63.71 (0.21) | 53.82 (0.25) | ||||||
| 13 | 23.0 | 0.36 | 2.70 (0.22) | –3.22 (0.27) | ||||||
| SMM3 | 1 | 18.6 | 23.16 | 0 | 0 | |||||
| 2 | 19.5 | 0.70 | –0.55 (0.05) | 0.30 (0.13) | ||||||
| 3 | 18.8 | 1.48 | –0.76 (0.05) | 0.00 (0.14) | ||||||
| 4 | 18.1 | 0.37 | –1.22 (0.04) | –0.67 (0.13) | ||||||
| 5 | 18.8 | 1.09 | –1.79 (0.10) | 0.26 (0.20) | ||||||
| 6 | 19.5 | 0.09 | –2.37 (0.04) | 0.46 (0.13) | ||||||
| SMM4 | 1 | 5.9 | 9.56 | 0 | 0 | |||||
| RNO 15-FIR | 1 | 4.9 | 25.06 | 0 | 0 | –22.8 (13.6) | –16.2 (13.6) | 27.9 (13.6) | ||
| 2 | 5.0 | 0.90 | –0.51 (0.31) | –0.32 (0.32) | –32.5 (14.3) | –17.3 (14.2) | 36.8 (14.3) | |||
| 3 | 2.9 | 0.21 | –2.47 (0.31) | –1.89 (0.32) | –4.4 (14.4) | –4.5 (14.6) | 6.3 (14.5) | |||
| 4 | 5.1 | 0.31 | 0.78 (0.32) | 0.42 (0.34) |
The italic character is used to indicate tentative values of proper motion components for features observed either at only two epochs or with a very large uncertainty in the direction of motion.
4.2 Maser feature identification and proper motion
For each observed source, Table 2 lists the maser features’ parameters, derived by fitting an elliptical Gaussian to the intensity distribution of the maser spots contributing to the features’ emission at different velocity channels. Col. 1 indicates the source name, and the corresponding maser features are denoted with the label numbers given in Col. 2. Cols. 3 and 4 report respectively the line of sight velocity, , and the integrated flux density, , of the highest-intensity channel, with values averaged over the observational epochs for the time-persistent features. Cols. 5 and 6 report the feature positional offset (of the first epoch of detection) calculated with respect to the reference feature. The positional offset of a given feature is estimated from the (error-weighted) mean position of the contributing maser spots. The bracketed numbers are the positional uncertainties, evaluated by taking the weighted standard deviation of the spot positions.
As explained in Section 3, in order to increase the signal-to-noise ratio, for each source and epoch the fringe-fit and self-calibration solutions were determined using the strongest spot (always belonging to feature ”1”,except for the fourth epoch towards Serpens SMM1, where the strongest emission comes from feature ”8”), and images were made referencing the visibilities of all the channels to this spot. In Table 2, positions of each feature of the Serpens sources SMM3 and SMM4 and of RNO 15-FIR, are listed relative to feature ”1” for each source. In the case of the Serpens source SMM1, maser features are concentrated in two separated clusters (directed along a northeast-southwest direction; see discussion in Section 4.3). Since most of the proper motions are measured in the NE cluster, in order to show the relative motion of the two (NE and SW) clusters of maser spots, Table 2 (and Figure 6) present results with positions (and proper motions) referred to a persistent feature (label number ”8”) of the SE cluster.
Taking an average of the FWHM sizes along the major and minor axes, the VLBA synthesized beam varied from source to source and from epoch to epoch from 0.6 mas to 1.2 mas. In each source, and for each detected feature, the deconvolved size of the strongest (and best characterized) maser spots is always found to be smaller than the observing beam size. A few ( 10%) of the weaker spots have deconvolved sizes slightly larger than the beam, but these measurements are uncertain owing to the low signal-to-noise ratio. Since our sources have estimated distances between 300 and 400 pc, upper limits to the spot sizes in the range 0.2 – 0.4 AU can be derived.
Criteria for cross-epochal matching of features were based on several considerations and requirements. We matched features appearing at two non-consecutive epochs, as well. Assuming maser emission originates in shocked layers of gas, since the conditions for maser action are highly variable, during the lifetime of a given shock distinct episodes of maser emission can occur. Then, in particular for the weakest maser features, it is plausible that they can fade away at a given epoch and reappear subsequently. The features’ (relative or absolute) proper motions are searched for velocities less than 250 km s-1, which, for a time baseline of 2 months and a source distance of 300 pc, requires that positions of features corresponding over epochs have to be closer than 5 mas. If, as in the case of the source Serpens SMM1, maser features are found to be grouped within clusters of given shape and size, establishing cross-epochal correspondence may be facilitated by the persistence of the cluster geometry. Finally, for features observed at three (or more) epochs, a good check of the consistency of the cross-epochal matching is that the features move along smooth (linear or curved) trajectories.
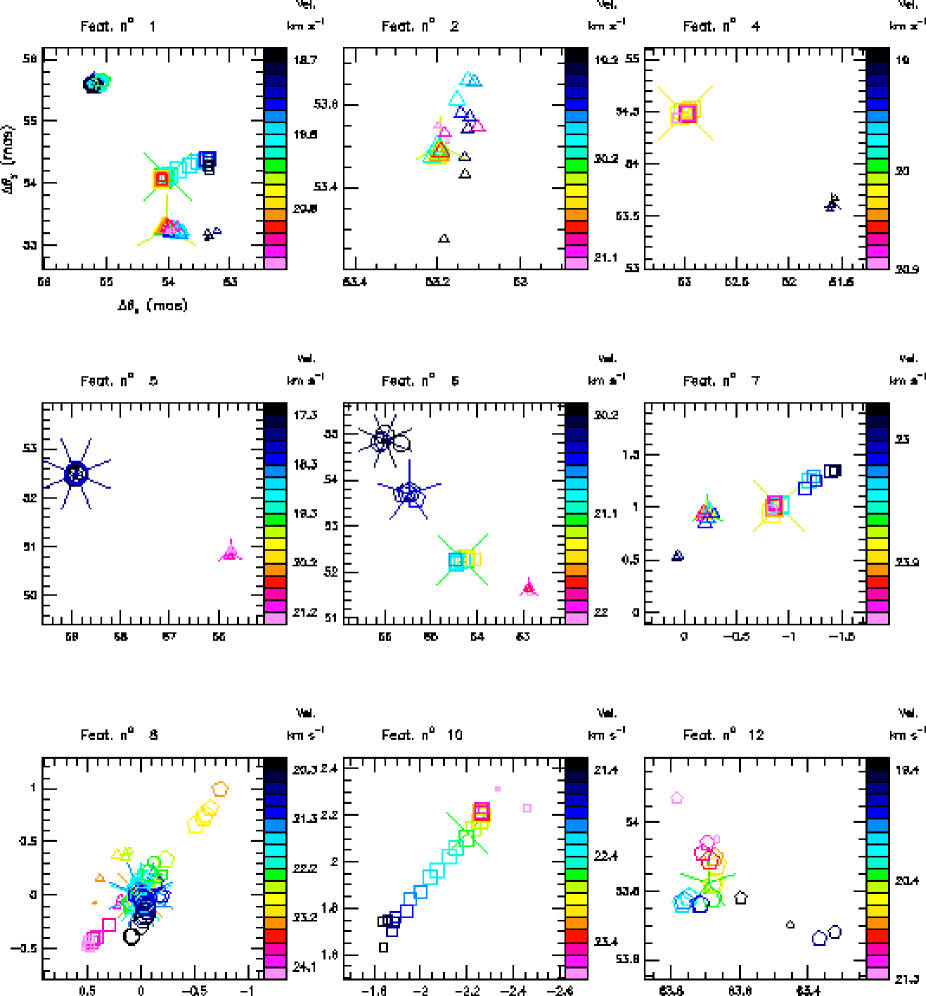
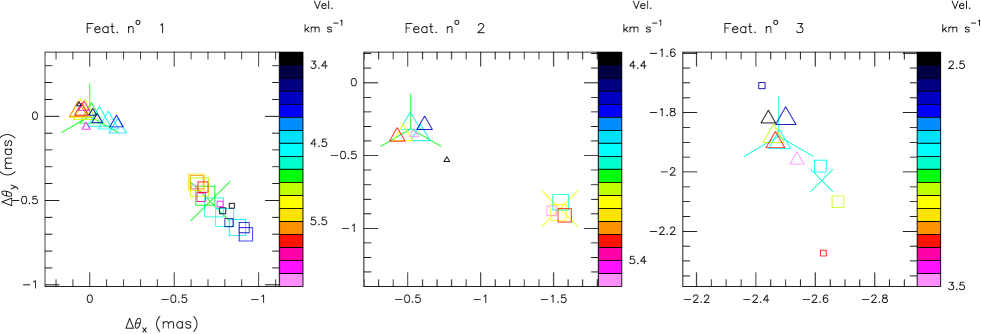
For most of the features observed towards the sources Serpens SMM1 and RNO 15-FIR, respectively, Figures 3 and 4 show the spatial and velocity distribution of the spots contributing to the features’ emission. In both sources, for the persistent features, spots at different epochs are clearly separated in the sky-plane, with a monotonic shift in both spatial coordinates when the emission is observed for more than two epochs (for features labeled ”1” and ”6” of SMM1). In SMM1, feature ”5”, among the weakest features (see Table 2), is detected only at the first and last epoch.
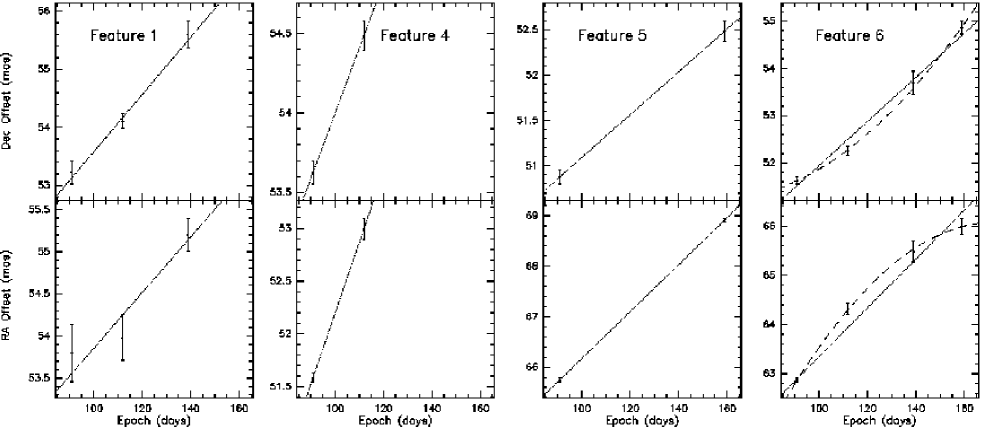
Figure 5 presents plots of the variation of the position with time for four persistent features observed toward the source Serpens SMM1. The proper motions have been calculated by performing a (error-weighted) linear least-squares fit of the positional offsets with time. The derived proper motions are a measure of the average motion of the features over the epochs. Tentative values of the proper motions are also calculated for features observed at only two epochs. For features observed at three or four epochs (”1” and ”6”), Figure 5 indicates that, given the positional uncertainties, a constant velocity motion is a reasonable approximation of their real motion. Particularly interesting, however, is the case of feature ”6”, for which compelling evidence of acceleration does exist. Looking at Figure 3, one can note that this feature appears to move along a curved rather than a linear trajectory, and from Figure 5 one sees that a second-order polynomial fits the variation of positions with time better than a linear fit. In Section 5.3, the motion of feature ”6” is discussed within the scenario proposed to explain the water maser kinematics in Serpens SMM1.
Cols. 7, 8 and 9 of Table 2 report the projected components along the R.A. and DEC axis, and the absolute value of the derived proper motions, respectively. The numbers in italics refer to features observed at only two epochs. The bracketed numbers are the formal errors of the linear least-squares fit. From Table 2, and Figures 3, 4 and 5, it is clear that nearby features are always found to move with similar velocities, both in magnitude and direction. This result gives us some confidence that the the derived proper motions are correct, also for features observed at only two epochs.
In the following subsections, the results obtained towards the sources in the Serpens core and towards RNO 15-FIR are presented separately.
4.3 Serpens core
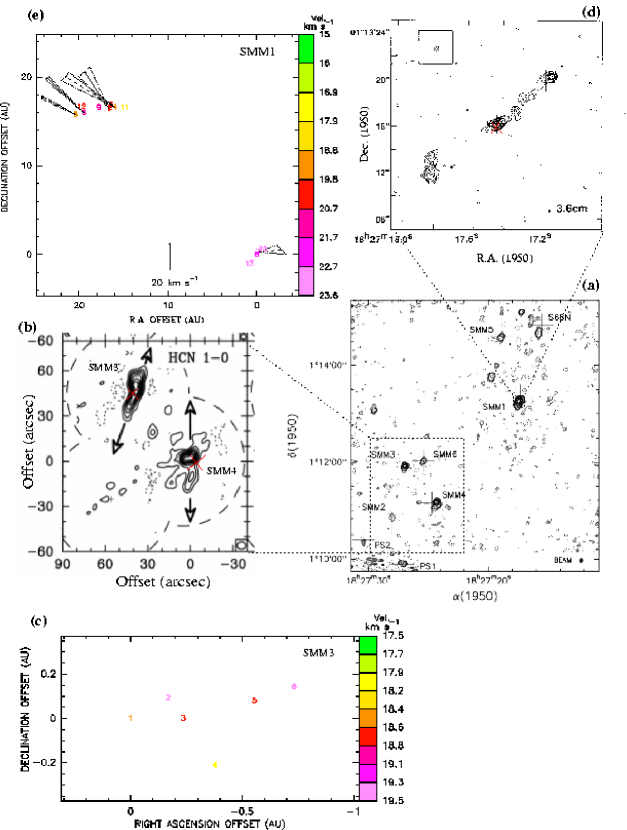
For the Serpens molecular core, Fig. 6 shows a collage of previous interferometric observations with our VLBA maps. Fig. 6a is the 99 GHz map obtained by Testi & Sargent (1998) using the OVRO (Owens Valley Radio Observatory) interferometer. Over a region of size about many 3 mm condensations are visible, suggesting that the process of fragmentation and collapse of the molecular cloud is in a very active phase. Interferometric molecular line observations (Hogerheijde et al. 1999) reveal that typical condensation masses are in the range 1 – 10 M⊙ and gas temperatures are 50 K. Most of the massive condensations visible in the Testi & Sargent (1998) 3 mm map are thought to harbour a low-mass protostar accreting matter from the surrounding molecular envelope.
Fig. 6b shows the OVRO HCN J 1 0 map by Hogerheijde et al. (1999) towards the two Serpens YSOs SMM3 and SMM4. In both sources, the HCN emission is extended along the direction (indicated with an arrow) of a larger scale H2 jet, and likely traces ambient gas shocked by the fast outflow emerging from the protostar. The red crosses give the position (accurate within 01) of the 22.2 GHz water masers observed in this region using the VLA just a few days before the VLBA observations. The positional accuracy of the HCN map, 1, is sufficient to establish that, in both sources, the water maser emission emerges close to the HCN peak.
A single water maser feature has been detected in SMM4, blue-shifted by a few km s-1 with respect to the LSR velocity of the ambient gas, 8.5 km s-1. Fig. 6c reports the spatial and line of sight velocity distribution of the water maser features detected towards SMM3. The maser features display an elongated, albeit very small ( 1 AU in size), spatial distribution, lying approximately parallel to the R.A. axis. It is worth noting that, although the angular scale is much larger, the molecular outflow observed towards SMM3 is oriented close to the Dec axis (see. Fig. 6b), and therefore at a large angle from the axis of the water maser distribution. The maser features detected in SMM3 are strongly red-shifted, with a line of sight velocity 10 – 12 km s-1 higher than the LSR velocity of the ambient gas.
Fig. 6d shows the radio jet observed towards SMM1 by Curiel et al. (1993) using the VLA at 3.6 cm. It consists of three main components aligned along a southeast-northwest direction (P.A. = 53°), with the central and northwest components connected by a bridge of weaker emission. The central component appears elongated, having a deconvolved size of 200 60 AU, with a position angle close to that of the radio jet. The radio continuum emission of the northwest jet component is thought to originate from shock waves produced by bullets emitted by the YSO into the surrounding, dense ambient material. The red cross indicates the VLA position of the 22.2 GHz water masers, located close to the emission peak of the central component. It should be noted that the separation between the maser and the continuum peak (03–04) is of the same order as the positional accuracy of the VLA maser (01) and continuum (02) maps, and therefore, with present data, we cannot say whether or not it is significant.
Fig. 6e shows the water maser map derived with four epochs of VLBA observations towards SMM1. Thirteen water maser features are detected and for five of them, observed at two or more epochs, (relative) proper motions are measured. Maser features are concentrated in two small clusters (size 5 AU), separated on the sky by 25 AU along a northeast-southwest direction (P.A. 50°). The two clusters appear to move away from each other, as indicated by the (relative) transverse velocities measured for features in the northeastern cluster, having similar values (30 – 40 km s-1) and consistent motion away from the southwestern cluster. All the maser features are strongly red-shifted with respect to the LSR velocity of the ambient gas, by 10 – 12 km s-1 for the masers in the northeastern cluster, and by 14 – 15 km s-1 for those in the southwestern cluster.
4.4 RNO 15-FIR
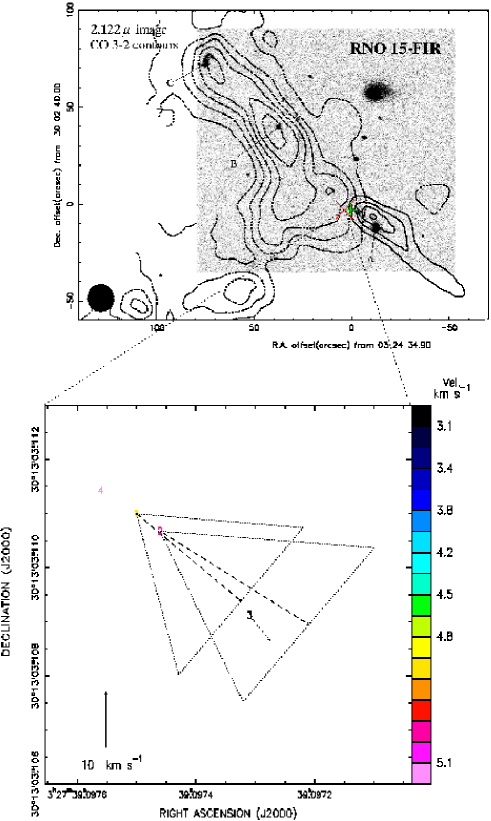
The upper panel of Fig. 7 presents a H2 2.12 m image of the RNO 15-FIR outflow region (Davis et al. 1997b) with contours of the CO integrated intensity map by Davis et al. (1997a) overlaid. The accuracy of the positional registration of the H2 and CO images is a few arcseconds. Several bright, compact H2 knots lie along the axis of the CO outflow, and are found to have good spatial correspondence with the peaks of the CO emission. These observations indicate the presence of a highly collimated (opening angle 10°) jet/outflow, directed at P.A.32°. The IRAS position of RNO 15-FIR lies close to the CO outflow center. The bolometric luminosity of the region is L⊙, and both the measured envelope mass (0.9 M⊙) and evolution models indicate a protostellar mass 1 M⊙ (Froebrich et al. 2003; Froebrich 2005).
The red cross denotes the absolute position of the 22.2 GHz water masers (accurate to 2 mas222The uncertainty of the absolute position is dominated by the phase-reference calibrator position uncertainty, as the position of the reference maser spot in the phase-referenced map is derived with an accuracy of a few tenths of mas.) derived by means of our phase-reference VLBA observations. The VLBA water maser map is shown in the lower panel of Fig. 7. We detected four maser features and three of them were persistent over the two VLBA epochs. Taking advantage of the phase referencing technique used in the observations of this source, for the three persistent maser features, we could derive the absolute proper motions. The proper motions shown in Fig. 7 have been corrected for the earth and solar motions, and for the galactic rotation, which together account for 40 – 50% of the apparent proper motion of the reference spot. A simple flat circular rotation model of the Galaxy was assumed, using a galactic center distance of 8.5 kpc and a rotation velocity at the solar circle of 220 km s-1. The distance assumed for RNO 15-FIR is 0.35 kpc.
The four maser features are distributed along a line that coincides with the direction of their motion. The most widely separated features are only 1.4 AU apart. The magnitude of the measured proper motions is in the range of 10 – 40 km s-1. The line of sight velocities of the maser features are within 1 – 2 km s-1 from the LSR velocity of the ambient gas, 4.7 km s-1.
5 Discussion
5.1 Serpens SMM1
The low-mass YSO SMM1 in the Serpens molecular core is the source for which our VLBA observations produced the highest number of detected maser features and measured proper motions. SMM1 is the brightest of the mm sources detected in the Serpens protocluster by Testi & Sargent (1998). OVRO continuum mm observations by Hogerheijde et al. (1999) resolve the dust emission from the envelope surrounding the central protostar: the best fit to the data is obtained with an extended envelope, having a radius of 8000 AU and a mass of 8.7 M⊙, plus the contribution of a compact (100 AU radius) source with a mass of 0.9 M⊙. Since the calculated envelope mass exceeds the upper limit on the protostellar mass of 3.9 M⊙ (derived from the bolometric luminosity), Hogerheijde et al. (1999) conclude that SMM1 is likely a Class 0 protostar, with most of the final mass to be still accreted. Davis et al. (1999) observed the submillimeter continuum emission of the Serpens region using the SCUBA bolometer array camera mounted on the JCMT. Fitting the continuum emission of SMM1 from the mid-infrared to the millimetre wavelengths with an optically thin blackbody curve, these authors obtained a value for the best fit temperature of 38 K. Since this temperature is significantly higher than the typical value (20 K) observed towards Class 0 YSOs, Davis et al. (1999) suggest that SMM1 may be found at an intermediate evolutionary stage between Classes 0 and I.
The Class 0 and/or Class I evolutionary stages are the ones where most of the protostellar mass is accreted, and YSOs belonging to these classes should be surrounded by a torus- or disk-like distribution of matter, accreting onto the protostellar surface. For SMM1, Brown et al. (2000) have resolved the submillimeter dust emission surrounding the YSO, using the James Clerk Maxwell Telescope – Caltech Submillimeter Observatory single-baseline interferometer on Mauna Kea (Hawaii). By fitting a power-law disk model to the data, these authors derive a lower limit to the disk mass of 0.1 M⊙ and a disk radius of 90 AU.
The position angle on the sky of the accretion disk or torus is expected to be perpendicular to the axis of the radio jet observed towards SMM1 (see Fig. 6d), whose spatial structure has been imaged using the VLA with a linear resolution (60 AU), comparable with the estimated disk radius. The two observed clusters of water maser features are oriented on the sky along a direction approximately perpendicular to the axis of the radio jet (Figs.6d and 6e. The location of the water masers (at the origin of the radio jet), the diameter of the maser distribution (25 AU, smaller than the expected disk size) and its orientation on the sky, are all compatible with the scenario where the maser emission originates close to the inner regions of the accretion disk.
The physical conditions for 22.2 GHz water maser excitation require high gas density (n cm-3) and temperature (). Excitation models predict that these conditions can be reached in the shocked layers of gas behind both high-velocity ( 50 km s-1) dissociative (J-type) (Elitzur et al. 1989) and slow ( 50 km s-1) non-dissociative (C-type) (Kaufman & Neufeld 1996) shocks, propagating in dense regions (pre-shock density is cm-3). If the water maser emission towards SMM1 originates from gas in the accretion disk at distances of (only) 10–20 AU from the protostar, one might argue that the temperature and the density of the environment would be sufficiently high to excite the water masers without the need of shock heating and compression. In this view the water masers might trace the kinematics of the gas in the disk. However, as we discuss in the following, the detected maser features appear to move faster than expected if their acceleration were due to the gravitational field of the low-mass YSO in SMM1.
As already mentioned, all the maser features have line of sight velocities red-shifted by more than 10 km s-1 with respect to the LSR velocity of the ambient gas (8.5 km s-1), and the measured relative transverse velocities have magnitudes in the range 30 – 40 km s-1. The distance to SMM1 is not accurately known. Adopting the maximum value reported in the literature of 400 pc (Hurt & Barsony 1996), an upper limit for the bolometric luminosity of 77 L⊙ is derived, which translates into an upper limit for the protostellar mass (taking the mass of a main-sequence star with the same luminosity) of 3.9 M⊙ (Hogerheijde et al. 1999). This value is probably larger than the likely stellar mass, as SMM1 is a YSO in an early stage of evolution and it is thus expected to be overluminous compared to the final main-sequence luminosity. The velocity of gas rotating in a Keplerian disk around a 4 M⊙ object at a distance of 12.5 AU (the radius of the observed water maser distribution) is 20 km s-1. Comparing this value with the measured transverse velocities, one sees that, even assuming an implausibly high value for the mass of the YSO, the expected velocities for Keplerian rotation are lower than those measured.
If the masers originate from the gas in a disk or toroid, then they likely trace a velocity field other than Keplerian rotation. The fact that the line of sight velocities of the maser features are strongly red-shifted, is a hint for identifying the driver of the maser motion. Fig. 6d shows that the emission from the northwestern lobe of the radio jet observed in Serpens SMM1 is stronger and has a better defined structure than the emission associated with the southeastern lobe. OVRO molecular line observations (angular resolution of 1 – 5) by Hogerheijde et al. (1999) towards Serpens SMM1 support the presence of a bipolar molecular outflow oriented along the same direction of the radio jet, with the highest velocity and more collimated flows being red-shifted towards the northwest and blue-shifted towards the southeast. Although the angular resolution of the OVRO molecular line data is worse (by a factor 3 – 10) than that of the 3.6 cm VLA-A observations of the radio jet, the angular scales sampled with the two different outflow tracers are sufficiently similar to infer the inclination angle of the jet axis with the line of sight: the ionized gas associated with the northwestern jet lobe corresponds to the red-shifted lobe of the molecular outflow and, hence, has to be moving away from us.
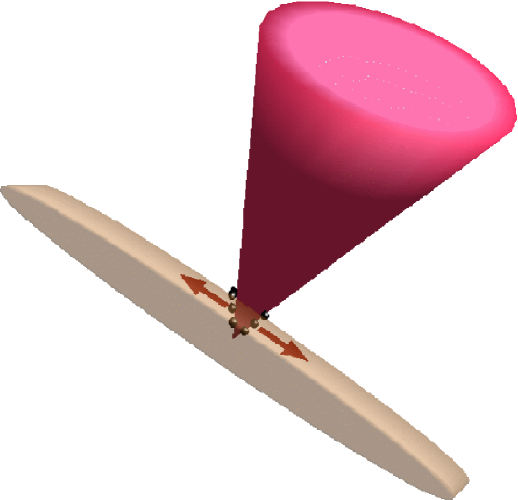
The red-shifted velocities of the water masers might be naturally explained if they originated from dense shocked material at the interface between the red outflow lobe and the circumstellar material. Our proposed interpretation is that the water maser emission emerges at the very base of the jet, where one can imagine that the jet gas interacts with the material surrounding the YSO in a toroid or “thick” disk. It is worth noting that, with the VLA angular resolution of 60 AU, the central component of the radio jet (see Fig. 6d) is unresolved along its minor axis. At the base of the jet where the interaction with the disk may occur, the (sky-projected) transverse size of the jet could be even smaller than the separation (25 AU) between the two observed clusters of water maser features, which might trace the shocked molecular gas along the walls of the cavity excavated by the outflow in upper layers of the toroid. One might expect the water masers to move significantly faster than the gas of the Keplerian disk, and mainly trace the outflow motion induced by the jet on the surrounding molecular gas. Figure 8 presents a sketch of the proposed interpretation.
This interpretation does not conflict with the observational result that the measured maser proper motions are transverse to the jet axis, since, measuring only relative transverse velocities prevents us from detecting any common motion of all the maser features (eventually directed along the jet axis). To account for the detected transverse motion of the two maser clusters (with magnitude of 30–40 km s-1), a lateral expanding motion of the jet of amplitude 15–20 km s-1 is required. Since a collimated outflow should have the parallel (to the jet axis) component of velocity significantly larger than the transverse component, we speculate that the maser spot motion along the jet axis should be 20 km s-1. Then, the (relatively small) redshifts of 10–15 km s-1 measured for the water masers might be explained if the axis of the jet were close to the plane of the sky. This proposed scenario is partially supported by the high velocities found for the ionized gas. By means of multi-epoch 3.6 cm VLA-A observations, Curiel et al. (1993) have measured the proper motion of emission knots in the jet lobe deriving velocities of 200 km s-1.
It is clear that this interpretation can and should be tested by measurements of absolute proper motions of the maser features. Further VLBI observations will also allow us to establish if the spatial and velocity distribution we have now observed continues over time, as one would expect in the case that, as we are suggesting, the water masers trace a stable kinematic structure.
5.2 RNO 15-FIR
Our results towards RNO 15-FIR are a good example of the advantages of performing VLBI observations in phase-reference mode. Although only four maser features were detected, the measurement of absolute proper motions for three of them offers a rather straightforward interpretation of the water maser kinematics. Fig. 7 shows that the absolute position of the maser emission is close to the centre of the molecular outflow observed in CO on angular scales much larger than those traced by the water masers. The absolute maser velocities are all found to be aligned along a direction that agrees well with the axis of the CO molecular outflow and the line connecting the bright, compact H2 knots. Our suggested interpretation is that the water masers are tracing the innermost portion of the molecular outflow, likely emerging from condensations of material shocked by the passage of jet material from the low-mass YSO.
VLA observations by Meehan et al. (1998) towards RNO 15-FIR did not detect any radio continuum emission at 4.8 and 8.4 GHz (with upper limits, of 0.12 and 0.24 mJy beam-1, respectively). If we compare this result with the VLA observations towards Serpens SMM1, where an ionized jet is detected with peak fluxes of a few mJy, we would argue that in RNO 15-FIR the volume of the circumstellar gas ionized by interaction with the jet is too small to produce detectable free-free emission. The values of mass, momentum and energy derived for the CO molecular outflow in RNO 15-FIR by Davis et al. (1997a) are significantly lower than those of other outflows from heavily embedded, low-mass YSOs.
Using ISOPHOT and SCUBA measurements of this region, Froebrich et al. (2003) determined the spectral energy distribution (SED) from submillimeter to far-infrared wavelengths, obtaining a ratio of Lsmm/Lbol which classifies RNO 15-FIR as a Class 0 source. However, the relatively high value of bolometric temperature, 44.6 K, resulting from the fit to the SED, may suggest that RNO 15-FIR is in a later, Class 0/Class I transition, evolutionary stage. Based on the evolutionary model of Froebrich et al. (2003), which combines the unification scheme (Smith 2000) with the framework for protostellar envelopes (Myers et al. 1998), RNO 15-FIR and Serpens SMM1 should have approximately the same age, 3 – 3.5 104 yr. The quite different bolometric luminosities of the two sources can be explained in terms of different values for the mass of the two YSOs. RNO 15-FIR is believed to be less massive than Serpens SMM1 by a factor of a few. The corresponding lower values of mass accretion rate expected for RNO 15-FIR would translate into lower mass ejection rates, which might partly explain the strikingly different properties of the radio continuum and molecular line emissions observed for the outflows associated with the two sources.
In contrast to what we observed in Serpens SMM1, where the water maser spatial distribution is transverse to the axis of the radio jet, the few water maser features detected in RNO 15-FIR are aligned along a direction parallel to the orientation of the molecular outflow. Based on this, we propose that the maser emission originates from dense clumps of gas displaced along the axis of the jet emitted by the YSO. Over comparable protostellar lifetimes, whereas the relatively powerful jet emitted by Serpens SMM1 succeeded in sweeping away from its course the densest portion (n cm-3) of the circumstellar material and creating a tunnel of lower density (nH – cm-3) ionized gas, that is not the case for the weaker jet emerging from RNO 15-FIR, which is undetectable because still confined within a very dense envelope of molecular gas. In conclusion, we suggest that in RNO 15-FIR the alignment of the water maser features parallel to the axis of the molecular outflow indicates that very dense clumps of circumstellar material are still to be found on the way along the jet.
5.3 Maser feature structure and variability
Figures 3 and 4 show the maser features’ structure in Serpens SMM1 and RNO 15-FIR respectively. It is interesting to note that in both sources all the spatially extended features present spot distributions with similar orientation, which is approximately parallel to the axis of the radio (for SMM1) or molecular (for RNO 15-FIR) jet observed at larger scales (see Figures 6 and 7). The previous discussion has suggested that in both sources the maser emission is excited by the interaction of the jet with dense surrounding gas. If the water maser features originate behind shocks, a gradient of density, temperature and velocity is naturally expected along the shock propagation direction, which, for jet induced shocks, is parallel to the jet motion. The fact that the maser features are observed to be spatially extended with orientation close to the jet axis therefore reinforces our interpretation that the origin and kinematics of the water masers stem from the YSO jet.
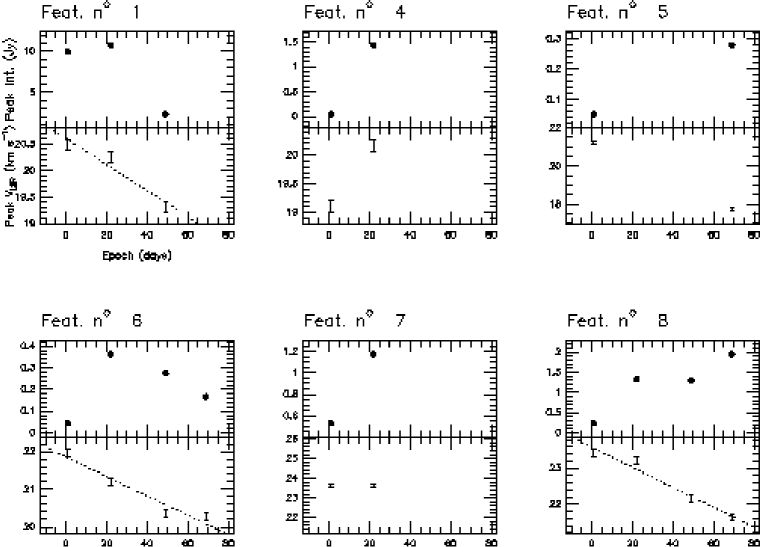
Figure 3 shows that the features in Serpens SMM1 that persist over three or more epochs (the ones with label numbers “1”, “6” and “8”) have a stably decreasing VLSR (i.e. spot and feature symbols have colours changing over time from red to blue). Figure 9 shows that the velocity of the emission peak of these features decreases by 1.5 – 2 km s-1 over a time span of 50 – 70 days, corresponding to a deceleration of 0.03 cm s-2. This value is too high to result from the gravitational forces of the YSO in SMM1. Assuming a (maximum) central mass of 4 M⊙ and a (minimum) distance of 10 AU, we estimate an upper limit to the gravitational acceleration of 0.006 cm s-2. In agreement with the proposed ”jet” origin for the maser emission in SMM1, a possible explanation for the measured features’ decelerations might be that the shocks responsible for the maser excitation are slowed down as they proceed through the dense material surrounding the YSO. The law of variation of the velocity with time depends on the nature of the shock (i.e., its cooling efficiency) and/or whether viscosity or turbulence contribute to the braking. The available data are insufficient to discriminate among the different possibilities.
As already noted in Section 4.2, Figure 5 shows that, in the case of feature ”6”, the variation of sky-projected positions with time is fitted better by a second-order polynomial (i.e. a uniformly accelerated motion) than by a linear fit (i.e. a constant motion). The RMS of the residuals (both for the motion along the R.A. and Dec axis) is only 1–2 as for the quadratic fit, whereas for the linear fit it is of the order of tens of microarcseconds. Using and respectively to indicate the initial (at first-epoch) velocity and the constant acceleration of the uniformly accelerated motion, the values derived with the quadratic fit are: = 42 km s-1, = -15 km s-1 month-1, for the motion along the R.A. axis; = 13 km s-1, = 11 km s-1 month-1, for the motion along the Dec axis. The ”average” velocity of the uniformly accelerated motion (25 km s-1 and 26 km s-1 along, respectively, the R.A. and Dec axis) is consistent with the proper motion value derived with the linear fit (see Table 2).
The motion of feature ”6” is clearly decelerating eastward and accelerating northward. Along both directions, the magnitude of the derived acceleration is high enough to let the initial (first-epoch) and the final (last-epoch) velocity differ by a factor of 2 with respect to the average (central) velocity. The deceleration measured for feature ”6” along the line of sight is 0.8 km s-1 month-1, more than one order of magnitude smaller than the magnitude of the accelerations derived for the motions along the R.A. and the Dec axis. This is in qualitative agreement with the jet model proposed to explain the maser kinematics in Serpens SMM1, which requires the jet to be nearly in the plane of the sky. We then expect that the maser features’ accelerations (decelerations) are also close to the plane of the sky. In interpreting the sky-projected motion of feature ”6” one has to keep in mind that it is measured relative to another feature (label number ”8”). The derived acceleration of feature ”6” is actually the difference of the accelerations (decelerations) of features ”6” and ”8”, both along the R.A. and Dec axis. Our interpretation is that, since the two features are moving across different portions of the dense material surrounding the YSO, they are decelerating at different rates, the eastward (northward) motion of feature ”6” changing more (less) rapidly than for feature ”8”.
6 Conclusions
This article reports the first results of a long-term project whose aim, by using the VLBA, is to survey the 22.2 GHz water maser emission in a selected sample of low-mass YSOs. The sample includes objects in different evolutionary stages (Class 0, Class 0/Class I transition, Class I) so that the water maser spatial and velocity structure may be correlated with the YSO age. We present VLBA water maser data from 2003 from a cluster of low-mass YSOs in the Serpens molecular core and from the low-mass YSO RNO 15-FIR.
Towards Serpens SMM1, the most intense submillimeter source of the Serpens molecular core, the maser emission is found to originate from two clusters of strongly red-shifted (more than 10 km s-1) features separated by 25 AU. The measured relative transverse velocities of the maser features are parallel to the cluster-connecting line, which in turn is approximately perpendicular to the axis of the radio jet observed towards SMM1 on length scales of hundreds of AU. Based on their spatial distribution, water masers might originate in the accretion disk surrounding the YSO. However, the measured maser (line of sight and transverse) velocities appear too large to be compatible with Keplerian rotation around a central mass 4 M⊙. We suggest that the water maser emission originates at the very base of the radio jet, tracing the interaction region of the red-shifted lobe of the jet with the dense material of the accretion disk. Since the jet is much faster than the gas rotating in the disk, the water maser kinematics are driven by the jet. The line of sight velocities of several features decrease at a rate of 1 km s-1 month-1 and for one feature (label number ”6”) the sky-projected motion (relative to another feature) appears to be accelerated (decelerated) at a rate of 10–15 km s-1 month-1. The proposed interpretation is that the shocks, excited by the propagating jet and harboring the maser emission, are slowed down as they proceed through the dense material surrounding the YSO.
Only a few (four) maser features were detected towards RNO 15-FIR. However, since absolute proper motions were measured, the available data is sufficient to suggest the position of the water maser birthplace. The water maser features are distributed along a line, whose orientation on the sky coincides with the common direction of all the measured absolute velocities. Such a spatial and velocity distribution is expected if water masers trace a tightly collimated flow. Since the derived VLBA water maser absolute position locates them just at the center of the bipolar molecular outflow observed towards RNO 15-FIR (on angular scales of tens of arcsecs), and since the axis of the molecular outflow is parallel with the direction of elongation and motion of the maser features, we suggest that the water masers trace the innermost portion of the molecular outflow.
On the basis of the measured bolometric luminosities and temperatures, evolutionary models indicate that RNO 15-FIR and Serpens SMM1 share a comparable evolutionary stage, both of them still being Class 0 sources, even if more evolved than an average Class 0 protostar. Despite this, we observe significant differences in the water maser spatial and velocity distribution between the two sources. One possible explanation may be related to the different value of protostellar mass of the two YSOs. SMM1 is likely more massive than RNO 15-FIR by a factor of at least a few. A higher value of protostellar mass could imply correspondingly higher values of mass accretion (and ejection) rates. If the jet emitted by the YSO is sufficiently powerful to sweep away the densest portions of circumstellar gas, eventually the molecular gas density along the jet axis becomes too low (n cm-3) for the excitation of the water masers. In that case, however, water maser emission can still occur if the jet interacts with the dense material of the accretion disk. At present, all this is highly speculative. To put these arguments on firm ground it will be necessary to expand our observations to larger samples of objects of various masses and in various evolutionary stages. Additionally, our proposed interpretation of the water maser morphology and kinematics in the Serpens SMM1 source need to be put on firm ground by measuring the absolute location and proper motions of the maser spots.
Acknowledgements.
It is a pleasure to thank Prof. Tetsuo Sasao for allowing us to use his program for the computation of apparent proper motions due to annual parallax, solar motion with respect to the LSR, and galactic rotation. We also thank the anonymous referee for his/her warning about the evidence for maser feature accelerations contained in our data.References
- Andre & Montmerle (1994) Andre, P. & Montmerle, T. 1994, ApJ, 420, 837
- Bally et al. (2000) Bally, J., O’Dell, C. R., & McCaughrean, M. J. 2000, AJ, 119, 2919
- Brown et al. (2000) Brown, D. W., Chandler, C. J., Carlstrom, J. E., et al. 2000, MNRAS, 319, 154
- Claussen et al. (1998) Claussen, M. J., Marvel, K. B., Wootten, A., & Wilking, B. A. 1998, ApJ, 507, L79
- Curiel et al. (1993) Curiel, S., Rodriguez, L. F., Moran, J. M., & Canto, J. 1993, ApJ, 415, 191
- Davis et al. (1997a) Davis, C. J., Eisloeffel, J., Ray, T. P., & Jenness, T. 1997a, A&A, 324, 1013
- Davis et al. (1999) Davis, C. J., Matthews, H. E., Ray, T. P., Dent, W. R. F., & Richer, J. S. 1999, MNRAS, 309, 141
- Davis et al. (1997b) Davis, C. J., Ray, T. P., Eisloeffel, J., & Corcoran, D. 1997b, A&A, 324, 263
- Elitzur et al. (1989) Elitzur, M., Hollenbach, D. J., & McKee, C. F. 1989, ApJ, 346, 983
- Froebrich (2005) Froebrich, D. 2005, ApJS, 156, 169
- Froebrich et al. (2003) Froebrich, D., Smith, M. D., Hodapp, K.-W., & Eislöffel, J. 2003, MNRAS, 346, 163
- Furuya et al. (2003) Furuya, R. S., Kitamura, Y., Wootten, A., Claussen, M. J., & Kawabe, R. 2003, ApJS, 144, 71
- Furuya et al. (2001) Furuya, R. S., Kitamura, Y., Wootten, H. A., Claussen, M. J., & Kawabe, R. 2001, ApJ, 559, L143
- Furuya et al. (2000) Furuya, R. S., Kitamura, Y., Wootten, H. A., et al. 2000, ApJ, 542, L135
- Gregersen et al. (1997) Gregersen, E. M., Evans, N. J., Zhou, S., & Choi, M. 1997, ApJ, 484, 256
- Hogerheijde et al. (1999) Hogerheijde, M. R., van Dishoeck, E. F., Salverda, J. M., & Blake, G. A. 1999, ApJ, 513, 350
- Hurt & Barsony (1996) Hurt, R. L. & Barsony, M. 1996, ApJ, 460, L45+
- Kaufman & Neufeld (1996) Kaufman, M. J. & Neufeld, D. A. 1996, ApJ, 456, 250
- Meehan et al. (1998) Meehan, L. S. G., Wilking, B. A., Claussen, M. J., Mundy, L. G., & Wootten, A. 1998, AJ, 115, 1599
- Myers et al. (1998) Myers, P. C., Adams, F. C., Chen, H., & Schaff, E. 1998, ApJ, 492, 703
- Patel et al. (2000) Patel, N. A., Greenhill, L. J., Herrnstein, J., et al. 2000, ApJ, 538, 268
- Reid et al. (1988) Reid, M. J., Schneps, M. H., Moran, J. M., et al. 1988, ApJ, 330, 809
- Seth et al. (2002) Seth, A., Greenhill, L. J., & Holder, B. P. 2002, ApJ, 581, 325
- Shu et al. (1987) Shu, F. H., Adams, F. C., & Lizano, S. 1987, ARA&A, 25, 23
- Simon et al. (2000) Simon, M., Dutrey, A., & Guilloteau, S. 2000, ApJ, 545, 1034
- Smith (2000) Smith, M. D. 2000, Irish Astronomical Journal, 27, 25
- Testi & Sargent (1998) Testi, L. & Sargent, A. I. 1998, ApJ, 508, L91
- Testi et al. (2000) Testi, L., Sargent, A. I., Olmi, L., & Onello, J. S. 2000, ApJ, 540, L53