A Bar Signature and Central Disk in the Gaseous and Stellar Velocity Fields of NGC 5448
Abstract
We analyse SAURON kinematic maps of the inner kpc of the early-type (Sa) barred spiral galaxy NGC 5448. The observed morphology and kinematics of the emission-line gas is patchy and perturbed, indicating clear departures from circular motion. The kinematics of the stars is more regular, and display a small inner disk-like system embedded in a large-scale rotating structure. We focus on the [O iii] gas, and use a harmonic decomposition formalism to analyse the gas velocity field. The higher-order harmonic terms and the main kinematic features of the observed data are consistent with an analytically constructed simple bar model. The bar model is derived using linear theory, considering an perturbation mode, and with bar parameters which are consistent with the large-scale bar detected via imaging. We also study optical and near infra-red images to reveal the asymmetric extinction in NGC 5448, and we recognise that some of the deviations between the data and the analytical bar model may be due to these complex dust features. Our study illustrates how the harmonic decomposition formalism can be used as a powerful tool to quantify non-circular motions in observed gas velocity fields.
keywords:
galaxies: bulges – galaxies: spiral – galaxies: evolution – galaxies: formation – galaxies: kinematics and dynamics – galaxies: structure1 Introduction
Dynamical studies of spiral galaxies often make the distinction between the bulge and the disk: the bulge is associated with the hot “spheroidal” component which mainly contains stars, and the disk is a rapidly rotating thin structure which also contains a substantial fraction of the total amount of interstellar gas. Line-of-sight velocity distributions are efficient probes of the dynamical structures of these systems, and can be used to derive the mass distribution, structural properties, and perturbations of the gravitational potential linked to or modes, or to external triggers such as interactions. These can be obtained with classical long-slit spectrography, although it requires a-priori assumptions for the orientation of the slits. A time-consuming way to obtain velocity fields through single slits is to spatially scan the galaxy with successive individual exposures (e.g., Statler 1994; Ohtani 1995). Integral field spectrography in the optical (IFS, Adam et al. 1989; Afanasiev et al. 1990; Bacon et al. 1995; Davies et al. 1997; García-Lorenzo, Arribas & Mediavilla 2000; Roth, Laux & Heilemann 2000; Bacon et al. 2001; Bershady et al. 2004) was designed to uniformly cover the field of view which makes it possible to study these systems in a much improved way: the analysis is not constrained by a priori choices of slit position, and the gaseous and stellar components can be observed simultaneously. Optical IFS is often used complementarily to H i and Fabry-Perot scanning interferometers, (e.g., van Gorkom et al. 1986; Plana & Boulesteix 1996) as the latter usually have excellent spatial coverage but a limited spectral domain, only probing a couple of lines (mostly in emission).
Although circular rotation is the dominant kinematic feature of the disk component, previous observational as well as theoretical studies have shown the presence of non-circular motions (e.g., Freeman 1965; Combes & Gerin 1985; Shlosman, Frank & Begelman 1989; Athanassoula 1994; Shlosman & Noguchi 1993; Moiseev 2000; Regan & Teuben 2004; Wong, Blitz & Bosma 2004). Cold disk-like systems are more prone than bulges to perturbations and instabilities, the dissipative gaseous component being more responsive than the stellar component (e.g., Thielheim & Wolff 1982). Perturbations of the gas dynamics can lead to significant galaxy evolution via, e.g., redistribution of the angular momentum, triggering of star formation, or building of a central mass concentration.
Bars are potential actors in this context as they can drive mass inwards or outwards, and may participate in the complex process which eventually leads to the fuelling of an active nucleus (e.g., Simkin, Su & Schwarz 1980, Sakamoto, Baker & Scoville 2000). The presence of large-scale bars has been correlated with starbursts (e.g., Martinet & Friedli 1997) and nuclear rings (Shlosman 1999), but only weakly if at all with nuclear activity (e.g., Knapen et al. 2000). This may not be so surprising as the fuelling of an active galactic nucleus (AGN), i.e., gas accretion onto a massive black hole, involves rather small spatial and short time-scales, so might not be related to the kpc scale bar. Inner small bars (Shlosman et al. 1989) may sometimes help to link the different spatial scales (Emsellem, Goudfrooij & Ferruit 2003), but they probably cannot serve as a universal mechanism. AGN activity is short-lived and occurs in the central astronomical units of galaxies, whereas current studies have focused on long-lived phenomena influencing the central kpc scale. In order to properly study the influence of a bar on the redistribution of mass in the central kpc of a galaxy, we need to obtain constraints both on the source of the underlying gravitational potential and on some tracer of the on-going perturbations. This can be achieved by simultaneously studying the stellar and gas dynamics.
We have observed 24 early-type spiral (Sa) galaxies with the SAURON Integral Field Spectrograph (Bacon et al. 2001), mounted at the 4.2m William Herschel Telescope of the Observatorio del Roque de los Muchachos at La Palma (de Zeeuw et al. 2002). Most of these galaxies are found to have gas velocity fields that strongly deviate from that of a simple rotating disk. For the present study, we selected NGC 5448 out of the Sa SAURON sample which shows a clear sign of the presence of a bar in its photometry and which has a significant amount of ionised-gas (Falcón-Barroso et al. 2005). In this paper, we analyse both the stellar and gas kinematics obtained with SAURON, and quantify the non-circular gaseous motions in NGC 5448. To this aim, we build models with elliptical streaming motion and compare the resulting velocity structures with our observational data, using a harmonic decomposition technique. In section 2, we present our data. Section 3 outlines our analysis method of the gas kinematics. In section 4, we build a bar model for NGC 5448, and we present and discuss the corresponding results in sections 5 and 6.
2 The Data
NGC 5448 is a barred Sa active galaxy with prominent irregular dust lanes at different spatial scales. The RC3 classification of NGC 5448 is (R)SAB(r)a, with inclination of , systemic velocity of 1971 , position angle (PA) of , and total -band magnitude of 11.93. Photometry shows that this galaxy hosts a large-scale bar with two well-defined spiral arms emerging near the ends of the bar (Eskridge et al. 2002). The inner parts of the arms are somewhat patchy and form a broken ring, the outer parts of the arms being smoother (Sandage & Bedke 1994). This galaxy has a nuclear elongated feature of about 10″ (Fathi & Peletier 2003) with bluer colour than its surroundings (Carollo et al. 2002). Ho, Filippenko, & Sargent (1995) classified the nucleus as an AGN: its central aperture spectrum exhibits a clear broad-line emitting region. Laine et al. (2002) classified NGC 5448 as a non-Seyfert.
2.1 SAURON Observations
We observed NGC 5448 with SAURON on April the fourteenth 2004. Detailed specifications for the instrument, data, reduction procedure, and the data preparation procedure can be found in Bacon et al. (2001), de Zeeuw et al. (2002), and Emsellem et al. (2004). A brief summary of the instrument and data characteristics is presented in Table 1. We obtained 4 exposures of 1800 s each, producing a total of 1431 simultaneous galaxy spectra per frame, together with 146 sky spectra 19 away from the main field. We also observed standard stars to be used for accurate velocity, flux, and line-strength calibration of our observed galaxy. Wavelength calibration was done using arc lamp exposures taken before and after each target exposure. The standard reduction was performed using the XSauron software package developed at the CRAL (Lyon), providing a fully calibrated datacube for each individual exposure. We merged the 4 spatially dithered exposures after a resampling to a common spatial scale of per pixel, leading to a total of 1973 spectra within our field.
| Field of View | |
|---|---|
| Pixel Size | |
| Instrumental Disp. | 108 |
| Spectral Range | [4820 - 5280] Å |
| Spectral Features | H, [O iii], Fe5015, Mg, [N i], Fe5270 |
2.2 Stellar and Gaseous Kinematic Maps
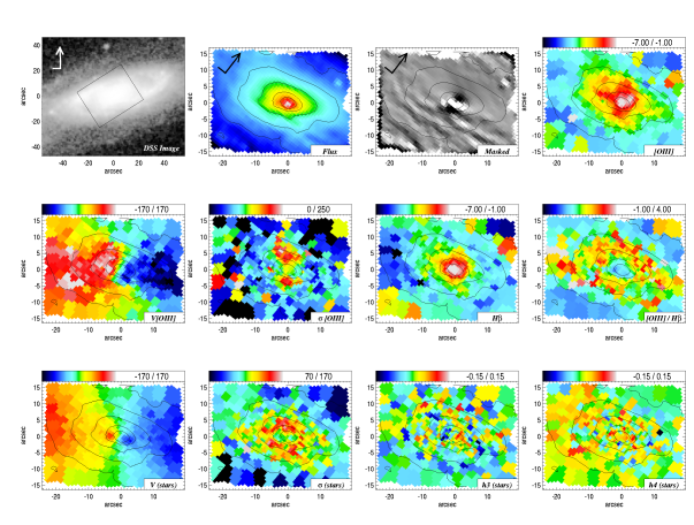
The signal-to-noise () ratio of individual spectra varies considerably throughout the field: in order to homogenise the we applied the Voronoi 2D-binning technique of Cappellari & Copin (2003). We have set a target value of 60 to be able to derive reliable higher-order moments of the stellar velocity distribution. Penalised Pixel Fitting (pPXF, Cappellari & Emsellem 2004) was used to derive the stellar line-of-sight velocity distribution parametrised by a Gauss-Hermite series up to and including the fourth order (van der Marel & Franx 1993; Gerhard 1993). The optimal stellar template in pPXF was built with a combination of stellar spectra from Jones (1997) and synthesis spectra from Vazdekis (1999) as in Emsellem et al. (2004). The derived stellar mean velocity , mean velocity dispersion , and higher order velocity moments and maps, are presented in bottom row of Fig. 1. We discuss the maps in section 5.
The method which we have applied to derive the emission-line kinematics is described and validated in Sarzi et al. (2005) and Falcón-Barroso et al. (2005). It consists of iteratively searching for the emission-line velocities and velocity dispersions, while solving at each step for both their amplitudes and the optimal combination of the stellar templates over the full SAURON wavelength range. No masking of the regions affected by emission is thus required.
Our binning scheme was optimised for the derivation of reliable stellar kinematics, but is not necessarily well adapted to analyse the emission-line gas. Since the gaseous component commonly rotates faster than the stellar component, to obtain reliable gas kinematics, in general a lower is required. Moreover, gas and stars do not necessarily share the same spatial distributions. As a consequence, the stellar bins are often larger than necessary for the gas, implying a loss of spatial information for analysing the gaseous component (Fathi 2004). Accordingly, the data that we present in this paper has a minimum stellar of 60 and a minimum emission-line amplitude-over-noise of 3.
Finally, we have carefully inspected the emission-line profiles to search for possible asymmetric profiles but have not found any significant deviation from a pure Gaussian, nor any significant indication for more than one component being present in the profiles, at least at the instrumental resolution of SAURON. We know from other SAURON studies of e.g., NGC 1068 (Emsellem et al. 2005) that we can resolve several components in very strong AGNs.
3 Analysing Gas Velocity Fields
3.1 Circular and Non-Circular Kinematics
In this section we start with a simple mathematical model, and then add complexity as required by the observational constraints. In the simplest model, the galactic disk is purely rotational, has negligible velocity dispersion, and is infinitesimally thin. In the presence of axisymmetric radial and vertical velocities, and when taking into account the effect of projection and the convention that positive line-of-sight velocities correspond to recession, the line-of-sight velocities can be represented by
| (1) |
where is the systemic velocity of the galaxy, and are the rotational and radial velocities, and is the vertical velocity component, which we set to zero throughout this paper. The inclination of the galaxy ranges from for a face-on viewing and for an edge-on viewing. Furthermore, are polar coordinates in the plane of the galaxy related to observable Cartesian coordinates and (in the plane of the sky) by
| (2) |
where and are the coordinates for the centre, and is the PA of the projected major axis of the disk, measured with respect to north in counterclockwise direction. This simple model cannot explain most observed velocity fields. The gas kinematics in real galaxies exhibits radial and/or vertical motions due to, e.g., the presence of bars, spiral arms, which create angle-dependent velocities which cannot be explained using Eq. (1), and hence additional ingredients in the analysis method are required.
Several attempts have been made to investigate more complex velocity fields (Sakhibov & Smirnov 1989; Canzian 1993; Schoenmakers, Franx & de Zeeuw 1997 [hereafter SFdZ]; Fridman & Khoruzhii 2003; Wong et al. 2004; Krajnović et al. 2005). The main idea of these techniques is to deal separately with the “unperturbed” underlying component and the residual velocity field, obtained by subtracting the reconstructed unperturbed velocity field from the data. To solve the problem, as stated, one would have to know the unperturbed velocity component at a given radius. Unfortunately we do not know beforehand the unperturbed velocity field. A powerful technique for unveiling the perturbations makes use of the expansion of the velocity information in Fourier harmonic components. Following the terminology of SFdZ (see their appendix for the detailed derivation), given that the line-of-sight velocity can be expressed as a two-dimensional analytic function of galactocentric coordinates, it can be written as a Fourier series:
| (3) |
where is the number of harmonics, and and give us information about the nature of the perturbations, and they are tightly connected to the underlying potential. Note that and . Furthermore, numerical simulations by Burlak et al. (2000) have shown that this formalism is very stable and its results are rather insensitive to the presence of holes in the velocity field.
3.2 Tilted-Ring and Harmonic Decomposition
Our quantitative analysis uses the formalism of Eq. (3) combined with the tilted-ring method (Rogstad, Lockart & Wright 1974; Rogstad, Wright & Lockart 1976), inspired from the ROTCUR routine in the GIPSY package (Begeman 1987; van der Hulst et al. 1992). Accordingly, we divide the galaxy disk into concentric ellipses within which we fit the rotation velocity and the set of geometric parameters of Eq. (3). The method assumes that each pixel in the velocity field is identified with a unique position in the galaxy and that circular rotation is the dominant feature. We assume that our measurements refer to positions on a single inclined disk, i.e., that we do not expect a strong warp and/or overlapping spiral arms within the observed field. Accounting for harmonic perturbations up to order 3, this method results in a large parameter-space problem, and it requires some additional assumptions to obtain a physically meaningful solution. We obtain the parameters by proceeding as follows:
-
1.
We start from a simple inclined two-dimensional disk. In case of erroneous inclination, one would detect systematics in the residual field as explained in section 3.3. Using a two-dimensional disk produces a robust model, in the sense that warps and other deviations from this basic model should be prominent in the residual maps.
-
2.
Secondly, we fix the dynamical centre of the galaxy to coincide with the photometric centre. The photometric center is obtained by fixing the center of the band image, since the -band image is less affected by dust. The HST -band image and the SAURON image are then aligned with the HST -band image.
-
3.
At every radius, we fit , varying , PA, and . The result is used to fix the systemic velocity () simply as the mean value over radius, using Tukey’s bi-weight mean formalism (Mosteller & Tukey 1977), which is particularly advantageous for being non-sensitive to outliers. After , we fit the PA and , followed by fixing the PA in the same way as the was fixed.
-
4.
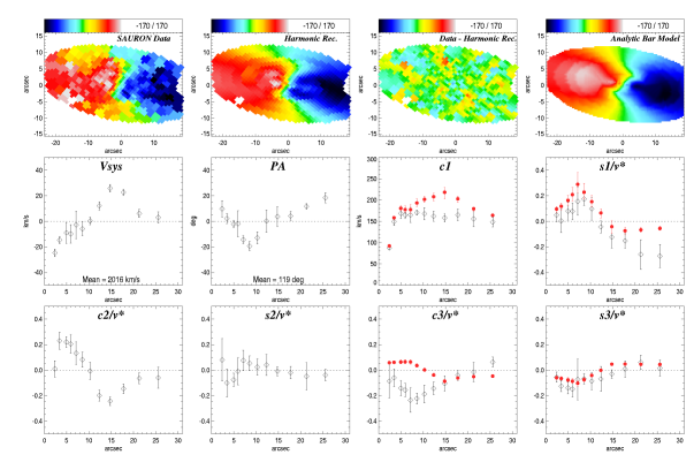
For each ring, we import the values derived according to the recipe above, and fit the rotation curve and the higher harmonic components (up to order 3) applying a -minimisation scheme. These results are presented in Fig. 2.
Analysing the first, second, and third harmonic components only, is an efficient way to analyse specific elements of the perturbations on the underlying potential. A perturbation of order creates and line-of-sight velocity terms (see e.g., Canzian 1993 and SFdZ). As a result, our fitted , , , and terms contain information about possible perturbations.
When sectioning the field into concentric rings, the radial extent of each ring is a free parameter which has to be pre-determined. For a range of possible ring radii, we have examined the fitted velocity information. Determination of the radial thickness of the rings becomes a trade-off between smoothness of the fitted velocity field, and robustness of the fit. Radially thin rings result in smooth fits, and thus smooth residual (Data - Fit) fields, whereas radially thick rings result in lower errors for the fitted parameters. Patchy gas distribution causes non-uniform distribution of points, and it is important to make sure that all the rings include enough points to fit harmonic parameters to reasonable accuracy. This is particularly important in the innermost and outermost points. We adopt a geometric increase of the ring radii (meaning that the radial width of the rings is increased by a factor 1 + step). Here, we adopt a step of , and only fit the inner 30″ of the SAURON velocity field, since rings larger than this radius are not sufficiently covered and hence do not deliver reliably derived parameters. Finally, since we are simultaneously fitting 6 harmonic components, we make sure that each ellipse contains at least data points, in order to obtain reliable errors.
3.3 Errors
Warner et al. (1973) and van der Kruit & Allen (1978) showed that assuming wrong input disk parameters could cause recognisable signatures in the residual velocity fields. SFdZ quantified these signatures in terms of harmonic expansion, and showed that the Fourier components due to non-circular motions will mix with those due to erroneous disk parameters and PA. Errors in the kinematic centre translate to the , and terms, while PA errors appear in the and terms, and inclination errors in the and terms. In the case of erroneous kinematic centre, the and the terms fall off as whereas the presence of a radius-independent mode shows the relation (Schoenmakers 1999). Our chosen centre coordinates do not deliver any of these situations. Another source of error is “pixel sampling” for which errors propagate onto the (as the rotation curve rises more gradually) and the term (as if inclination changes). This effect may also propagate onto the and parameters, although not significantly (Wong 2000). Our data and analysis does not require consideration of this effect since our spatial resolution is high enough.
Our data extraction code delivers error measurements for each individual pixel (Falcón-Barroso et al. 2005). We calculate the errors for the tilted-ring and harmonic parameters by means of Monte Carlo simulations. Repeated application of the tilted-ring method to the Gaussian randomised gas velocity field yields the uncertainties on the harmonic parameters. Our 500 simulations show that choosing geometrically increasing ring radii with steps of indeed yields satisfactory errors. The errors are low, and the parameter profiles are represented by an adequate number of points.
4 A Bar Model for NGC 5448
The SFdZ formalism is a very powerful tool for analysing velocity fields. One can analytically derive the higher-order harmonic parameters for potentials of desired form. Schoenmakers (1999) derived the harmonic parameters for a lopsided potential, and a more extensive expansion was done by Wong et al. (2004), who derived the higher-order harmonics for simple bar and two-armed spiral perturbations.
We import their model for a globally elongated gravitational potential, which, in the plane of the galaxy, consists of an axisymmetric component from Kuijken & Tremaine (1994), with a bi-symmetric potential of the form added to it. In the case of flat rotation curve, the potential is written as
| (4) |
where is the circular velocity and is the elongation of the potential. Introducing a constant damping term into the equations of motion and considering only the perturbation term (Lindblad & Lindblad 1994; Wada 1994), linear epicyclic approximation of Lin & Shu (1964) was applied to obtain an analytical solution for gaseous orbits in this barred potential. Since this model is restricted to perturbation, it affects only the first and third harmonic parameters (, , , and ). These depend on the amplitude of the damping term (), the ellipticity of the potential (), the corotation radius (CR), and the viewing angle (), where corresponds to end-on view.
We use these analytic harmonic parameters to reconstruct the signatures of prominent non-circular motions in the observed velocity fields. We build a library of models with varying bar parameters (, and a range of bar sizes), viewed from different angles (). The effects of and on the velocity field are predictable. The bar signature is weaker for a larger damping factor and/or a smaller flattening of the potential. However, the effect of varying is not straightforward.
Investigating our library of dissipative bar models, we find that only for a certain combination of parameters the model exhibits a strong twist of the gas zero-velocity curve similar to our data (Fig. 1). We quantify the comparison by calculating, for each bar model in our library, the discrepancy between the reconstructed velocity field and the observed velocity field, in terms of the goodness-of-fit parameter . Care has to be taken at the inner Lindblad resonance (ILR), since there the linear epicyclic theory breaks down. At the ILR, due to the presence of non-linear terms, which are not accounted for by the analytic epicyclic theory, the weak-bar model is not expected to reproduce the velocity field. Hence, for a small region around the ILR, we interpolate the bar models.
The minimum goodness-of-fit parameter yields the best-fit bar model, for which we show in Fig. 2 the reconstructed velocity field and harmonic terms (red filled circles). The best-fit model accounts for an perturbation of a single bar, with potential ellipticity , damping term , viewing angle , and CR = . The errors on the bar parameters follow from the bar models for which the difference between the corresponding and is below the 99.7% level. From the harmonic terms of these bar models, we also obtain an estimate on the uncertainty in , , and , indicated by the red error bars in Fig. 2. Given the significant second harmonic term and the simplicity of the analytic bar model, it is not surprising that it cannot provide a perfect fit to the data. Still, this generic bar model does reproduce the main features in the observed velocity field, as well as the overall behaviour of the first and third harmonic terms. This supports the case of a bar as the main driver behind the observed non-circular motions.
5 Results
The gas velocity field decomposition of section 3.2 provides the radial profiles for the primary disk parameters and the higher order harmonic terms. Assuming the inclination from the RC3 catalogue (de Vaucouleurs et al. 1991), we apply this method to our observed gas velocity field in an iterative manner by first varying the and PA. We then fix these parameter to their mean values and we proceed by deriving the and higher harmonic terms (see Fig. 2). We detect a varying zeroth harmonic term () with variation amplitude up to 40 in the central 10″. We find a strong PA twist of about in the central 10″, and outside this radius the PA goes back to the central values. The circular velocity component rises steeply and peaks at 5″ radius, followed by a very slow decline out to the outer radii. We find that the behaviour of the term could be compared with the or the PA: the term changes sign at around 12″, and at the same galactocentric radius, the and the PA change sign around their mean values. The exhibits amplitudes of order of . The bottom row in Fig. 2 shows that, apart from the term, the higher harmonic terms significantly deviate from zero, and indeed account for the considerable deviation of the velocity field of NGC 5448 from pure rotation.
In the following sections, we describe the distinct features that we find in our kinematic maps.
5.1 The Stellar Component
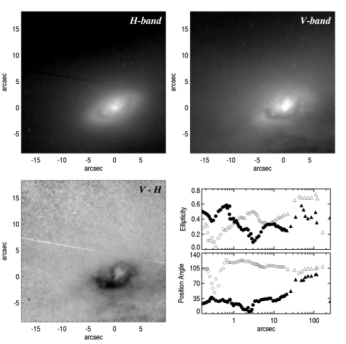
The SAURON flux map in Fig. 1 displays a smooth stellar distribution and the presence of prominent dust lanes to the south of the nucleus. The stellar kinematics shows a prominent regular disk-like rotation with a smaller inner stellar disk within the central 7″ radius. The stellar velocity dispersion decreases towards the centre, and at the location of the maximum line-of-sight velocities for the central structure, anti-correlates with which supports the argument that the central component of NGC 5448 is a central disk. We approximate the stellar velocity field with that of an exponential thin disk (Freeman 1970) to emphasize the kinematic signatures of the central disk. Fig. 3 shows this simple inclined disk model, where the inner stellar disk rotates faster than the outer disk. The best-fit model for the outer stellar disk, omitting the central 7″ and assuming an inclination fixed to the RC3 catalogue value, yields , a disk scale length , and a disk PA. Repeating the same exercise for the region inside 7″, we find that the central disk is misaligned with respect to the outer disk by .
5.2 Gas Distribution and Kinematics
Fig. 1 demonstrates that along the strong dust lanes, the gas shows a patchy distribution, with an asymmetric elongation of [O iii] gas towards the east as well as the galactic poles. The H distribution is found to be more regular, and we have found that all kinematic features of the [O iii] gas are accompanied by H emitting gas. The [O iii]/H map in Fig. 1 displays a prominent ring-like structure at 5″-15″, indicating high ionisation of the gas in this region.
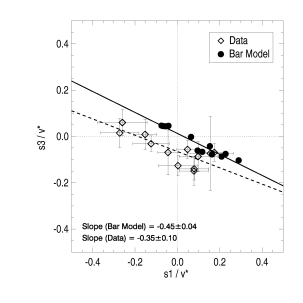
The gas velocity map clearly shows very prominent ‘S’-shaped zero-velocity curve with very sharp edges indicating very strong non-circular gas motions (Peterson & Huntley 1980). This ‘S’-shaped gaseous zero-velocity curve is confirmed by the PA variation derived by the tilted-ring decomposition in Fig. 2. Zero-velocity curve twists can be indicative of strong radial motions, created by, e.g., interactions, mergers or elliptical streaming due to a barred potential. Wong (2000) distinguished differences between radial motion mechanisms by comparing the versus harmonic terms, and found that the behaviour of versus is different between a bar model and a pure axisymmetric or warped model. As demonstrated in Wong et al. (2004; Fig. 5) the versus of a warped disk lie on a positive slope. Moreover in case of an externally triggered radial flow, the points in the versus graph should lie on a zero-slope. Setting up the same diagnostics, in Fig. 4, we find that for our data, the versus curve has a negative slope very similar to that of the bar model presented in Fig. 2. This confirms the signature of elliptical streaming in the gas velocity field of NGC 5448.
Comparing the stellar maps with the gas maps, we find that the gas velocities are considerably higher: This is confirmed with the rotation curve presented in Fig. 6. We find that the gaseous map displays some features comparable to the stellar map. Although the stellar velocity dispersion is more steeply rising toward the centre, both maps show a prominent dip in the centre. This supports the hypothesis of the presence of a central dynamically cold disk-like structure, present both in the stellar and gaseous component. Both maps also show a dispersion increase in bi-polar directions just a few arcseconds from the centre. This is much more prominent in the gas map, as its reaches values . This may be indicative of significant outflows in this AGN host.
5.3 Position Angle Values
The projected and deprojected PA profiles from Laine et al. (2002) in Fig. 5 display strong variations in the central few arcseconds. The HST images display asymmetrically distributed dust within the central few arcsecoonds, which may cause these strong central PA variations (also found by Kornreich et al. 2001). At larger radii, we find that the PA profile shows a variation of the order of , but overall it stays fairly constant around the nominal RC3 value, i.e. . Our tilted-ring decomposition of the gaseous velocity field, yields a mean gas kinematic PA of , which is consistent with the photometric PA from RC3. In the case of the large stellar disk, as described in section 5.1, we find an offset of between the stellar kinematic PA and the photometric mean PAs. This misalignment could be due to the effect of the bar on the observed stellar velocity field.
5.4 The Inner Few Arcseconds
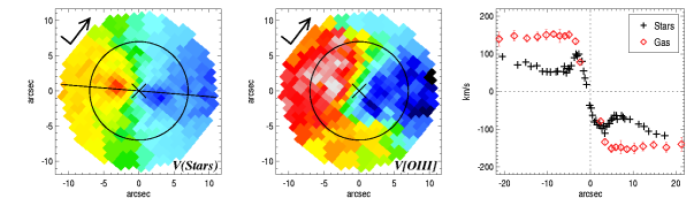
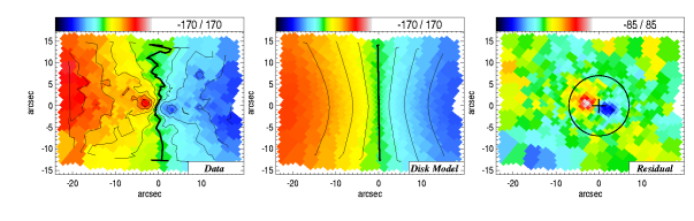
In Fig. 6 we zoom into the central few arcseconds of the stellar and the gaseous velocity fields of NGC 5448 to emphasize the observed kinematic differences between the two components. The gaseous component exhibits a strongly twisting zero-velocity curve, and the gas rotates faster than the stars. We find that the inner stellar disk not only is misaligned with the outer stellar disk, but also is shifted to the south-east. In contrast, we find from the photometric profiles in Fig. 5, that the ellipticity of the central disk is similar to that of the outer disk (), as well as their PAs. The prominent dust lanes at the south of this galaxy may explain the kinematic misalignment between the outer and inner stellar disks.
In the central the gas isovelocity contours are comparatively straight and parallel. In the same region, the stellar isovelocity contours are indicative of the presence of a central disk. The tilted-ring decomposition of the gas velocity field provides the gas rotation curve illustrated in Fig. 6. The gas rotates about 70 faster than the stars in the region outside , with some indication that outside this radius the negative velocities reach lower values than the positive line-of-sight velocities. This asymmetry could be caused by complex dust distribution or attributed to a signature of lopsidedness.
5.5 Dust Effects or Lopsidedness?
Although the unsharp-masked SAURON image shows strong signature of dust-lanes in the region south of the nucleus, the central dust distribution is easier to study when looking at the HST images and the colour map in Fig. 5. The colour map shows a strong dust lane about 1″ at the south-east of the galaxy nucleus as well as an asymmetrically distributed overall dust distribution. The larger scale WFPC2 image shows that this central dust lane is accompanied by several other dust lanes further away from the nucleus. Using the Galactic extinction law of Rieke & Lebofsky (1985), the HST images yield an average extinction value of over the central 3″, with a maximum value of 1.5. The extinction increases significantly towards the centre, with a prominent peak a few arcseconds south of the nucleus (see Fig. 5).
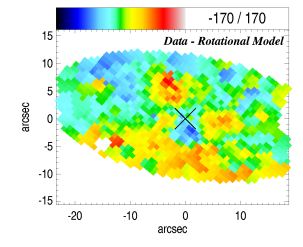
Some of the observational effects of the asymmetrical dust distribution could be interpreted as signatures of lopsidedness. Lopsidedness in galaxies has been investigated by e.g., Baldwin, Lynden-Bell & Sancisi (1980) and Swaters et al. (1999). The amplitude of this effect may depend on galactocentric radius, and viewed from different viewing angles will produce different signatures in the observed velocity field. These studies have shown that the residuals are dominated by the zeroth harmonic term for viewing angle of , and by the second harmonic term for viewing angle of . In the special case of radius-dependent lopsidedness . NGC 5448 has a large inclination, thus the zeroth term dominates, and we find no correlation between the and the terms. Our harmonic decomposition results display strongly varying zeroth and second terms. This was shown by SFdZ to be a poassible indication of an perturbation, i.e. lopsidedness (c.f., Fig 2. in SFdZ). In this case, subtracting the rotational component from the perturbed velocity field, one should find a ring-like feature. In Fig. 7, we present this residual field for NGC 5448 and find no ring-like feature. Therefore dust is most likely the cause for the asymmetric features that we observe in NGC 5448.
5.6 The Large-scale Bar
In Fig 2, we find that the harmonic parameters derived from the data are consistent with the bar model outlined in section 4. Our simple model is limited to an perturbation. Complicated flow patterns in bars studied by, e.g., Lindblad (1999), imply a significant contribution from and higher-order modes. The third harmonic terms are also influenced by , which could explain the differences between our model bar and the data for these parameters, but a detailed model is beyond the scope of this paper.
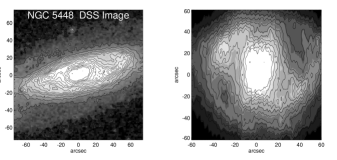
We now compare the modelled bar with the deprojected Digitised Sky Survey (DSS) image. The inclination from the RC3 and the PA from our tilted-ring model were used to deproject the DSS image in a simple way by assuming that the galaxy disk is thin. The outer spiral arms are clearly emphasized in the deprojected DSS image (Fig. 8).
It is somewhat difficult to identify the size of the large-scale bar from the image. From our bar model we find a CR of about . In practice, this is done by assuming that at CR the circular frequency of the axisymmetric potential is identical to bar angular frequency. According to this definition and since we use a flat rotation curve, the ILR is located at of the CR, i.e., at about . If we assume that the bar in NGC 5448 ends close to the starting point of the spiral arms (Sanders & Huntley 1976), we can also then associate its CR with the inner radius of the arms. Fig. 8 shows that our analytic bar model is of reasonable size. The assumed CR radius is confirmed by the ellipticity profile presented in Fig. 5, since the high ellipticity plateau starts at around this radius. At around the ILR (i.e., ), there is a good agreement between the profiles from the data and the model, with in both cases a change in sign at the ILR.
6 Discussion and Conclusions
We have used linear theory to construct a bar model ( mode) for NGC 5448. The best-fit model considers the effects of a single weak bar with a potential ellipticity and a damping amplitude of . We compare the harmonic terms of the model with those derived from the data and find an overall consistency (see Fig. 2). Using this model, we have been able to associate the radial motion of gas with that of the large-scale bar (see Fig. 4).
NGC 5448 exhibits clear signatures of the presence of other components than a single bar, which affect the observed velocity field. Inspecting the photometry and the central parts of the gaseous and stellar velocity field, we have detected a central rotating disk-like stellar component embedded in the larger disk (see Fig. 3). The WFPC2 image shows one very sharp dust lane 1″ from the centre of this galaxy. This image also shows three more fuzzy and almost parallel dust lanes further out in the south-east direction. The dusty centre is also apparent in the image in Fig. 5. Dust is inhomogeneously distributed and continues down to the very bright nucleus. Light from the central light source is absorbed by the dust asymmetrically and the centre appears to be located at the north-west of its actual position.
Investigating the projected and deprojected ellipticity profiles derived from the -band data from Laine et al. (2002) confirms the presence of a central disk in the inner 7″. Although the projected ellipticity profile decreases at and outwards, we cannot pin down the exact size of the central disk. The observed ellipticity decrease could be partly caused by the strongly asymmetric dust distribution. The stellar kinematic maps show that the central disk rotates faster than the main disk, and our observed gas distribution and kinematics indicate that this central disk also hosts gas which rotates faster than its stellar counterpart. This is not unexpected, since due to its disspative nature, the gas is not slowed down by asymmetric drift. It is important to note that, in NGC 5448, the gas velocities are well ordered but larger in magnitude than the stellar velocities. However, Fig. 6 indicates that this velocity difference dies out at larger radii. The difference between the stellar and gas velocities can be easily explained as due to the fact that the stars are in a thicker structure (bulge) in the central regions, while at larger radii both the gas and the stars are in a flatter disk, and both move closer to the circular velocity.
It is known that bars are efficient in transferring mass towards the inner regions of their host galaxies. The centrally concentrated matter may be able to form a central disk (Yuan & Yen 2004), or an inner bar (e.g., Maciejewski & Sparke 2000, Englmaier & Shlosman 2004). Our analysis has shown that the non-circular gas kinematics in NGC 5448 could be driven by the large-scale bar. The central disk could then have been formed as a result of the gas accumulation at the centre.
To conclude, we have been able to analytically model the bar signatures in the AGN host NGC 5448. We have unveiled a central disk, and have distinguished the effects of a lopsided perturbation from strong dust features. NGC 5448 hosts considerable amounts of dust which is asymmetrically distributed all the way to the centre, resembling the “Evil Eye” galaxy (Braun, Walterbos & Kennicutt 1992). This study shows the power of the harmonic decomposition formalism to quantify non-circular motions in observed velocity fields, and we plan to apply this approach to the full set of bulges observed with SAURON.
Acknowledgements
It is a pleasure to acknowledge the entire SAURON team for their efforts in carrying out the observations and data preparation, for lively interactions and many fruitful discussions. The SAURON project is made possible through grants 614.13.003 and 781.74.203 from ASTRON/NWO and financial contributions from the Institut National des Sciences de l’Univers, the Université Claude Bernard Lyon I, the universities of Durham and Leiden, the British Council, PPARC grant ‘Extragalactic Astronomy & Cosmology at Durham 1998–2002’, and the Netherlands Research School for Astronomy NOVA. Jesús Falcón-Barroso acknowledges support from the Euro3D Research Training Network. Kambiz Fathi acknowledges support for Proposal number HST-GO 09782.01 provided by NASA through a grant from the STScI, which is operated by the Association of Universities for Research in Astronomy, Incorporated, under NASA contract NAS5-26555. Kambiz Fathi is also grateful to Isaac Shlosman for stimulating and insightful discussions. Finally, we thank the referee for constructive comments which improved the manuscript.
References
- Adam et al. (1989) Adam, G., Bacon, R., Courtes, G., Georgelin, Y., Monnet, G., Pecontal, E. 1989, A&A L, 208, 15
- Afanasiev et al. (1990) Afanasiev, V.L., Dodonov, S.N., Sil’chenko, O.K., Vlasyuk, V.V. 1990, SAO preprint, N54
- Athanassoula (1994) Athanassoula, E. 1994, in Mass-Transfer Induced Activity in Galaxies, p.143, Editor: I. Shlosman, Cambridge University Press
- Bacon et al. (1995) Bacon, R. et al. 1995, A&AS, 113, 347
- Bacon et al. (2001) Bacon, R. et al. 2001, MNRAS, 326, 23
- Baldwin et al. (1980) Baldwin, J. E., Lynden-Bell, D., Sancisi, R. 1980, MNRAS, 193, 313
- Begeman (1987) Begeman, K. G. 1987, PhD Thesis, University of Groningen
- Bershady et al. (2004) Bershady, M. A., Andersen, D. R., Harker, J., Ramsey, L. W., Verheijen, M. A. W. 2004, PASP, 116, 565
- Braun et al. (1992) Braun, R., Walterbos, R. A. M., Kennicutt, R. C., Jr. 1992, Nature, 360, 442
- Burlak et al. (2000) Burlak, A. N., Zasov, A. V., Fridman, A. M., Khoruzhi, O. V. 2000, AstL, 26, 809
- Canzian (1993) Canzian, B., 1993, ApJ, 414.617
- Cappellari & Copin (2003) Cappellari, M., Copin, Y. 2003, MNRAS, 342, 345
- Cappellari & Emsellem (2004) Cappellari, M., Emsellem, E. 2004, PASP, 116, 138
- Carollo et al. (2002) Carollo, C. M., Stiavelli, M., Seigar, M., de Zeeuw, P. T., Dejonghe, H. 2002, AJ, 123, 159
- Combes & Gerin (1985) Combes, F., Gerin, M. 1985, A&A, 150, 327
- Davies et al. (1997) Davies, R. L. et al. 1997, SPIE, 2871, 1099
- de Vaucouleurs et al. (1991) de Vaucouleurs, G., de Vaucouleurs, A., Corwin, H. G., Buta, R. J., Paturel, G., Fouque, P. 1991: Third Reference Catalogue of Bright Galaxies, Springer-Verlag, New York
- Paper II (2002) de Zeeuw, P. T. et al. 2002, MNRAS, 329, 513
- Emsellem et al. (2003) Emsellem, E., Goudfrooij, P., Ferruit, P. 2003. MNRAS, 345, 1297
- Emsellem et al. (2004) Emsellem, E. et al. 2004, MNRAS, 352, 721
- Emsellem et al. (2005) Emsellem, E. et al. 2005, MNRAS, submitted
- Eskridge et al. (2002) Eskridge, P. B. 2002, ApJS, 143, 73
- Englmaier & Shlosman (2004) Englmaier, P., Shlosman, I. 2004, ApJ, 617, 105
- Falcón-Barroso et al. (2005) Falcón-Barroso, J. et al. 2005, MNRAS, submitted
- Fathi & Peletier (2003) Fathi, K., Peletier, R. F. 2003, A&A, 407, 61
- Fathi (2004) Fathi, K. 2004, PhD Thesis, University of Groningen
- Freeman (1965) Freeman, K. C. 1965, MNRAS, 130, 183
- Freeman (1970) Freeman, K. C. 1970, ApJ, 160, 811
- Fridman & Khoruzhii (2003) Fridman, A. M., Khoruzhii, O. V. 2003, SSRv, 105, 1
- García-Lorenzo et al. (2000) García-Lorenzo, B., Arribas, S., Mediavilla, E. 2000 ,INGN, 3, 25
- Ho et al. (1995) Ho, L. C., Filippenko, A. V., Sargent, W. L. 1995, ApJS, 98, 477
- Jones (1997) Jones, L. A. 1997, PhD Thesis, University of North Carolina, Chapel Hill
- Knapen et al. (2000) Knapen, J. H., Shlosman, I., Heller, C. H., Rand, R. J., Beckman, J. E., Rozas, M. 2000, ApJ, 528, 219
- Kornreich et al. (2001) Kornreich, D. A., Haynes, M. P., Jore, K. P., Lovelace, R. V. E. 2001, AJ, 121, 1358
- Krajnovic et al. (2005) Krajnović, D. et al. 2005, MNRAS, submitted
- Kuijken & Tremains (1994) Kuijken, K., Tremaine, S. 1994, ApJ, 421, 178
- Laine et al. (2002) Laine, S., Shlosman, I., Knapen, J. H., Peletier, R. F. 2002, ApJ, 567, 97
- Lin & Shu (1964) Lin, C. C., Shu, F. H. 1964, ApJ, 140, 646
- Lindblad & Lindblad (1994) Lindblad, P. O., Lindblad, P. A. B. 1994, in Physics of the Gaseous and Stellar Disks of the Galaxy, ASP Conf. Ser. 66, Editor: I.R. King
- Lindblad (1999) Lindblad, P. O. 1999, A&ARv, 9, 221
- Maciejewski & Sparke (2000) Maciejewski, W., Sparke, L. S. 2000, MNRAS, 313, 745
- Martinet & Friedli (1997) Martinet, L., Friedli, D. 1997, A&A, 323, 363
- Moiseev (2000) Moiseev, A. V. 2000, A&A, 363, 843
- Moiseev (2000) Mosteller, F., Tukey, J. 1977, Data Analysis and Regression, Addison-Wesley
- Ohtani (1995) Ohtani, H. 1995, in Tridimensional Optical Spectroscopic Methods in Astrophysics, ASP Conf. Ser., 71, p.149, Editors: G. Comte, M. Marcelin
- Peterson & Huntley (1980) Peterson, C. J., Huntley, J. M. 1980, ApJ, 242, 913
- Plana & Boulesteix (1996) Plana, H., Boulesteix, J. 1996, IAUS, 171, 432
- Regan & Teuben (2004) Regan, M. W., Teuben, P. J. 2004, ApJ, 600, 595
- Rogstad et al. (1974) Rogstad, D. H., Lockart, I. A., Wright, M. C. H. 1974, ApJ, 193, 309
- Rogstad et al. (1974) Rogstad, D. H., Wright, M. C. H., Lockart, I. A. 1976, ApJ, 204, 703
- Roth et al. (2000) Roth, M. M., Laux, U., Heilemann, W. 2000, SPIE, 4008, 485
- Sakamoto et al. (2000) Sakamoto, K. Baker, A. J., Scoville, N. Z. 2000, ApJ, 533, 149
- Sakhibov & Smirnov (1989) Sakhibov, F. K., Smirnov, M. A. 1989, AZh, 66, 921
- Sandage & Bedke (1994) Sandage, A., Bedke, J. 1994, “The Carnegie atlas of galaxies”, Washington, DC: Carnegie Institute of Washington
- Sanders & Huntley (1976) Sanders, R. H., Huntley, J. M. 1976, ApJ, 209, 53
- Sarzi et al. (2005) Sarzi, M. et al. 2005, MNRAS, submitted
- SFdZ (1997) Schoenmakers, R. H. M., Franx, M., de Zeeuw, P. T. 1997, MNRAS, 292, 349 (SFdZ)
- Schoenmakers (1999) Schoenmakers, R. H. M. 1999, PhD Thesis, University of Groningen
- Shlosman et al. (1989) Shlosman, I., Frank, J., Begelman, M. 1989, Nature, 338, 45
- Shlosman & Noguchi (1993) Shlosman, I., Noguchi, M. 1993, ApJ, 414, 474
- Shlosman (1999) Shlosman, I. 1999, in The Evolution of Galaxies on Cosmological Timescales, ASP Conf. Ser. 187, p.100, Editors: J. E. Beckman, T. J. Mahoney
- Simkin et al. (1980) Simkin, S. M., Su, H. J., Schwarz, M. P. 1980, ApJ, 237, 404
- Statler (1994) Statler, T. 1994, ApJ, 425, 500
- Swaters et al. (1999) Swaters, R. A., Schoenmakers, R. H. M., Sancisi, R., van Albada, T. S. 1999, MNRAS, 304, 330
- Thielheim & Wolff (1982) Thielheim, K. O., Wolff, H. 1982, MNRAS, 199, 151
- van der Hulst et al. (1992) van der Hulst, J. M., Terlouw, J. P., Begeman, K. G., Zwitser, W., Roelfsema, P. R. 1992, in Astronomical Data Analysis Software and Systems I, ASP Conf. Ser. 25, p.131, Editors: D. M. Worrall, C. Biemesderfer, J. Barnes
- van der Kruit & Allen (1978) van der Kruit, P. C., Allen, R. J. 1978, ARA&A, 16, 103
- van Gorkom et al. (1986) van Gorkom, J. H., Knapp, G. R., Raimond, E., Faber, S. M., Gallagher, J. S. 1986, AJ, 91, 791
- Vazdekis (1999) Vazdekis, A. 1999, ApJ, 513, 224
- Wada (1994) Wada, K. 1994, PASJ, 46, 165
- Warner et al. (1973) Warner, P. J., Wright, M. C. H., Baldwin, J. E. 1973, MNRAS, 163, 163
- Wong (2000) Wong, T. 2000, PhD Thesis, University of California, Berkeley
- Wong et al. (2004) Wong, T., Blitz, L., Bosma, A. 2004, ApJ, 605, 183
- Wong et al. (2004) Yuan, C., Yen, D. C. C. 2004, in Penetrating Bars Through Masks of Cosmic Dust - , A&S Sci. Lib. vol. 319, Editors: D. Block, I. Puerari, K. C. Freeman, R. Groess, E. K. Block