Research on candidates for non-cosmological redshifts
Abstract
The paradox of apparent optical associations of galaxies with very different redshifts, the so-called anomalous redshift problem, is around 35 years old, but is still without a clear solution and is surprisingly ignored by most of the astronomical community. Statistical correlations among the positions of these galaxies have been pointed out by several authors. Gravitational lensing by dark matter has been proposed as the cause of these correlations, although this seems to be insufficient to explain them and does not work at all for correlations with the brightest and nearest galaxies. Some of these cases may be just fortuitous associations in which background objects are close in the sky to a foreground galaxy, although the statistical mean correlations remain to be explained and some lone objects have very small probabilities of being a projection of background objects.
The sample of discordant redshift associations given in Arp’s atlas is indeed quite large, and most of the objects remain to be analysed thoroughly. For about 5 years, we have been running a project to observe some of these cases in detail, and some new anomalies have been added to those already known; For instance, in some exotic configurations such as NGC 7603 or NEQ3, which can even show bridges connecting four object with very different redshifts, and the probability for this to be a projection of background sources is very low. Not only QSOs but also emission-line galaxies in general are found to take part in this kind of event. Other cases are analyzed: MCG 7-25-46, GC 0248+430, B2 1637+29, VV172 and Stephan’s Quintet and, in some of them, it is probable that the associations stem from a background projection, although some other low probability features are present in some of these systems which remain to be understood.
Keywords:
Distances, redshifts, radial velocities; Quasars; Starburst galaxies; Gravitational lenses:
98.62.Py, 98.54.Aj, 98.54.Ep, 98.62.Sb1 The problem and the observations which give rise to it
The problem of apparent optical associations of galaxies with very different redshifts, the so-called anomalous redshiftsArp87 ; Nar89 ; Arp03 , is old but still alive. Although surprisingly ignored by most of the astronomical community, over the last 35-40 years the amount of evidence in favour of it has been steadily increasing, both in the study of individual cases and statisticallyChu84 ; Bur96 ; Bur01 : an excess of high redshift sources near low redshift galaxies, positive and very significant cross correlations between surveys of galaxies and QSOs, an excess of pairs of QSOs with very different redshifts, etc. These observations and analysis suggest that there may be some objects whose redshift is not due to the cosmological expansion supposed by the Big Bang model, but that the redshift is intrinsic to the object (anomalous). This motivated us to begin our own independent observations and analyses. In this paper we will pay attention to the study of a few examples of anomalous redshift candidates, particularly objects we have recently studied.
1.1 Phenomenology
Among the facts suggesting that there is something anomalous with some systems of objects, something which suggests that they are associated rather than being a fortuitous projection of objects with different distances, are:
-
•
There is an excess of galaxies or QSOs with high redshifts near the centre of nearby galaxies. In some cases, the QSOs are only a few arcseconds away from the centre of the galaxies. This is observed in the aforementioned cross-correlations of surveys but also in some individual cases. Examples considered here are NEQ3, which has a QSO/HII galaxy pair with redshift 0.19 and another HII galaxy only 2.6′′ from it with , the VV 172 chain and Stephan’s Quintet with a closer discordant object. Other cases in the literature include NGC 613, NGC 3079, NGC 3842, NGC 7319 (in Stephan’s Quintet, with a QSO 8′′ distant from the centre), 2237+0305 (with a QSO less than 0.3′′ from the centre), etc.
-
•
Filaments/bridges/arms apparently connecting objects with different redshifts. This is the case, for instance, of NGC 7603, NEQ3, MCG 7-25-46 which will be described below. In these cases, the origin of such filaments should be related to the interaction of different galaxies, and only galaxies with different redshift appear to be appropriate candidates for such interactions. Moreover, the probability of chance projections of background/foreground objects on to the filament, as observed in some cases, is very low. Other cases in the literature include AM 2052-221, NGC 4319+Mrk 205, Mrk273, NGC 3067+3C232 (in radio), NGC 622, NGC 1232, NGC 4151, etc.
-
•
Distance indicators which suggest that some galaxies or QSOs are much closer than indicated by their redshifts. An example discussed in this paper is NGC 7603: the spectra of two HII galaxies with high redshifts is typical of dwarf HII galaxies, whose luminosity points to possibly much lower distances than indicated by their redshift. Other cases in the literature are the anomalously large sizes of NGC 262 or NGC 309 if their redshifts are taken as distance indicators.
-
•
The alignment of sources with different redshifts, which suggest that they have a common origin, and that the direction of alignment is the direction of ejection, as proposed by theories claiming that the redshifts are intrinsic rather than cosmological. This happens with some configurations of QSOs. Examples are shown here with GC 0248+430, B2 1637+29. Other cases in the literature include: 1130+106, 3C212, NGC 4258, NGC 2639, NGC 4235, NGC 5985, etc.
-
•
No absorption lines in QSOs that are supposed to be located behind foreground galaxies. We have not observed any of these targets, but there are several in the literature, e.g. PKS 0454+036.
-
•
Morphological evidence of interaction such as star-forming regions, distorted shapes, asymmetries in rotation curves, etc. We have paid no attention to this kind of evidence—perhaps some distortions in NEQ3—but there are several cases in the literature, e.g. NGC 450+UGC 807.
In the following sections, we illustrate some of those cases presenting apparent anomalies observed by us over the last 5 years. This is a small sample among the vast literature on the topic that has accumulated during the last 35-40 yearsArp87 ; Nar89 ; Bur96 ; Arp03 , especially by H. C. Arp, M. Burbidge, G. Burbidge, J. Sulentic and others. A surprising fact regarding our observations is that we have observed only about a dozen systems111The reason is mainly because we obtained only a few nights of observing time on 2–4 m telescopes. Most of the observations were done in 2001–2. In subsequent applications, no time was obtained in spite of our having published several papers in major astronomical journals on the topic and demonstrated the utility of our observations within this field of anomalous redshifts., that were known to present some apparent anomaly, and nearly in half of them we have found some new apparent anomaly. Were we just lucky, or is it that these old and new apparent anomalies reflect the existence of genuinely non-cosmological redshifts?
2 NGC 7603
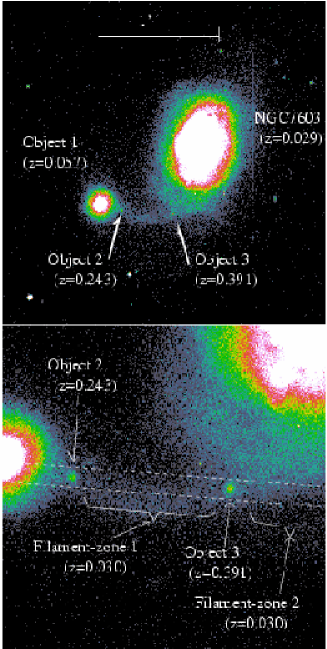
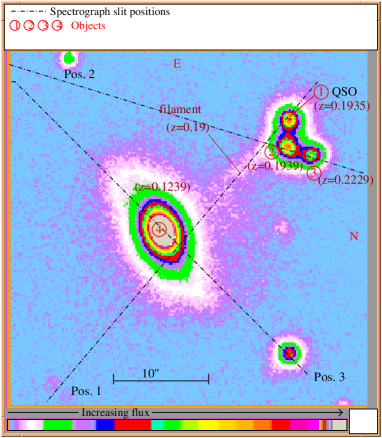
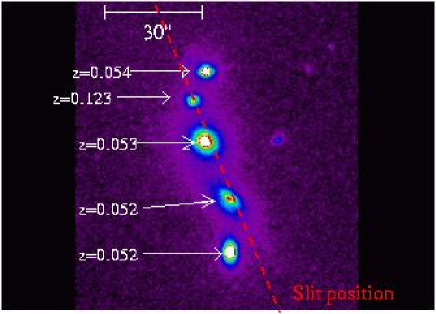
Fig. 1 shows an example of a system suggesting an anomalous redshift. The main galaxy, NGC 7603, is a broad line Seyfert I galaxy with and = 14.04 mag Vau91 . This galaxy has been studied mainly in relation to its variabilityKol00 . The Balmer lines are unusually broad, show a very complex structure and are blueshifted relative to the local ‘rest frame’ of the AGN by between 1000 and 2000 km/s. Less than 5% of AGN show such characteristics. Such lines are more common in radio-loud quasars, where one sees ejected synchrotron lobes. It also shows unusually strong Fe II emission for an AGN with such broad lines Goo89 ; Kol00 .
A fact that has attracted attention is the proximity of NGC 7603B, a spiral galaxy with higher redshift () located 59 arcseconds to the SE of NGC 7603 Arp71 ; Arp75 ; Sha86 . The angular proximity of both galaxies and the apparently luminous connection between them makes the system an important example of a possible anomalous redshift association. Arp Arp71 ; Arp75 ; Arp80 has claimed that the compact member, NGC 7603B, was somehow ejected from the bigger object.
Moreover, there are also two objects overimposed on the filament apparently connecting both galaxies. We identified several emission lines in the spectra of the two knots, and from the emission lines of H, H, OII, doublet OIII, NII-6584 Å we determined their redshifts to be 0.394 and 0.245 for the objects closest to and farthest from NGC 7603 respectivelyLop02 ; Lop04 . B-magnitudes corrected for extinction (due to the filament) are respectively 21.1 and 22.1 Lop04 . According to the line ratios, these objects are HII-galaxies but are quite peculiar: the very intense Hα [equivalent width: EW(H80 Å and 160Å resp.] is indicative of a vigorous star-formation galaxy. Only % and % resp. of the normal HII-galaxies have a so high EW(Hα) Car01 . However, if they were dwarf HII-galaxies, these high EWs would be within the normally expected values. If we consider the redshifts as indicators of distance, the respective absolute magnitudes would beLop04 : and . However, if we consider an anomalous intrinsic redshift case (in such a case, in order to derive the distance, we set ), the results are: and resp.Lop04 . In this second case, they would be on the faint tail of the HII-galaxies, type II Tel95 ; they would be dwarf galaxies, “tidal dwarfs”, and this would explain the observed strong star formation ratio: objects with low luminosity have higher EW(Hα)Car01 . Of course, this would imply that we have non-cosmological redshifts.
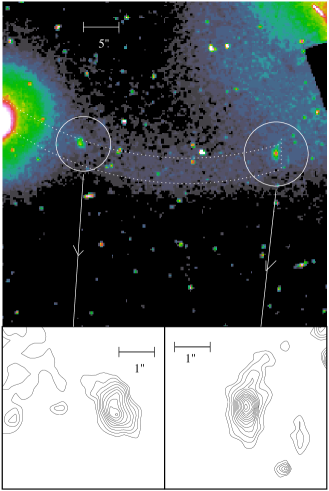
Figure 2 shows the field from the Hubble Space TelescopeLop04 . The field is centred on the filament between NGC 7603 and NGC 7603B and clearly shows the two objects within it. The FWHM of both objects is between 0.3 and 0.4 arcseconds, which is very small to be measured with a ground telescope and 1 arcsecond seeing, and seems to indicate that they are extended rather than point-like objects. The two HII-galaxies in the filament are apparently a little deformed, although the significance is not too high (the two lowest isocontours in Fig. 2 are and respectively above the average flux in the region). The tail of the object close to NGC 7603 in the northern part is warped towards NGC 7603, and the other object has a faint apparent tail in the northern part but this tail is less significant. It could indicate that the material in the filament interacts with the galaxies.
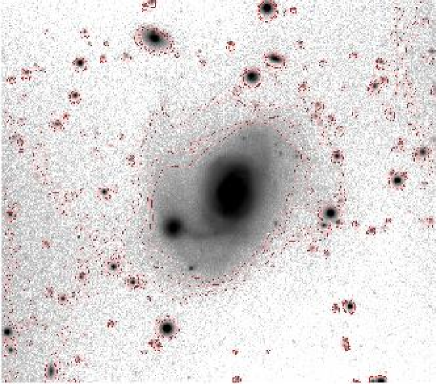
The NGC 7603-NGC 7603B system appears to be surrounded by a diffuse halo that we have been able to delineate down to 26.2 mag/arcsec2 in the r-band Sloan filter (Fig. 3). Although this halo seems to be associated mostly with NGC 7603, it is not symmetric with respect to this galaxy. There is evidence of a fainter extension tail to the north. The last isophote of the halo is also asymmetric to the west, possibly including a counter arm of the bright filament between NGC 7603 and NGC 7603B. The halo+filament between NGC 7603 and NGC 7603B shows up clearly and has a maximum brightness of 22.9 mag/arcsec2 in the Sloan r-band, while the halo near the filament has a brightness of 23.4 mag/arcsec2. Therefore, the filament alone is approximately 24.0 mag/arcsec2. Another diffuse structure is seen also apparently connecting NGC 7603 and NGC 7603B, and situated to the south of the main filament. A point-like object situated to the southeast of this tail is a local starLop04 .
From several absorption lines we estimated the redshift of the filament apparently connecting NGC 7603 and NGC 7603B as Lop02 , very similar to the redshift of NGC 7603 and probably associated with this galaxy. There is an absence of Hα emission lines in NGC 7603B and in the filamentSha86 ; Lop04 . The non-detection of emission lines is not proof against the existence of a physical connection. In interactions and ejections with a larger galaxy, the gas is often stripped away from a stellar systemRos01 , so the lack of emission lines could be taken as an indication of interaction rather than non-interaction (against what is pointed out by Sha86 ). Fig. 3 shows that NGC 7603 and its filament are apparently distorted by significant tidal interaction. The existence of the filament itself is also a possible sign of tidal interaction or debris from satellite disruptionJoh01 . The fainter southern filament and the red fringe embedded in NGC 7603 reinforces the tidal debris scenario. But where is the companion that interacts with NGC 7603? There is a galaxy with similar redshift, one magnitude fainter, and 10.3 arcminutes from NGC 7603: NGC 7589; or B231533.01-000313.1, three magnitudes fainter and 12.6 arcminutes of distance. However, all of them are in the opposite direction to the filament (in the west instead of the east). There are two closer galaxies 2–3 arcminutes to the north (SDSS J231901.1+001651.8 and SDSS J231855.52+001619) which are 4–5 magnitudes fainter but they both have a redshift of (measured by the Sloan Digital Sky Survey). We do not find any appropriate candidate for the interaction in the field down to the limiting magnitude for spectroscopy in SDSS survey: either they are very far and in the opposite direction or they have very different redshifts. Maybe this lost companion is very faint, but then it would have too low a mass or too high a distance to produce a 24 mag/arcsec2 filament. Johnston et al.Joh01 in their eq. (11)/fig. 6 calculate the expected surface brightness magnitude in such cases. Assuming Gyr a mass-to-light ratio of 10, rotation velocity from NGC 7603 of 200 km/s in the outer disc, and a distance to the satellite of 40 kpc (equivalent to an angular distance of 1 arcminute), we would need a galaxy with B. Where is this galaxy? Unless we suppose that NGC 7603B is this galaxy, things are not easy to explain; and, of course, it would imply that we have an anomalous redshift.
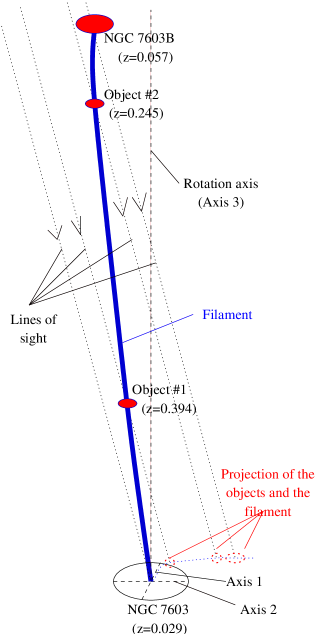
Therefore, some facts, although not conclusive, seem to suggest that there is an interaction between the four galaxies of different redshift: the existence of the filament itself, the strong Hα emission apparently observed in the HII galaxies typical of dwarf galaxies, and the low probability of having three background sources projected on to the filament (see below for a discussion of probabilities). As a speculative hypothesis, we might think that the three galaxies were ejected by NGC 7603. There is no unique representation of the system in terms of this model of ejection. We do not have enough information about the distances of the sources with respect to the parent galaxy to build a unique 3-D representation. For instance, Fig. 4 represents a possible configuration according to the ejection theory. The inclination of the galaxy is around 20 deg with respect the line-of-sight (ellipticity ), so slight deviations of the objects from the rotation axis could produce the projected image that we have observed. Fig. 4 represents a model in which the filament is not in the plane of the galaxy, but is ejected in a direction nearly perpendicular to the plane.
3 NEQ3
The NEQ3 system (see Fig. 5) comprises three compact-like objects with relative separations of 2.6 and 2.8 arcsec with respect to the central object, all of them lying along the minor axis of an apparent lenticular galaxy at arcsecs. A filament is situated along the optical line connecting the main galaxy and the three compact objects. Although a rather intriguing system, surprisingly the only study of it before our paperGut04 was published 27 years ago by ArpArp77 , who measured the redshift of the main galaxy as 0.12, and two of the compact objects as 0.19; Arp claimed it to be an interesting case of anomalous redshift. Apparently, little interest was generated concerning this problem since the system was forgotten for such a long time.
We have obtained Gut04 a better image of the filament (previously noted by Arp) along the line of the minor axis of object 4 (see Fig. 5). It also seems that the filament decreases its brightness from object 1–2 to object 4. Object 4 looks fairly symmetric with the morphology typical of a lenticular (S0/Sa) galaxy, and its spectrum presents only absorption lines characteristic of an old population. The only signs of distortion are the filament in the direction towards objects 1–3, and an extended emission to the north which seems to enclose a weak object (-Sloan=21.8 mag) situated at arcsec. The magnitudes in the Sloan band for objects 1–3 are 19.8, 19.6, 20.2, 17.3 for object 4 (without extinction correction). The spectra of objects 1, 2 and 3 are dominated by emission lines whose identification allows the unambiguous determination of their redshiftsGut04 : the main features are the lines of the hydrogen Balmer series, and the lines of OII and OIII. Other minor features like SII and and NII are also detected. The position of all these lines is consistent to within the uncertainty of our spectral resolution. The resulting redshifts are , , (a new discordant redshift galaxy), and for objects 1, 2, 3 and 4 respectively. Object 1 has a typical broad line spectrum, while objects 2 and 3 have only narrow emission lines. According to their line ratios, we have classified object 1 as a QSO/Seyfert 1 galaxy, and objects 2 and 3 as HII galaxies. The equivalent Hα equivalent widths of objects 2 and 3 are also relatively high, 66 and 52 Å respectively, but not as much as in the knots of the filament of NGC 7603. The spectrum of the filament is very noisy and has no obvious features. However, we tentatively identify a maximum in the cross-correlation function with a template spectrum that corresponds approximately to a redshift of 0.19. A secondary maximum also appears at .
Therefore, again, as in NGC 7603, we have seen that the system is even more anomalous than previously thought: we now have three different redshifts instead of two. Also as in NGC 7603, the origin of the filament is a mystery; it is supposed to be due to the interaction of the pair 1,2 with some other galaxy to the south-west. Where is this object? It seems that object 4 is the galaxy concerned, and this would imply anomalous redshift. It is also possible that the interaction between objects 1 and 2 might produce the filament, and it would be a coincidence that it pointed towards object 4. The association of objects 1 and 2 is also particularly interesting since they constitute one of the few known galaxy/QSO pairs with a very small angular separation (2.6 arcseconds), the galaxy is undergoing an intense burst of star formation, and there is a diffuse filament possibly associated with the pair. All of this evidence seems to be an indication of a strong interaction between the QSO and the HII galaxy, objects with more or less the same luminosity. In a conventional scenario the role of objects 3 and 4 is unclear. For instance could the difference in redshift between objects 1 and 2, and object 3 () be produced by a difference in peculiar velocity? The difference would be 9,000 km s-1. As far as we know, interactions between galaxies with such a large difference have not been observed and would be difficult to explain within the framework of models of galaxy formation. Finally, how to interpret in a conventional scenario the presence of several asymmetries of the main galaxy, and a filament pointing outwards in the direction of the line connecting three compact objects with the centre of object 4?
4 GC 0248+430 and B2 1637+29
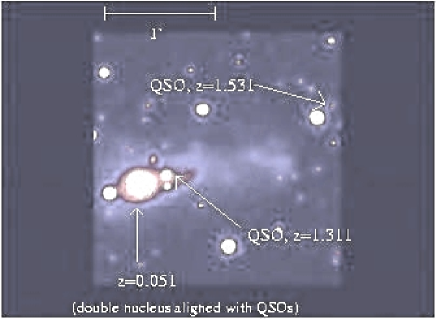
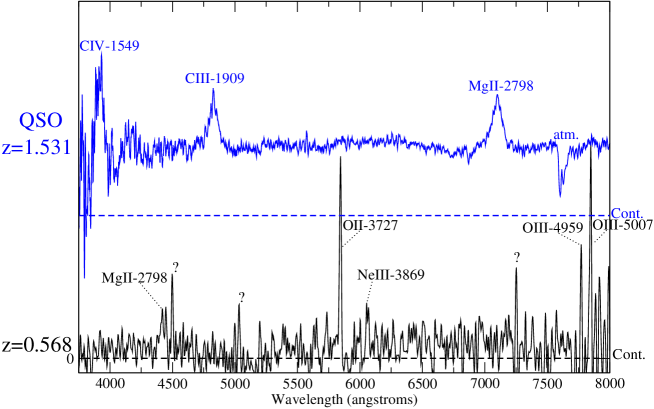
Fig. 6 shows the double nucleus galaxy GC 0248+430 and the field surrounding it. The first quasar with , was studied previouslyWom90 ; Bor91 ; Hoy96 (our photometry gave for observation on 2002 December 3; the difference is possibly due to variability), and the remarkable coincidence was that the double nucleus of the galaxy and the QSO lie along a line. Moreover, the gas extends in the direction of this QSO and beyond it, and the galaxy is disturbed, due presumably to some interaction. The new discovery to add to all this was the presence of a second QSO with redshift , , (see Fig. 6). The discovery was made by means of a systematic search for excess-UV sources with Sloan u’g’r’ photometry on the NOT and spectroscopy with the WHT to confirm the candidates (method to detect QSOs explained in subsection 3.2 of Lop04 ). This object had been previously classified as a star from a photometric survey Kir94 but is undoubtedly a QSO according to the spectra with broad lines of CIV, CIII and MgII (see Fig. 7). The position angle of the first QSO with respect to the major nucleus of the galaxy is -73∘ at a distance of 14.4” from the major nucleus; and the position angle of the second QSO is -68∘ at a distance of 108′′ from the major nucleus. The position angle of the line which joins the two nuclei of the galaxy is -77 (the error bar is large because both nuclei are very close—2.7′′—and it was not possible to determine the position of the second centre accurately). Even if we forget the second nucleus and the gas ejection, all in this directionHoy96 , given the low density of expected background quasars, the coincidence of the near-alignment (the difference is 5 degrees) seems unlikely.
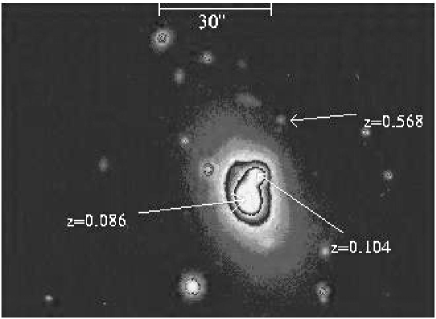
Fig. 8 shows the system B2 1637+29, either a galaxy with two nuclei separated by 4100 km/sRui98 or two separate galaxies, and the field surrounding it. We have serendipitously discovered another galaxy with , , , (SDSS). We detected the emission lines of OII, NeIII, OIII, and MgII (broad?, it is not clear; the classification as QSO/Seyfert 1 is not discarded although, in principle, we simply claim that it is an emission line galaxy; from the images it looks like an extended object); see Fig. 7. There is a fainter object which connects the isophote of this object with those of B2 1637+39, but it was too faint to derive its redshift. The position angle of the line which joins the two nuclei of the galaxy is -22.0∘ and the separation is 6.6′′. The position angle of the second galaxy with respect to the major nucleus of the galaxy is -22.6∘ at a distance of 22.4′′ from the major nucleus, so there is a difference of only 0.6 degrees (from SDSS astrometry, the number increases to 1.1 degrees). Indeed, the detection of this new object was totally fortuitous: we placed the slit to take the spectra of both objects separated by 4100 km/s and by chance we took the spectrum of this object.
5 VV172
VV172 is a well known case of anomalous redshift in one of the members of a Hickson Group. As shown in Fig. 9, it consists of a chain of 5 galaxies in which one has a discordant redshift (UGC 6514 E with instead of for the other galaxies). The object with the discordant redshift is an emission line galaxy, either an HII galaxy or a LINER, according to our spectrum (why is it that most of the galaxies in scenarios of discordant redshift are emission-line galaxies?); it is also very blue ( Sul83 , plus 0.42 for the K-correction). It is either a blue compact or a spiral, perhaps a spiral because some structure was observed in their images. It has been analysed previously and was a matter of discussion during the ’70s and early ’80s; later on it was apparently forgotten. The extent and the smoothness of its enveloping halo, especially in the vicinity of the discordant galaxy, was the strongest direct evidence for interactionSul83 . The halo could not be explained by the simple overlapping of four or five normal galaxy envelopes, suggesting that a significant part of the halo is composed of stars governed by the overall gravitational potential of the groupSul83 .
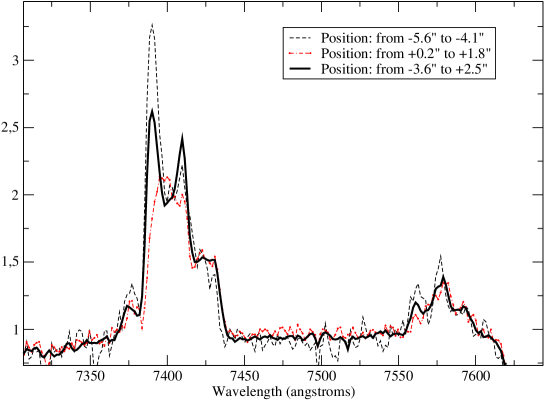
Our research on this system was not very intensive, and further observations and analysis will be necessary. We took several spectra in the region, among others the slit position marked in Fig. 9. The spectra in the intergalaxy halo did not reveal any redshift (there were no emission lines, and the possible absorption lines were too faint to be detected). However, we realized from the spectrum of the discordant redshift galaxy that it is a peculiar object. In Fig. 10 we see that the wavelengths corresponding to Hα+NII-doublet have four lines (left, around 7400 Å ), and the range of the SII-doublet (right, around 7575 Å ) has three lines. There are too many lines. We could also see Hβ asymmetrically broadened towards redder wavelengths; OII and OIII did not present significant broadening. All this information indicates that the lines are duplicated (we do not see all of them because there is superposition of the two sets of lines) and we have two components with a difference of velocity of km/s in the same galaxy, possibly a high velocity outflow: the main galaxy is ejecting some material, which is precisely what we are observing with an excess of km/s. This would indicate that ejection of matter is taking place in this galaxy. A curiosity perhaps, but this adds a further anomaly to the previously known one. Outflows are not very unusual, but outflows of 700 km/s are quite rare (only one galaxy of a sample of 75 starburst-driven superwinds has a velocity higher than 700 Km/sVei04 ).
6 MCG 7-25-46 and Stephan’s Quintet
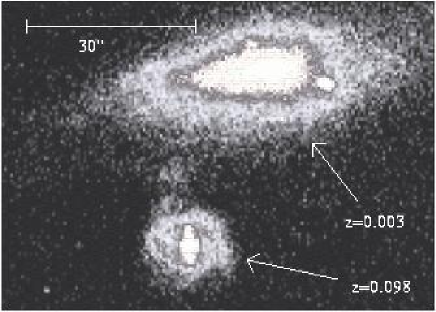
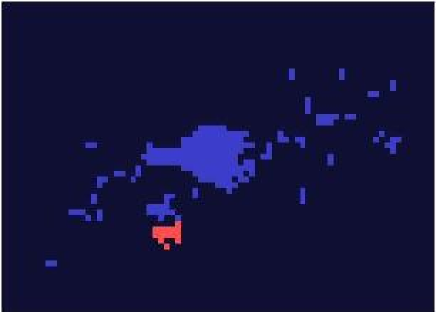
MCG 7-25-46 (or UGC 7175) (Fig. 11) was also analysed by Arp Arp77 : a system with two galaxies connected by a bridge and with different redshift: for the main galaxy and for the small one. From our analysis, it is relevant that the bridge has the same redshift as the main galaxy (see Fig. 12). This had already been observed by Sul85 , but they took a single slit spectrum, and we could produce a 2D map of the Hα emission. Sul85 also observed perturbation, due possibly to interaction, in the higher redshift object. As in NGC 7603, one could ask why MCG 7-25-46 ejects a filament/bridge in the direction of the discordant redshift companion and not in other directions. There is the further interesting observation that the Hα emission at finishes exactly where the Hα emission of the galaxy with begins (which is supposed to be in the background), there is no overlap in the two emissions. Is it not a strange coincidence?
This coincidence reminds us of the case in Stephan’s Quintet, and the Hα bridge connecting NGC 7320 to the other galaxiesGut02 that we have analysed with the same technique: it also happens in this case that the Hα (Fig. 4 of Gut02 ) with discordant redshift begins exactly where the major component redshift finishes in the bridge connecting NGC 7320 to the rest of the group; in such a case, there was no overlapping of both Hα emissions with different velocities. A coincidence? Perhaps. There are also other coincidences in Stephan’s Quintet, such as radio emission isophotes with 6600–6700 km/s tracing quite exactly the shape of NGC 7320 ( km/s) (Figs 5, 8 of Wil02 ) and connecting it with the rest of the Quintet, similar to the case of NGC 3067+3C232 Car92 . None the less, there are other observations suggesting that there is no connection (see Gut02 and references therein) and it is quite likely also that NGC 7320 is a foreground galaxy with some coincidences in the system.
7 Probabilities of being background/foreground galaxies
There are two possible interpretations of these data: either the galaxies with different redshift are objects with different distances and the configurations are due to chance, or there are non-cosmological redshifts and objects with different redshifts are at the same distance. The first position, the standard one, defends the hypothesis that in all cases the main galaxy is surrounded by background/foreground objects. The idea is quite straightforward. The position of anomalous redshifts is not naive enough to deny this possibility, and this might be the case in some examples. However, the question is not whether such a fortuitous projection is “possible” but whether it is is “probable”.
For the calculation of this probability, we assume that the background/foreground objects are distributed according to a Poissonian distribution with the average density in any line of sight. There may be some clustering, but this does not essentially affect the numbers. A conspiracy in which our line of sight crosses several clusters of galaxies at different redshifts is not justified because the increase in probability due to the increase of density in lines of sight with clusters is compensated for by the additional factor to be multiplied to the present amount to take into account the probability of finding clusters in the line of sight. On average, in any arbitrary line of sight in the sky, the probability will be given anyway by the Poissonian calculation of (see further details in subsection 5.3.1 of Lop04 ).
7.1 Some clarifications concerning the typical rebuff “it is just an a posteriori calculation”
Before showing some rough calculations on statistical probability, we would like to address the question of “a posteriori probabilities”. It is said that one should not carry out a calculation of the probability for an a priori known configuration of objects (for instance, that they form a certain geometrical figure) because, in some way, all possible configurations are peculiar and unique. We agree while we speak about random configurations which do not indicate anything special. For example, if the Orion constellation is observed and we want to calculate the chance of their stars being projected in that exact configuration, we will get a null probability (tending towards zero as the allowed error in the position of the stars with respect the given configuration goes to zero), but the calculation of this probability is worthless because we have selected a particular configuration observed a priori. Therefore, the statistics to be carried out should not be about the geometrical figure drawn by the sources, unless that geometrical configuration is representative of a physical process in an alternative theory (for instance, aligned sources might be representative of the ejection of sources by a parent source).
In this last sense, we think that much of the statistics already published is valid and indicates the reality of some kind of statistical anomaly. It would be useful to look out for physical representations indicating peculiarities beyond mere uniqueness. We disagree with the claim that all attempts to calculate probabilities of unexpected anomalies are a posteriori whose validity may therefore be rejected. Some astrophysicists, when looking at our images, argue along the lines that it is curious that some of our objects fall on the filament, but that since they do the probability is 1 and there is therefore nothing special about our galaxies. According to this argument, everything is possible in a Poissonian distribution and nothing should surprise us. But we believe that statistics is something more serious than the postmodern rebuff that anything is possible.
We think that this anti-statistical position, this way of rejecting the validity of the calculated probabilities, is equivalent to the scepticism that those unfamiliar with mathematics express when we discuss the low probability of winning the lottery. They continue to bet regardless with hope that, however low the probability, somebody is sure to win so why not me. Typically they are unaware of how low some probabilities are and make no distinction between a case such as , which is a low but certainly makes a win possible from time to time, and the case , which virtually ensures no wins during seven lifetimes of daily betting. Small numbers, like the huge numbers prevalent in astronomy, are not easily assimilated. Of course, somebody wins the lottery but this is because the number of players multiplied by the probability to win each one is a number not much lower than one; otherwise, nobody would ever be likely to win.
Even worst, imagine that a person wins the lottery four consecutive times with only one bet each time. If we did not believe in miracles, we might think that this person had cheated. We might carry out some statistical calculations and show how improbable it was that he/she could have won by chance. What might somebody say about these calculations, that they are not valid because they were carried out a posteriori (after the person won the lottery four consecutive times)? We would not agree because there is an alternative explanation (he/she is cheating; and this explanation could be thought of before the facts) and the event of winning the lottery four consecutive times, apart from being unique among the random possibilities, would be an indication to support this hypothesis.
For our cases, we will use facts (alignments, galaxies on to filaments) which suggest that an alternative theory (a priori) claiming that galaxies/QSOs may be ejected by galaxies better represents the observations. We will not fix the type of extragalactic object observed; neither will we calculate the probability for a given type of galaxy, except when it is a QSO, since the alternative hypothesis suggest that these objects have a close relationship with the ejection scenario. We are not going to measure probabilities of forming triangles or any shape observed a priori only because it was observed. The peculiarity that we want to analyse is not comparable with the previous example of Orion because we have in mind a physical representation rather than a given distribution of sources. The difference with the Orion problem is that the peculiarity of Orion is not associated with any peculiar physical representation to be explained by an alternative theory. The question is as follows: what is the probability, , that the apparent fact be the fruit of a random projection of sources at different distances? In other words, what is the probability, , that the standard theory can explain the observed facts without aiming at alternative scenarios?
In the following subsections, we will take some information a priori before the calculation, for instance the magnitude of the object as a limiting magnitude of the probability density. We recognize that it is in this sense an a posteriori calculation, we are calculating the most pessimistic case (the lowest probability). Some other authors (e.g. Slu03 hypotheses H2-H3) use in their calculation of the probabilities the limiting magnitude of the survey instead of the magnitude of the object, which gives a much higher probability. However, this is not totally correct because in case that the magnitude of the object is much brighter than the limiting magnitude one should multiply by a factor that characterizes the probability of this object being much brighter than the limiting magnitude (the brighter it is, the lower is the probability), and this is equivalent to using the magnitude of the object. So we think that hypotheses H2-H3 in Slu03 are inappropriate because they lose statistical information (the existence of objects much brighter than the limiting magnitude, which has a low probability).
There are also other ways to lose information. One is to mix a datum with signal together with many other data without signal. This is what one gets when one uses a very large area instead of the area near the galaxies where the excess of sources is found, for instance, or the area of the filament, representative of the connection. Precisely because of that we use the distance of the source to derive the limiting probability density, or the area of the filament where the galaxies are embedded when it is a relevant fact instead of the area of the whole image. Using the radius of the image, for instance, would lose information on the concentration of objects around the center or in the filament. If the distribution is homogeneous (as expected in background sources which have nothing to do with the parent galaxy) both radii should be more or less the same; a factor of two in average would differentiate them. If it turned out that the QSOs/galaxies are much more concentrated around the parent galaxy than at some distance from it, this would be meaningful and both ways of making the statistical calculations would be equivalent, but in the first case one has to multiply the way of calculation by another probability which reflects how probable it is that in a large image we have QSO/galaxies near the galaxy instead of the borders of the image.
Taking into account all these considerations, we think that the following values of might be slightly underestimated (by a factor not higher than 10–100) with respect to an a priori calculation without any information on magnitudes or radii, but values of lower than should in any case be considered as statistically anomalous. In order to do a fairer estimate of the probability, we could calculate , where is the number of parameters on which depends. For instance, when we observe a source with magnitude 19 and we calculate we are putting the limiting magnitude exactly at the observed number; a fairer calculation would be such that a source with magnitude is a typical average source in the range , i.e. roughly that half of the sources with have and the other half have . This is equivalent to calculating and we multiply by a factor two for any independent parameter. Values of lower than are to be considered as statistically anomalous.
7.2 NGC 7603
From Figs 1 or 2 it seems extremely unlikely that objects 1–4 at different distances can, by chance, give a projection in the way these figures show up. The probability is as follows: NGC 7603 has a filament of area . The probability of having 3 further independent sources with the corresponding magnitudes of the objects 1–3 projected on that filament is (assuming that the individual probabilities for each event, , follow ):
| (1) |
where is the source density on the sky for the type of sources of the object with apparent magnitude less than (magnitudes corrected for Galactic+filament extinction, in order to be comparable with the galaxy counts in other fields), for the filter in which we know the magnitude of the source. We will use, for instance, filter B, but the statistics will give similar results for any filter.
The filament is approximately 35 arcsec long by 4 arcsec wide (the area plotted in Fig. 2): . Thus, with the magnitudes and the observed complete (non-biassed) galaxy countsLop04 : . depends on 5 parameters (3 limiting magnitudes and the width and height of the area, so , still low). The probability would be lower if we consider that objects #1 and #2 are positioned where the filament contacts NGC 7603B and NGC 7603 respectively, or the distribution of redshifts (from major to minor), or we restricted the types of galaxies, especially the fact that HII galaxies have a low probability of having a large Hα equivalent width Lop04 . We do not consider these facts (also to avoid some claim of “a posteriori” calculation, see above) but even so the probability is low. Even if we made a complete analysis of these characteristics among all Seyfert galaxies like NGC 7603 (there are 237 AGN-galaxies in the whole sky with B magnitude less than 14.0, the magnitude of NGC 7603Vau91 , according to SIMBAD), the probability of having at least one case would be [], or an order of magnitude larger if we consider all galaxies (Seyfert or otherwise) up to magnitude 14.
7.3 NEQ3 and MCG 7-25-46
For NEQ3, we can make a single probabilistic calculation starting from the pair formed by objects 1 and 2 in Fig. 5 and computing the probability of having object number 3 at 2.6 arcsec, obtaining . The probability of having the main galaxy ( mag) at a distance of 17 arcsec along a filament (with a width of 2.5 arcsec) connecting objects 1-2 and 4 is . Therefore, the probability of having all of them is []. If we want to know how probable it is to find a system like this in the whole sky we should multiply by the number of existing QSO-HII pairs separated by distances . There is no precise information about this, but the number should not be very large since the number of cases like this that we know of is very low; in fact, it is quite rare.
The probability of MCG 7-25-46 having a galaxy with (with a background density around 20 deg-2Met91 ) projected randomly onto its filament of area arcsec2 (10”x20”) towards south is []. Since the number of galaxies like MCG 7-25-46 () is of the order of a few ten of thousands in the whole sky, it is quite possible to find a coincidence like this and it is statistically very likely that this is not an anomalous redshift system. Nonetheless, as said, the origin of the filament and the abrupt transition of Hα remains to be explained.
7.4 GC 0248+430 and B2 1637+29
The cases of possible ejection can be evaluated as the probability of having a source within a radius multiplied by the probability of its being within a small range of position angles (except for the first pair of objects which defines the reference position angle).
For GC 0248+430, the probability of having the first QSO up to a bj-magnitude (background density around 2 deg-2Boy00 ) at distance up to 14.4′′ is . The probability of having the second quasar up to a -magnitude (background density around 50 deg-2Boy00 ) at a distance of up to 108′′ and within a position angle of range 20 degrees (5 degrees per quadrant) in the whole 360 degrees is (not so low; it is possibly a background source). The global probability is [].
For B2 1637+29, the probability of the galaxy with a difference of 4100 km/s from a background one, within 6.6′′ up to a B-magnitude (background density around 20 deg-2Met91 ) is . The probability of having the second up to -magnitude (density around 800 deg-2Met91 ) at a distance of up to 22.4′′ and within a position angle range of 2.4 degrees (0.6 degrees per quadrant) in the whole circle is . The global probability is []. If we took the SDSS number of 1.1 degrees of difference in the position angle, [].
Again, we should multiply these probabilities by the number of sources like GC 0248+430 (double nucleus sources up to the magnitude of this source), or B2 1637+29 in order to know how probable is finding a configuration like this in the whole sky. Let us forget the fact of the double nucleus and consider the faintest object (B2 1637+29, ). There are around galaxies up to this magnitudeMet91 in the whole sky. Only the fact that we have 2 cases like these with probabilities and - among the 200 thousand galaxies has a probability around ( of the order of unity). The probability is not low, so a background projection of some of the objects is quite probable, but if many other systems with alignment are found, as said in the first section, the probability will go lower and lower.
7.5 VV172 and Stephan’s Quintet
The fact of observing a Seyfert galaxy with a relatively high velocity outflow is rare in itself, but we will not consider it for the statistics in this study, only the fact of having a galaxy within a radius 10′′ of the north-east galaxy of the chain up to magnitude (SIMBAD; density of galaxies of any type up to this magnitude is around 30 deg-2Met91 ) gives []. The same calculation for NGC 7320 in Stephan’s Quintet to have this galaxy with (SIMBAD; density of galaxies of any type up to this magnitude is around 0.2 deg-2Met91 ) within a radius of 100′′ from NGC 7319 gives [].
There are 100 Hickson Groups, and the probability of having at least one case like VV 172 among them is [] or [] for Stephan’s Quintet, which is high enough to be a chance projection. However, the problem is that there are 43 cases among the Hickson Groups with members of discordant redshifts Sul97 , and although VV172 and many other cases (like Stephan’s Quintet) may be random projection of foreground/background sources, the global statistical analysis Sul97 remains to be solved in standard terms. If the probability were the same for all systems (), the probability of having 43 coincidences among 100 cases222The number of cases should be indeed larger, because groups of 3 galaxies should be considered in the statistics rather than galaxies, because they can give a group of 4 objects when a discordant object is joint. In any case, the number would be a few hundred within the limiting magnitudes of Hickson’s criteria. would be extremely low. Moreover, some other coincidences in VV172 and Stephan’s Quintet indicated in the corresponding sections above were not taken into account in this calculation, so the oddity of these systems is still considerable. The case of an outflow with a probability among starbursts in VV172 deserves further attention.
8 Gravitational lensing
An explanation for anomalous redshift systems might be found in principle if we considered some kind of gravitational lensing by the foreground object. However, the effect in the enhancement of the probability produced by an individual galaxy should be small. Some rough calculations can illustrate this argument: given a galaxy, the enhancement in the density of background objects as a function of angular distance, , to the mass centre will be Wu96 :
| (2) |
where is the magnification factor. In order to increase at least an order of magnitude in per object, we would need an average enhancement of in density for each of the galaxies. With the counts from Met91 , this requires an average magnification of of . It is clear from eq. (2) that the density of sources does not increase so quickly, unless the counts increase extremely rapidly with the limiting magnitude, which is not our case. This is so because the enhancement in the source counts increases due to the flux increase of each source but decreases due to the area distortion, which reduces the number counts by losing the sources within a given area Wu96 . A magnification of is extremely high and impossible to achieve by a galaxy lens. The highest known values of are up to a factor Ell01 for background objects apparently close to the central parts of massive clusters. Moreover, a single galaxy would only produce a significant magnification at very close distances from the centre - a few arcseconds.
The possibility that multiple minilenses are distributed in the halo of the galaxy has also been proposed: gravitational mesolensing by King objectsBar97 ; Buk03 . Strong gravitational lensing would be produced by King lenses: globular clustersBuk03 , dwarf galaxies, or clusters of hidden mass with masses between 103 and 109 M⊙. This is an interesting idea, although we are not convinced by the proof presented by one of authors of the idea Buk01 revealing excesses of galaxy/QSO pairs with , because many of these pairs were indeed the same object classified both as QSOs and galaxies. Anyway, the idea is interesting, and it might be considered as a serious proposal to solve the statistical correlations between QSOs and galaxies in large surveys, although, for individual cases, the area where the magnification is important is very small, so again the probability of having a large number of sources is most probably small. Further research is necessary in this direction, but up to now no solution has been found in terms of gravitational lensing applied to individual systems.
Weak gravitational lensing by dark matter has also been proposed as the cause of the statistical correlations between low and high redshift objects, but this seems to be insufficient to explain them Kov89 ; Zhu97 ; Bur97 ; Bur01 ; Ben01 ; Gaz03 ; Jai03 , and cannot work at all for the correlations with the brightest and nearest galaxies. More recently, Scranton et al.Scr05 have contradicted these results and have claimed that the correlation between QSOs and galaxies from the SDSS-survey is due to weak gravitational lensing. Indeed, what they have found was an ad hoc fit of the halo distribution function to an angular cross-correlation with very small amplitude () of faint galaxies with QSO candidates selected photometrically (5% of this sample are not QSOs; Ric04 ). Who knows what the origin is of this very small333Small because the mean separation among galaxies is small and any positive correlation of QSOs around a galaxy would be diluted with the contamination of many other QSOs possibly belonging to other galaxies. cross-correlation? In any case, as said, no explanation of gravitational lensing for correlations with the brightest and nearest galaxies is possible in terms of gravitational lensing, for instance for the high amplitude angular correlation found by Chu et al. Chu84 : . Scranton et al., even if they were right, have not solved the question of the correlation of galaxies and QSOs, because cross-correlations with bright and nearby galaxies, which are the most significant, are still without explanation in standard cosmological terms.
9 Other problems with QSOs redshifts
Other anomalies or questions with not very clear answers have arisen about the nature of QSOs, along with the suspicion that their distance is not as high as indicated by the cosmological interpretation of their redshift. The luminosity required for QSOs to be at such large distances is between to erg/s, an enormous energy to be produced in a relatively compact region (to justify the strong variability in short times). Although this problem is solved by means of megahuge black holes, the explanation might also be related to a bad determination of the distance. It seems that there are special problems in justifying the abundance of very high luminosity QSOs at , and the gravitational lensing solution does not workYam03 ; Fan01b . Moreover, the huge dispersion in the magnitude–redshift relation for QSOs observed from the Hewitt & Burbidge catalogHew87 makes it impossible to derive a Hubble law for them. This is a not strong argument since the intrinsic dispersion of luminosities might be high itself, but it might possibly indicate that something is wrong with the distance measurement.
Another caveat is that QSOs with very different redshifts have a low apparent brightness dispersion. This must be explained in the standard scenario as QSOs evolving their intrinsic properties so that they get smaller and fainter as the universe evolves. QSOs with the highest redshift reach equivalent absolute magnitudes in optical filters (with K-correction) of -30 or brighter, while local QSOs have absolute magnitudes around -16 (e.g. SDSS J113323.97+550415.8 with a redshift of only ). What a strange way to evolve for QSOs, that they should become so faint exactly in our epoch!
Superluminal motions of distant sources () are observed, i.e. angular speeds between two radio-emitting blobs which imply linear velocities greater than the speed of lightCoh86 . There are explanations for this. The so called relativistic beaming modelRee67 assumes that there is one blob, , which is fixed while blob is traveling almost directly towards the observer with speed with an angle between the line of advance and the line -observer. This leads to an apparent velocity of separation which may be greater than . There is also another proposal in a gravitational bending scenarioChi79 . However, both explanations share the common criticism of being contrived and having a somewhat low probability ()Nar84 .
If the cosmological distance of a QSO is correct, then its huge radiation would be strong enough to ionize the intergalactic medium. However, there are QSOs like PG 0052+251 at the core of a normal spiral galaxy in which this host galaxy appears undisturbed by the QSO radiationBah96 .
Other problems are that the mean Faraday rotation is less for objects at than at instead of increasing as expected if the polarization of radio emission rotates when it passes through magnetized extragalactic plasmas; the metallicity and dust content of very high redshift QSOs and their host galaxies is equal or even larger in some cases than their metallicity at low redshifts, etc. (see Lop03 , subsect. 2.3.2). In general, it seems that a non-cosmological redshift solution for QSOs fits many observations better .
10 Discussion
Some of the cases described in this paper may be just fortuitous cases in which background objects are close to the main galaxy, although the statistical mean correlations remain to be explained, and some lone objects have a very small probability of being a projection of background objects. Gravitational lensing seems not to be a solution yet, although further research is required, and the aim that the probabilities be calculated a posteriori is not in general an appropriate answer to avoid/forget the problem.
There are two possibilities: either we have been extremely lucky and all cases with were simply fortunate coincidences, or there are at least some few cases of non-cosmological redshifts. If we accept that some of our objects (maybe not all of them) with different redshifts had the distance of the main galaxy, there might be some truth in those models Bur99b ; Arp99a ; Arp99b ; Arp01 ; Bel02a ; Bel02b in which QSOs and other types of galaxies are ejected by a parent galaxy. In these models, galaxies beget galaxies, not all the galaxies would be not made from initial density fluctuations in a Big Bang Universe. The narrow line character in some of these objects would be a result of the ejection and interaction with the filament. Evidence is shown in other papers Kee98 ; Kee99 ; Arp99a ; Bur03 that when QSOs interact with ambient material they become less compact and have narrower lines emitted from a more diffuse body. This could be the physical explanation. Dynamically-disturbed starburst galaxies, as illustrated by the case of NGC 2777 Arp88 , tend to be the small companions of larger nearby galaxies belonging to older stellar populations. According to ArpArp88 , they are recently created galaxies in which star formation is stimulated by recent ejection from the parent galaxy; it has been suggested that some older stars, together with stellar material, are removed from the larger galaxy in the course of this ejection. Therefore, the observed fact of observing narrow emission line galaxies instead of QSOs is also contemplated in the model, although the analysis of QSO–galaxy associations is more frequent. The origin of these sources, through the interaction, would also explain the high observed equivalent width in their Hα lines.
For the explanation of the intrinsic redshift, there are several hypotheses. This is not the place to discuss these, since this is a paper about the observational facts (the phenomenology). Some proposals have been given at this meeting CCC-I and there are others in the literatureNar89 ; Lop04 .
Summing up, observations challenge the standard model, which assumes that the redshift of all galaxies is due to the expansion of the Universe, and we must consider they are at least an open problem to be solved.
References
- (1) H. C. Arp, QSOs, Redshifts and Controversies, Interstellar Media, Berkeley, 1987.
- (2) J. V. Narlikar. Space Science Reviews, 50, 523 (1989).
- (3) H. C. Arp. Catalogue of discordant redshift associations, Apeiron, Montreal, 2003.
- (4) Y. Chu, X. Zhu, G. Burbidge, and A. Hewitt. Astron. Astroph, 138, 408 (1984).
- (5) G. R. Burbidge. Astron. Astroph., 309, 9 (1996).
- (6) G. R. Burbidge. Publ. Astron. Soc. Pac., 113, 899 (2001).
- (7) G. de Vaucouleurs, A. de Vaucouleurs, A., H. G. Corwin Jr., R. J. Buta, G. Paturel, and P. Fouque, Third Reference Catalogue of Bright Galaxies, Springer-Verlag, N.Y., 1991.
- (8) W. Kollatschny, K. Bischoff, and M. Dietrich. Astron. Astrophys., 361, 901 (2000).
- (9) R. W. Goodrich. Astroph. J., 340, 190 (1989).
- (10) H. C. Arp. Astroph. Lett., 7, 22 (1971).
- (11) H. C. Arp. Publ. Astron. Soc. Pac., 87, 545 (1975).
- (12) N. A. Sharp. Astroph. J., 302, 245 (1986).
- (13) H. C. Arp. Astroph. J., 239, 469 (1980).
- (14) M. López-Corredoira, and C. M. Gutiérrez. Astron. Astrophys., 390, L15-L18 (2002).
- (15) M. López-Corredoira, and C. M. Gutiérrez. Astron. Astrophys., 421, 407-423 (2004).
- (16) B. J. Carter, D. G. Fabricant, M. J. Geller, and M. J. Kurtz. Astroph. J, 559, 606 (2001).
- (17) E. Telles, and R. Terlevich. Mon. Not. R. A. S., 275, 1 (1995).
- (18) J. A. Rose, A. E. Gaba, N. Caldwell, and B. Chaboyer. Astron. J., 121, 793 (2001).
- (19) K. V. Johnston, P. D. Sackett, and J. S. Bullock. Astroph. J, 557, 137 (2001).
- (20) C. M. Gutiérrez, and M. López-Corredoira. Astroph. J, 605, L5-L8 (2004).
- (21) H. C. Arp. Astroph. J, 218, 70 (1977).
- (22) D. Womble, V. Junkkarinen, R. Cohen, and E. M. Burbidge. Astron. J, 100, 1785 (1990).
- (23) V. Borgeest, M. Dietrich, U. Hopp, W. Kollatschny. K.-J. Schramm, Astron. Astroph., 243, 93 (1991).
- (24) F. Hoyle, and G. Burbidge. Astron. Astroph., 309, 335-344 (1996).
- (25) S. Kirhakos, W. L. W. Sargent, D. P. Schneider, J. N. Bahcall, B. T. Jannuzi, D. Maoz, and T. A. Small. Publ. Astr. Soc. Pac., 106, 646 (1994).
- (26) H. R. de Ruiter, R. Fanti, P. Parma, J. Lub, R. Morganti, and R. D. Ekers. Astron. Astroph., 337, 711-713 (1998).
- (27) J. W. Sulentic, and H. C. Arp. Astroph. J, 88, 267 (1983).
- (28) S. Veilleux, and D. S. Rupke. Publ. Astro. Soc. Australia, 21, 393 (2004).
- (29) J. W. Sulentic, and H. C. Arp. Astroph. J., 297, 572 (1985).
- (30) C. M. Gutiérrez, M. López-Corredoira, F. Prada, and M. C. Eliche. Astroph. J., 579, 592 (2002).
- (31) B. A. Williams, M. S. Yun,and L. Verdes-Montenegro. Astron. J., 123, 2417 (2002).
- (32) C. L. Carilli, and J. H. van Gorkum. Astroph. J., 399, 373 (1992).
- (33) D. Sluse, J. Surdej, J. F. Claeskens, Y. de Rop, D. W. Lee, A. Iovino, A., and M. R. S. Hawkins. Astron. Astroph., 397, 539 (2003).
- (34) N. Metcalfe, T. Shanks, R. Fong, and L. R. Jones. Mon. Not. R. A. S., 249, 498 (1991).
- (35) B. J. Boyle, T. Shanks, S. M. Croom, et al. Mon. Not. R. A. S., 317, 1014 (2000).
- (36) J. W. Sulentic. Astroph. J, 482, 640 (1997).
- (37) X. P. Wu. Fund. Cosmic Phys., 17, 1 (1996).
- (38) R. Ellis, M. R. Santos, J. P. Kneib, and K. Kuijken. Astroph. J, 560, L19 (2001).
- (39) Y. V. Baryshev, and Y. L. Bukhmastova. Astron. Rep., 41, 436 (1997).
- (40) Y. L. Bukhmastova. Astron. Lett., 29, 214 (2003).
- (41) Y. L. Bukhmastova. Astron. Rep., 45, 675 (2001).
- (42) I. Kovner. Astroph. J., 341, L1 (1989).
- (43) Z.-H. Zhu, X.-P. Wu, and L. Z. Fang, Astroph. J., 490, 31 (1997).
- (44) G. R. Burbidge, F. Hoyle, and P. Schneider. Astron. Astroph, 320, 8 (1997).
- (45) N. Benítez, J. L. Sanz, and E. Martínez-González. Mon. Not. R. A. S., 320, 241 (2001).
- (46) E. Gaztañaga. Astroph. J., 589, 82 (2003).
- (47) B. Jain, R. Scranton, and R. K. Sheth. Mon. Not. R. A. S., 345, 62 (2003).
- (48) R. Scranton, B. Ménard, G. T. Richards, et al. astro-ph/0504510 (2005).
- (49) G. T. Richards, R. C. Nichol, A. G. Gray, et al. Astroph. J. Supp. Ser., 155, 257 (2004).
- (50) S. F. Yamada, Y. Shioya, Y. Taniguchi, et al. Publ. Astr. Soc. Japan, 55, 733 (2003).
- (51) X. Fan, V. K. Narayanan, R. H. Lupton, R. H., et al. Astron. J., 122, 2833 (2001).
- (52) A. Hewitt, and G. Burbidge. Astroph. J. Supp. Ser., 63, 1 (1987).
- (53) M. H. Cohen. Highlights of Modern Astrophysics, edited by S. L. Shapiro, and S. A. Teukolsky, Wiley Interscience, New York, 1986, p. 299.
- (54) M. J. Rees. Mon. Not. R. A. S., 135, 345 (1967).
- (55) S. M. Chitre, and J. V. Narlikar. Mon. Not. R. A. S., 187, 655 (1979).
- (56) J. V. Narlikar, and S. M. Chitre. J. Astrophys. Astron., 5, 495 (1984).
- (57) J. N. Bahcall, S. Kirhakos, and D. P. Schneider. Astroph. J., 457, 557 (1996).
- (58) M. López-Corredoira. Recent Res. Devel. Astronomy & Astroph., 1, 561-589 (2003).
- (59) G. R. Burbidge. Cosmological Parameters and the Evolution of the Universe, edited by K. Sato, Kluwer, Dordrecht, 1999, p. 286.
- (60) H. C. Arp. Astroph. J., 525, 594 (1999).
- (61) H. C. Arp, Active Galactic Nuclei and Related Phenomena, edited by Y. Terzian, E. Khachikian and D. Weedman, Astronomical Society of the Pacific, S. Francisco, 1999, p. 347.
- (62) H. C. Arp, and D. A. Russell. Astroph. J., 549, 802 (2001).
- (63) M. B. Bell. Astroph. J., 566, 705 (2002).
- (64) M. B. Bell. Astroph. J., 567, 801 (2002).
- (65) W. C. Keel, R. A. Windhorst, S. H. Cohen, S. Pascarelle, and M. Holmes. NOAO Newsletter, 53, 1 (1998).
- (66) W. C. Keel, S. H. Cohen, R. A. Windhorst, and I. Waddington. Astron. J., 118, 2547 (1999).
- (67) E. M. Burbidge, G. R. Burbidge, H. C. Arp, and S. Zibetti. Astroph. J., 591, 690 (2003).
- (68) H. C. Arp, High energy astrophysics: Supernovae, remnants, active galaxies, cosmology, Springer-Verlag, Berlin, 1988, p. 160.