Some thoughts and some new results about the Butcher–Oemler effect
Abstract
These short notes collect some thoughts about the way Butcher–Oemler-like and evolutionary studies are performed. We emphasize the shortcomings of several overlooked technical ingredients in the above type of studies, with the hope of making a useful cookbook for future works. We also briefly report new results of an ongoing Butcher–Oemler study at intermediate redshift.
INAF–Osservatorio Astronomico di Brera, Milano, Italy
1 Introduction
One of the central issues in extragalactic astronomy is to understand how and when galaxies evolve, and whether and how their evolution is related to environment. There is no consensus about the above topics, even considering one single standard observable, such as the fraction of blue galaxies: from one side there are several claims about the existence of a Butcher–Oemler (BO) effect (e.g. Butcher & Oemler 1985, Rakos & Shombert 1995), on the other side, some studies do not detect any Butcher-Oemler effect (e.g. Andreon, Lobo & Iovino 2004, Ellingson et al. 2001), and/or cast doubts about the previously found results (e.g. Andreon, Lobo & Iovino 2004).
We suggest here some thoughts about some current works addressing evolutionary studies, often in a BO-like style, mostly of technical nature, but with a strong impact on the final result. Details can be found in Andreon & Ettori (1999), Andreon, Lobo & Iovino (2004), Andreon et al. (2005). Although some considerations presented here seems obvious, they are sometime overlooked.
2 Problems
2.1 Cluster–related selection effect
It is well known that clusters are not an homogenous family of objects, all characterized by a single value of the fraction of blue galaxies. For example, the Virgo cluster is much richer in blue galaxies than Coma (e.g. Butcher & Oemler 1984). Therefore, the comparison of clusters at different redshifts, i.e. any claim about the existence of a BO effect, relies on the assumption that what is compared is the same cluster at different ages. Andreon & Ettori (1999) clarified, instead, that because of the lack of appropriate cluster samples, clusters of different masses at different redshifts are usually compared (see Figure 1), much like “comparing unripe apples with ripe oranges in understanding how fruit ripens”. If one want to study the evolution of galaxy properties, then the cluster sample should be carefully chosen and cluster selection effects should be attentively addressed because of the known correlation between cluster and galaxies properties.
Allington-Smith et al. (1993) show that the optical selection of clusters is prone to produce a biased - hence inadequate - sample for studies on evolution since at larger redshifts it naturally favours the inclusion in the sample of clusters with a significant fraction of blue galaxies. Andreon, Lobo & Iovino (2004) show that high redshift clusters with a large fraction of blue galaxies are over-represented in optical cluster catalogs by a factor two, with respect to identical clusters but without a bursting population. Therefore, optically selected clusters should be use with extreme caution in BO-like studies.
Clusters have various size and different values of the fraction of blue galaxies at different clustercentric radii (outskirts are richer in blue galaxies). Therefore, a comparison of clusters having different sizes cannot use fractions of blue galaxies measured at the same physical size (say, 1 Mpc), because such a radius reaches the outskirts of poor clusters (rich in blue galaxies), but enclosed the central regions only of rich clusters (poor in blue galaxies). This is one of the reason why Butcher & Oemler (1984) suggested the use of an adaptive aperture.

2.2 Galaxy evolution: luminosity
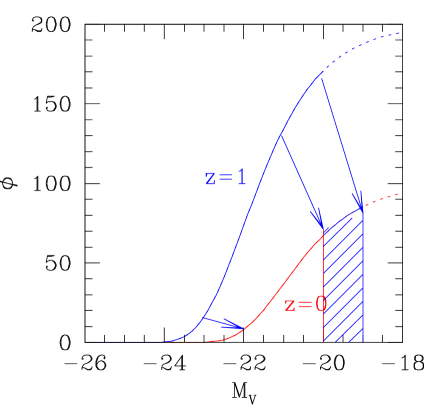
It is well known that galaxies evolve, i.e. that they do not take a constant value of the absolute magnitude all along their life. Nevertheless, in the selection of galaxies to be compared, most studies adopted a fixed and unique absolute magnitude limit at all redshifts (the Butcher–Oemler prescription is mag). Between and the absolute luminosity of a typical galaxy changes by about one mag (depending somewhat on filter and colour), which means that by selecting a fixed and unique absolute magnitude limit at all redshifts we are not selecting the same galaxy at two different look–back times: galaxies in the faintest magnitude bin at high redshift are included in the high-redshift sample, but their luminosity evolution will make them fainter than the compared galaxies in the low redshift sample, as sketched in Fig 2. Therefore, the choice of a fixed and unique absolute magnitude limit induces a drift across the luminosity border. This drift is an import one: for the above limiting magnitude, what drift out from the sample is about 40 % of what remains in the sample.
The choice of a fixed and unique absolute magnitude limit does not select the same object at different redshift, and, because the know correlation between luminosity, color, mass and size, may bring in redshift–dependent biases on these quantities. These trends are selection effects, however, not a measure of the evolution of galaxy properties, and therefore are of nuisance, not of interest. We suggest that if we want to focus on the evolution of galaxy properties one should minimize the drift by choosing, for example, an evolving limiting magnitude, as did Ellingson et al. (2001), de Propris et al. (2003), Andreon, Lobo & Iovino (2004), Andreon et al. (2005) in their studies.
2.3 Galaxy evolution: colour
It is well known that the colour of the galaxies changes during their life. Nevertheless, some studies adopted a fixed and unique absolute colour value to define when a galaxy should be called “blue” (e.g. Rakos & Shombert 1995, Faber et al. 2005, Nuijten et al. 2005). Let us consider, for example, as definition of blue the following: mag (rest-frame). At all galaxies are blue, simply because the universe at is not old enough to allocate a redder population (unless an uncommon value of extinction or metallicity is considered). Using the above definition of blue, the fraction of blue galaxies does not tell about the relative evolution of red and blue galaxies, simply because that fraction is obliged to be equal to 1 at and to tend to 1 at by definition, i.e. independently on the relative evolution of red and blue galaxies. We discourage the use of similar definition of “blue”.
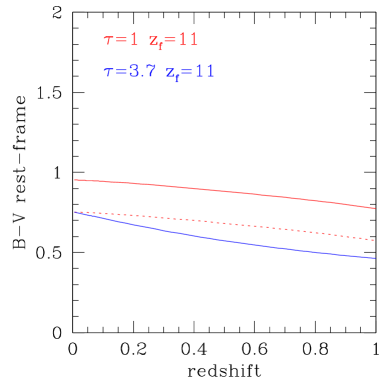
The Butcher & Oemler (1985) definition of “blue” is much better than the above definition: galaxies are defined blue if they are at least 0.2 mag bluer than early–type galaxies at the same redshift, i.e. mag. This definition can be improved: star aging modifies the as a function of the galaxy age (or look-back time): a galaxy having mag today has not mag at a different redshift, as shown in Figure 3. Objects below the dotted line and above the continuous line drift from one class to the other as time goes. Since the choice of a fixed allows a possible drift from one class to the other, and assuming that a redshift dependence is found for the fraction of blue galaxies, does the above tell us something about the relative evolution of red and blue galaxies? It may merely reflect a selection bias related to the way galaxies are divided in colour classes: a class naturally gets contaminated by the other one, and galaxies classes are mixed with different proportions at different redshifts whit such a definition of “blue”.
We believe that adopting an evolving is preferable, because it minimize the drift from one class to another. This solution is model dependent, however. A better solution is to track some observed feature of the colour distribution, such as the valley between red and blue galaxies (e.g. Strateva et al. 2001) at all redshifts and use it to divide galaxies in colour classes.
2.4 The nightmare of the statistical analysis
Clusters of galaxies appear projected over foreground or background galaxies. However, in most occasions, we ignore which galaxies are cluster members and which ones are interlopers. Therefore, the background contribution is estimated in some way (for example in a reference line of sight) and subtracted statistically. In Andreon, Lobo & Iovino (2004) we introduce a first discussion about the difficult task of measuring the error on the fraction of blue galaxies showing that at least some previous works have underestimated errors and, by consequence, overstated the evidence for the BO effect. The task has been further elaborated (and a rigorous solution has been found) in d’Agostini (2004) (see also Andreon et al. 2005). We defer interested readers to the above papers, remarking only the complexity of the correct statistical analysis. Let us focus in the apparent simple problem of the definition of the fraction of blue galaxies. Intuitively (and according to Butcher & Oemler 1985) the fraction of blue galaxies is the ratio between the number of blue galaxies over the total number of galaxies. This is also the maximum likelihood estimate (or best estimate) of the fraction of blue galaxies. However, the large majority of papers studying the Butcher-Oemler effect find some clusters with a negative fraction of blue galaxies (e.g. Butcher & Oemler 1984 and Wake et al. 2005). As a physicians, negative values of the blue fraction should make us unhappy, because, for sure, no cluster has a negative number of blue galaxies, thus suggesting that a better definition of fraction of blue galaxies should exist (for example one that does not take impossible values). As statisticians and mathematicians, negative values of the fraction of blue galaxies cannot be best (maximum likelihood) estimates, because every value in the 0 to 1 range is a better (more likely) estimate of the fraction of blue galaxies than the quoted (impossible!) negative value.
The point is that in presence of small number statistic, an important background or a physical border ( or ) it is dangerous to stick on intuition and on the simple statistical rules (like the formula of summing errors in quadrature, or maximum likelihood estimates), because the use of simple rules may lead to un-robust results. A rigorous statistical analysis provides, instead, results of known reliability.
3 Results
The above difficulties are no unsurmountable problems. Appropriate cluster samples are being built, for example from x-ray surveys: x-ray luminosity is a tracer of cluster mass, and such a selection should allow to select similar clusters at different redshifts. The problems raised by the difficulty of the statistical analysis are now surmounted. The remaining issues have already been addressed in published papers although not every paper account for every issue.
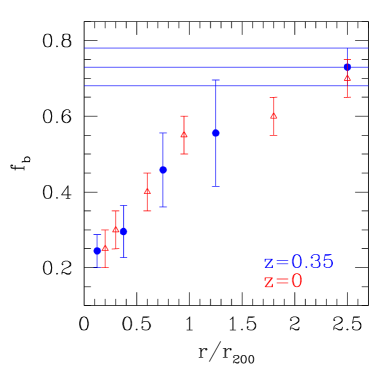
Fig. 4 shows the fraction of blue galaxies, as a function of cluster-centric distance, from Andreon et al. (2005). These authors studied a volume-complete sample of clusters (x-ray selected, to avoid the cluster-selection bias mentioned in sec 2.1), at , and compared it to several local cluster samples. Cluster sizes have been measured with a good precision. An evolving limiting magnitude is used to select galaxies to be compared. Similarly, an evolving is used to divide galaxies in colour classes. The statistical analysis relies on the rigorous computation introduced in d’Agostini (2004). Figure 4 shows several interesting results. First of all, the cluster affects the properties of the galaxies up to two virial radii at . Second, the equality of the and fractions of blue galaxies implies that during the last 3 Gyrs no evolution of the fraction of blue galaxies, from the cluster core to the field value, is seen. Since the authors adopt a definition of blue that accounts for the reduced age of the universe at high redshift, the evolution of which the authors talk about is beyond star aging. Finally, the agreement of the radial profiles of the fraction of blue galaxies at and implies that the pattern infall did not change over the last 3 Gyr, or, at least, its variation has no observational effect on the studied quantity.
At this meeting, Loh et al. (2005) presented an identical plot, but for a composite cluster formed by re-scaling and staking a large cluster sample, without found the radial gradient shown in Fig. 4. As the authors noted, their lack of detection could be due to their noisy measure of the cluster size, needed to rescale clusters during the staking, because a noise measurement smoothes out any possible gradient. The uncertainty on the cluster size, needed to measure the fraction of blue galaxies at a reference radius (sec 2.2) also affects their claim about the existence of a Butcher-Oemler effect.
To summarize, its seems that time is ripe for a reliable determination of the colour and luminosity evolution of galaxies and how they depend on environment, as also testified by several results presented at this meeting.
Acknowledgements. It is a pleasure to thank all the colleagues that helped me all along these years on the topics discussed in this paper. I thank co-authors of my latest paper on the BO effect for allowing me to present Fig. 4 in advance of publication.
References
- [1] Andreon, S. & Ettori, S. 1999, ApJ, 516, 647
- [2] Andreon, S., Lobo, C., & Iovino, A. 2004, MNRAS, 349, 889
- [3] Andreon, S., et al. 2005, MNRAS, submitted
- [4] Butcher, H. & Oemler, A. 1984, ApJ, 285, 426
- [5] D’Agostini G., 2004, physics/0412069
- [6] De Propris, R., Stanford, S. A., Eisenhardt, P. R., & Dickinson, M. 2003, ApJ, 598, 20
- [7] Ellingson, E., Lin, H., Yee, H. K. C., & Carlberg, R. G. 2001, ApJ, 547, 609
- [8] Faber, S. M., et al. 2005, ApJ, in press (astro-ph/0506044)
- [9] Nuijten, M. J. H. M., Simard, L., Gwyn, S., Rottgering, H. J. A. 2005, ApJ, 626, L77
- [10] Rakos, K. D. & Schombert, J. M. 1995, ApJ, 439, 47
- [11] Strateva, I., et al. 2001, AJ, 122, 1861
- [12] Wake, D. A., Collins, C. A., Nichol, R. C., Jones, L. R., & Burke, D. J. 2005, ApJ, in press (astro-ph/0503480)
- [13] Weiner, B. J., et al. 2005, ApJ, in press, astro-ph/0411128