The possibility of detecting planets in the Andromeda Galaxy
Abstract
The Angstrom Project is using a global network of 2m-class telescopes to conduct a high cadence pixel microlensing survey of the bulge of the Andromeda Galaxy (M31), with the primary aim of constraining its underlying bulge mass distribution and stellar mass function. Here we investigate the feasibility of using such a survey to detect planets in M31. We estimate the efficiency of detecting signals for events induced by planetary systems as a function of planet/star mass ratio and separation, source type and background M31 surface brightness. We find that for planets of a Jupiter-mass or above that are within the lensing zone ( AU) detection is possible above 3 , with detection efficiencies for events associated with giant stars, which are the typical source stars of pixel-lensing surveys. A dramatic improvement in the efficiency of – 60% is expected if follow-up observations on an 8m telescope are made possible by a real-time alert system.
Subject headings:
gravitational lensing – planets and satellite: general – galaxies: individual (M31)1. Introduction
Various techniques are being used to search for extrasolar planets, including the radial velocity technique (Mayor & Queloz, 1995; Marcy & Butler, 1996), transit method (Struve, 1952), direct imaging (Angel, 1994; Stahl & Sandler, 1995), pulsar timing (Wolszczan & Frail, 1992), and microlensing (Mao & Paczyński, 1991; Gould & Loeb, 1992). See the reviews of Perryman (2000, 2005). The microlensing signal of a planetary companion to microlens stars is a short-duration perturbation to the smooth standard light curve of the primary-induced lensing event occurring on a background source star. Once the signal is detected and analyzed, it is possible to determine the planet/star mass ratio, , and the projected planet-star separation, (normalized by the angular Einstein ring radius ). Recently, two robust microlensing detections of exoplanets were reported by Bond et al. (2004) and Udalski et al. (2005).
The microlensing technique has various advantages over other methods. First, microlensing is sensitive to lower-mass planets than most other methods (except pulsar timing) and it is possible, in principle, to detect Earth-mass planets from ground-based observations (Gould, Gaudi, & Han, 2004). Second, the microlensing technique is most sensitive to planets located in the so-called lensing zone corresponding to the range of 0.6 – 1.6 Einstein ring radii. The typical value of the Einstein radius, , for Galactic lensing events is a couple of AU, and thus the lensing zone roughly overlaps with the habitable zone. Third, the microlensing technique is the only proposed method that can detect and characterize free-floating planets (Bennett & Rhie, 2002; Han et al., 2005). Fourth, the biases in the search technique are less severe and can be quantified easily compared to other methods (Gaudi et al., 2002). Therefore, the microlensing technique will be able to provide the best statistics of the Galactic population of planets.
In addition to the advantages mentioned above, the microlensing technique is distinguished from other techniques in the sense that the planets to which it is sensitive are much more distant than those found with other techniques. With the advent of photometry techniques like the difference imaging (Alard & Lupton, 1998) and pixel method (Melchior et al., 1999), microlensing searches are not restricted to the field within the Galaxy and can be extended to unresolved star fields of nearby galaxies such as M31. Therefore, microlensing is the only feasible technique that can detect planets located in other galaxies.
Microlensing searches toward M31 have been and are being carried out by various collaborations including the POINT-AGAPE (Aurière et al., 2001; Paulin-Hendriksson et al., 2002, 2003; An et al., 2004; Belokurov et al., 2005), AGAPE (Ansari et al., 1997, 1999), VATT-Colombia (Crotts & Tomaney, 1996; Uglesich et al., 2004), MEGA (de Jong et al., 2004), and WeCAPP (Riffeser et al., 2001, 2003) collaborations, as well as MDM (Calchi Novati, et al., 2003), McGraw-Hill (Calchi Novati, et al., 2002), and Nainital (Joshi et al., 2003, 2005) surveys. The monitoring frequencies of these experiments are typically observations per week, too low to detect planetary signals. However, with the expansion of the global telescope network, the monitoring frequency of such surveys is rapidly increasing. For example, a new M31 pixel-lensing survey, the Andromeda Galaxy Stellar Robotic Microlensing (Angstrom) project is expected to achieve a monitoring frequency of observations per 24-hour period by using a network of telescopes, including the robotic 2m Liverpool Telescope at La Palma, Faulkes Telescope North in Hawaii, 1.8m telescope at the Bohyunsan Observatory in Korea, and the 2.4m Hiltner Telescope at the MDM Observatory in Arizona (Kerins et al., 2005).
The possibility of detecting planetary microlensing events caused by a lens located in M31 was discussed by Baltz & Gondolo (2001). However, the main focus of that paper was evaluating the detectability of events caused by binary lenses in general and the comment about the planetary lensing was brief treating the planetary system as one case of the binary lenses. In addition, their detection rate estimate of the M31 planetary lensing events was based only on events that exhibit caustic crossings, while a significant fraction of events with detectable planetary signals might be non-caustic-crossing events. Moreover, the aim of their work is was the rough evaluation of feasibility and thus not based on specific observational setup and instruments. Similarly, the work of Covone et al. (2000) was also based on an arbitrary observational setup.
In this paper, we explore the feasibility of detecting planets in M31 from a high-frequency pixel-lensing survey using a global network of 2m-class telescopes. The paper is organized as follows. In § 2, we briefly describe the basics of planetary lensing. In § 3, we estimate the efficiency of detecting planetary signals for events induced by planetary systems with various planet-star separations and mass ratios, associated with source stars of different types, and occurring toward fields with a range of surface brightness . From the dependence of the detection efficiency on these parameters, we investigate possible types of detectable planets, the optimal source stars, fields, and observation strategy for M31 planet detections. In § 4, we discuss about methods to further improve the planet detection efficiency. We summarize the results and conclude in § 5.
2. Basics of Planetary Lensing
Planetary lensing is described by the formalism of a binary lens with a very low-mass companion. Because of the very small mass ratio, the planetary lensing behavior is well described by that of a single lens of the primary star for most of the event duration. However, a short-duration perturbation can occur when the source star passes the region near a caustic, which represent the set of source positions at which the magnification of a point source becomes infinite. The caustics of binary lensing form a single or multiple closed figures where each figure is composed of concave curves (fold caustics) that meet at cusps.
For the planetary case, there exist two sets of disconnected caustics. One ‘central caustic’ is located close to the host star. The other ‘planetary caustic’ is located away from the host star and its number is one or two depending on whether the planet lies outside () or inside () the Einstein ring. The size of the caustic, which is directly proportional to the planet detection efficiency, is maximized when the planet is located in the ‘lensing zone’, which represents the range of the star-planet separation of (Gould & Loeb, 1992).
The planetary perturbation induced by the central caustic is of special interest for M31 pixel-lensing events. While the perturbation induced by the planetary caustic can occur at any part of the light curve of any event, even those of low magnification, the perturbation induced by the central caustic always occurs near the peak of the light curve of a high-magnification event. Then, the chance for the M31 pixel-lensing events to be perturbed by the central caustic can be high because these events tend to have high magnifications. In addition, the chance of detecting planetary signals for these events becomes even higher due to the improved photometric precision thanks to the enhanced brightness of the lensed source star during the time of perturbation.
3. Detection Efficiency
To estimate the efficiency of detecting planetary signals of M31 events, we compute the ‘detectability’ defined as the ratio of the planetary signal, , to the photometric precision, , i.e.,
| (1) |
The planetary signal is the deviation of the lensing light curve from that of the single lensing event of the primary lens star, and thus it is defined as
| (2) |
where is the magnification of the planetary lensing and is the single lensing magnification caused by the host star alone. For an M31 pixel-lensing event, the lensing signal is the flux variation measured on the subtracted image, while the noise is dominated by the background flux. Then, the photometric precision can be approximated as
| (3) |
where and are the baseline flux of the lensed source star and the blended background flux, respectively. Under this definition of the detectability, implies that the planetary signal is equivalent to the photometric precision.
We estimate the detection efficiency for a representative event that is most probable under the assumption that the M31 halo is not significantly populated with MACHOs. Under this assumption, it is expected that the events to be detected toward the field in and around the M31 bulge, where the event rate is highest, are caused mostly by low-mass stars located in the bulge itself (Kerins et al., 2005). We, therefore, choose a representative event as the one caused by a lens with a primary star mass of and distances to the source star and lens of kpc and kpc, respectively. Then, the corresponding physical and angular Einstein ring radii are and , respectively. The assumed timescale is days.
To see the dependence of the detection efficiency on the stellar type of the source star, we test several types of source stars with various absolute magnitudes and sizes. The type of the source star affects the detection efficiency in two different ways. On one side, high-luminosity of the bright source star contributes to the detection efficiency in a positive way because the photometric precision improves with the increase of the source star brightness. If the source star is too bright, on the other hand, it is likely to be a giant star, for which the planetary signal might be diminished due to the finite-source effect (Bennett & Rhie, 1996). The stellar types of the tested source stars are giant, A5, and F5 main-sequence (MS) stars with the absolute magnitudes of , 1.73, and 2.86, and stellar radii of , , and , respectively. The corresponding source angular radii normalized by the Einstein radius are , 0.005, and 0.004, respectively.
Observations and photometry are assumed to be carried out as follows. Following the specification of the Liverpool Telescope, we assume that the instrument can detect 1 photon/s for an star. We also assume that the average seeing is and the observation is carried out such that small-exposure images are combined to make a 30 min exposure image to obtain a high signal-to-noise ratio while preventing saturation in the central bulge region. The photometry is done such that the flux variation is measured at an aperture that maximizes the signal-to-noise ratio of the measured flux variation. In the background-dominated regime such as the M31 field, the noise is proportional to the aperture radius , i.e. . On the other hand, assuming a gaussian PSF, the measured source flux variation scales as , where . Therefore, the signal-to-noise ratio scales as . Then, the optimal aperture that maximizes the signal-to-noise ratio is . With the adoption of this aperture, the fraction of the source flux within the aperture is , where is the flux measured at .
In Figure 1–3, we present the contour maps of the detectability of the planetary lensing signal as a function of the source star position for events caused by planetary systems with various and , and involved with source stars of various stellar types. The contours are drawn at the levels of (white), 2.0 (yellow), and 3.0 (brown), respectively. We assume that the planetary signal is firmly detected if . In the map, we present only the region around the ‘detection zone’, which represents the region of the source star position where the magnification is higher than a threshold magnification required for the event detection, . The threshold magnification is defined by , i.e., detection of the event. If we define as the threshold lens-source impact parameter corresponding to , everything of interest is contained within the circle with the radius (marked by a white dotted circle in each panel). We, therefore, use as a scale length instead of the Einstein radius. However, to provide the relative size of the detection zone, we mark the absolute value of in the bottom left panel of each figure. The value of the threshold impact parameter decreases as either the source star becomes fainter or the background surface brightness increases. In Figure 4, we present the variation of the threshold impact parameter as a function of the background surface brightness for source stars of various types. The maps are constructed for a common surface brightness of , which is a representative value of the M31 bulge region. For the construction of the maps, we consider the attenuation of the magnification caused by the finite-source effect.
From the maps, we find that although both the sizes of the event detection zone () and the region of the planetary perturbation () decrease as the source star becomes fainter, the rate of the decrease of the planetary perturbation region is smaller than the rate of decrease of the event detection zone. This is because the planetary perturbation is confined to the region around the caustic whose size does not depend on the source brightness. As a result, the perturbation region occupies a greater fraction of the event detection zone with the decrease of the source star brightness. However, this does not necessarily imply that the planet detection efficiency of events associated with MS stars is higher than that of events associated brighter giant stars. This is because despite the slow rate of decrease, the perturbation region does decrease, and thus picking up the resulting short-duration planetary signals for events involved with faint MS stars requires higher monitoring frequency.
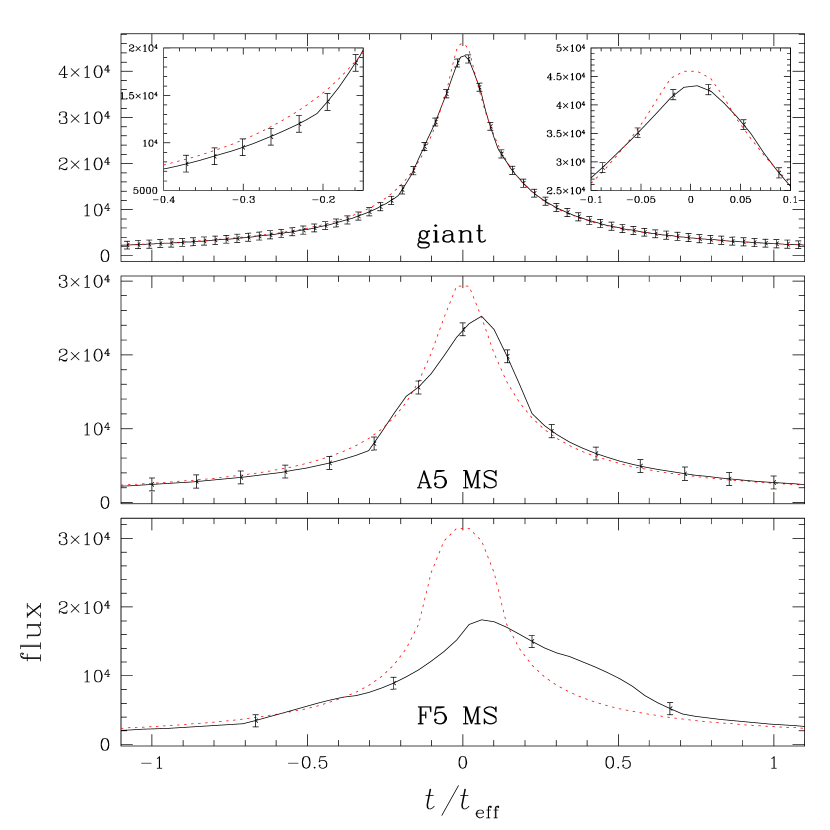
Once the maps of the detectability are constructed, we produce a large number of light curves of lensing events resulting from source trajectories with random orientations and impact parameters (see example light curves in Figure 5). Then, we estimate the detection efficiency as the ratio of the number of events with detectable planetary signals to the total number of the tested events. We assume that on average five combined images with a 30 min exposure are obtained daily following the current Angstrom survey. By applying a conservative criterion for the detection of the planetary signal, we assume that the planet is detected if the signal with is detected at least five times during the event. Since the monitoring frequency is , this implies that the planetary signal should last at least 1 day for detection.

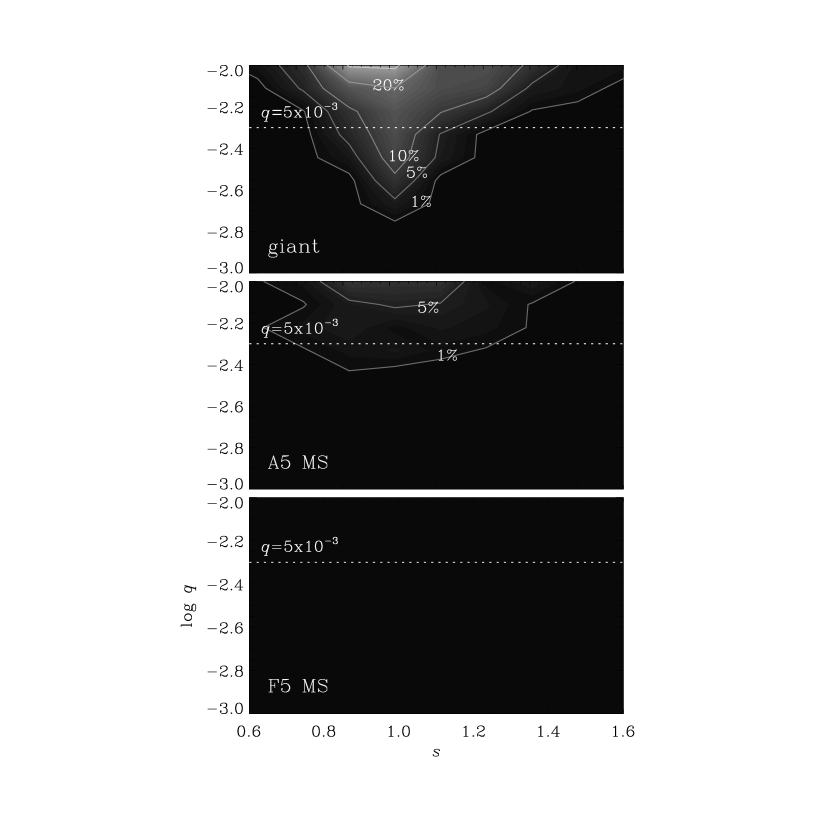

In Figure 6, we present the estimated detection efficiency as a function of and for events involved with various source stars. In Figure 7, we also present the variation of the efficiency depending on the background surface brightness, where the efficiency is estimated by varying but fixing the lens parameters as and . From the figures, we find the following results.
-
1.
For events associated with giant source stars, it will be possible to detect planets with masses equivalent to or heavier than the Jupiter (). Although the efficiency varies considerably depending on the star-planet separation, the average efficiency is for events caused by a lens system having a planet with a mass ratio and located in the lensing zone. However, it is expected that detecting planets with masses less than the Saturn () would be difficult.
-
2.
The optimal events for the detections of the planetary signals are those associated with giant stars. It is expected that detecting planets for events associated with MS stars would be difficult because of the poor photometry and the resulting short durations of the planetary signals. For example, the duration of the event associated with an F-type MS star is . Considering that the planetary perturbation region with occupies a fraction of the detection zone (as shown in Fig. 3), the planetary signal would be too short for detection. Although planets can be detected with a non-negligible efficiency () for events associated with A-type MS stars, the number of planet detections from these events would be small because of the rarity of early-type MS stars projected on the M31 bulge region. MS-associated events could be detected at low surface-brightness regions as shown in Figure 7, but the event rate toward these fields would be low due to the low column density of lens matter along the line of sight.
-
3.
The efficiency peaks at a certain surface brightness. In the region of very high surface brightness, planet detection is limited by the poor photometry. In the very low surface-brightness regime, on the other hand, the event detection zone is significantly larger than the size of the planetary deviation region, which is confined around caustics. As a result, the efficiency, which is proportional to the one-dimensional size ratio of the planetary deviation region to the detection zone, is low in this region. The peak efficiency occurs at for events involved with giant source stars (see Figure 7).
-
4.
In most cases, the planetary perturbations of M31 pixel-lensing events are induced by central caustics. Therefore, an observational strategy of focusing on these perturbations would maximize the detections of M31 planets. An alert system based on real-time survey observations combined with prompt follow-up observations would do this.
| strategy | source star type | detection efficiency |
|---|---|---|
| I | giant | 3% |
| A5 MS | 1% | |
| F5 MS | 0% | |
| II | giant | 7% |
| A5 MS | 9% | |
| F5 MS | 1% | |
| III | giant | 41% |
| A5 MS | 52% | |
| F5 MS | 66% |
Note. — Average detection efficiencies of detecting a planet with located in the lensing zone of under three different observational strategies. The individual strategies imply a survey mode with a monitoring frequency (strategy I), a survey mode with (strategy II), and a survey mode with plus follow-up observations by employing a single large telescope (strategy III), respectively.
4. Improving Planet Detection Efficiency
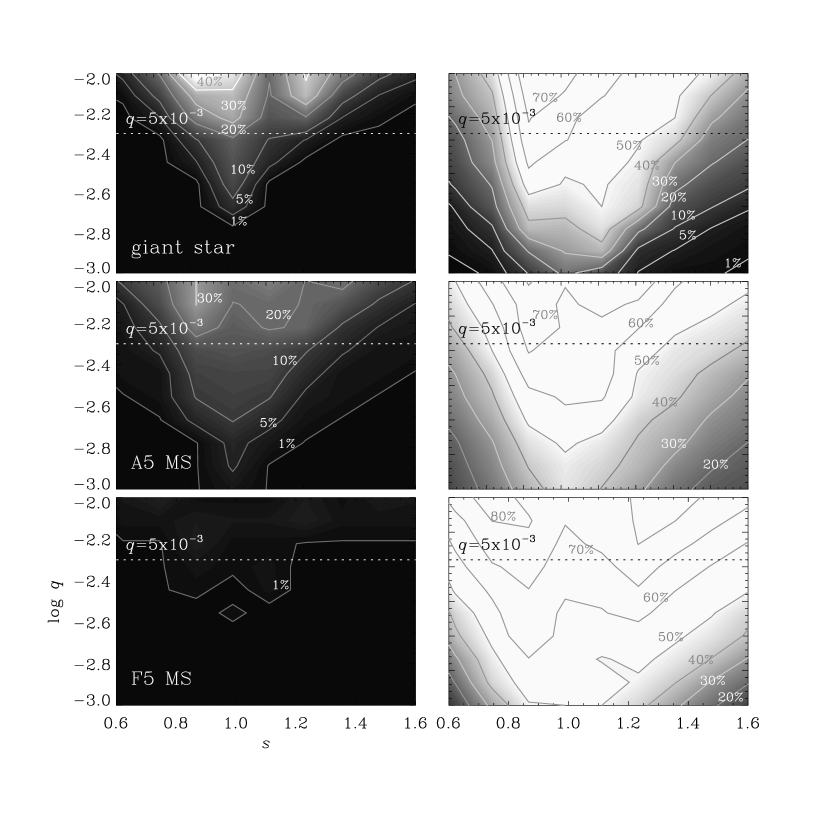
Considering that planetary perturbations, in many cases, are missed from detection due to short durations, a significant improvement in the planet detection efficiency is expected with increased monitoring frequency. One way to do this is using more telescope time or employing more telescopes (‘strategy II’). The other way is conducting follow-up observations for events detected in the early phase by the survey experiment (strategy ‘III’). In this section, we estimate the efficiencies expected under these improved observational strategies. We designate the observational condition of the current pixel-lensing survey (with ) as ‘strategy I’.
We simulate the observations under the strategy II by doubling the monitoring frequency of the current Angstrom experiment, i.e. . For strategy III, we assume survey-mode observations with and follow-up observations with a single 8m-class telescope. Follow-up observations are assumed to be carried out 4 hours after the first pixel-lensing event signal is detected by the survey observations and the assumed monitoring frequency is . Since a single telescope is employed, follow-up observations are assumed to be carried out only during the night (8 hrs per day), and thus 24 min per each combined image. Assuming 20 min per exposure (to allow min for readout), the photometric uncertainty of the follow-up observation is of the survey observation.
In Figure 8, we present the efficiency expected under the two improved observational strategies. In Table 1, we also present the average detection efficiencies of detecting a planet with located in the lensing zone under the three different observational strategies. From the figure and table, we find that significant improvement in efficiency is expected, especially from the adoption of the follow-up observation strategy. The improvement is more significant for events involved with MS stars because the short-duration perturbations associated with these events are readily detectable with the increased monitoring frequency.
5. Conclusion
We explored the feasibility of detecting planets in M31 from a high-frequency pixel-lensing survey using a global network of 2m-class telescopes. For this evaluation, we estimated the efficiency of detecting planetary signals for events induced by planetary systems with various planet/star mass ratios and star-planet separations, associated with source stars of various types, and occurring toward fields with various surface brightness. From the dependence of the detection efficiency on these parameters, we found that 3 detection of the signals produced by giant planets located in the lensing zone with masses equivalent to or heavier than the Jupiter would be possible with detection efficiencies if the event is associated with giant stars. A dramatic improvement of the efficiency is expected if follow-up observations based on real-time survey observations become possible.
References
- Alard & Lupton (1998) Alard, C., & Lupton, R. 1998, ApJ, 503, 325
- An et al. (2004) An, J.H., et al. 2004, ApJ, 601, 845
- Angel (1994) Angel, J. R. P. 1994, Nature, 368, 203
- Ansari et al. (1997) Ansari, R., et al. 1997, A&A, 324, 843
- Ansari et al. (1999) Ansari, R., et al. 1999, A&A, 344, L49
- Aurière et al. (2001) Aurière, M., et al. 2001, ApJ, 553, L137
- Baltz & Gondolo (2001) Baltz, E.A., & Gondolo, P. 2001, ApJ, 559, 41
- Belokurov et al. (2005) Belokurov, V., et al. 2005, MNRAS, 357, 17
- Bennett & Rhie (2002) Bennett, D.P., & Rhie, S.H. 2002, ApJ, 574, 985
- Bennett & Rhie (1996) Bennett, D.P., & Rhie, S.H. 1996, ApJ, 472, 660
- Bond et al. (2004) Bond, I.A., et al. 2004, ApJ, 606, L155
- Calchi Novati, et al. (2002) Calchi Novati, S., et al. 2002, A&A, 381, 848
- Calchi Novati, et al. (2003) Calchi Novati, S., Jetzer, Ph., Scarpetta, G., Giraud-Héraud, Y., Kaplan, J., Paulin-Hendriksson, S., & Gould, A. 2003, A&A, 405, 851
- Covone et al. (2000) Covone, G., de Ritis, R., Dominik, M., & Marino, A.A. 2000, A&A, 357, 810
- Crotts & Tomaney (1996) Crotts, A.P.S., & Tomaney, A.B. 1996, ApJ, 473, L87
- de Jong et al. (2004) de Jong, J.T.A., et al. 2004, A&A, 417, 461
- Gaudi et al. (2002) Gaudi, B.S., et al. 2002, ApJ, 566, 463
- Gould, Gaudi, & Han (2004) Gould, A., Gaudi, B.S., & Han, C. 2004, ApJ, submitted (astro-ph/0405217)
- Gould & Loeb (1992) Gould, A., & Loeb, A. 1992, ApJ, 396, 104
- Han et al. (2005) Han, C., Gaudi, B.S., An, J.H., & Gould, A. 2005, ApJ, 618, 962
- Joshi et al. (2003) Joshi, Y.C., Pandey, A.K., Narasimha, D., & Sagar, R. 2005, Bul. Astro. Soc. India, 31, 41
- Joshi et al. (2005) Joshi, Y.C., Pandey, A.K., Narasimha, D., & Sagar, R. 2005, A&A, 433, 787
- Kerins et al. (2005) Kerins, E., Darnley, M.J., Duke, J.P., Gould, A., Han, C., Jeon, Y.-B., Newsam, A., & Park, B.-G. 2005, MNRAS, in press
- Mao & Paczyński (1991) Mao, S., & Paczyński, B. 1991, ApJ, 374, L37
- Marcy & Butler (1996) Marcy, G. W., & Butler, R. P. 1996, ApJ, 464, L147
- Mayor & Queloz (1995) Mayor, M., & Queloz, D. 1995, Nature, 378, 355
- Melchior et al. (1999) Melchior, A.-L., et al. 1999, A&AS, 134, 377
- Paulin-Hendriksson et al. (2002) Paulin-Hendriksson, S., et al. 2002, ApJ, 576, L121
- Paulin-Hendriksson et al. (2003) Paulin-Hendriksson, S., et al. 2003, A&A, 405, 15
- Perryman (2000) Perryman, M.A.C. 2000, Rep. Prog. Phys., 63, 1209
- Perryman (2005) Perryman, M.A.C., et al. 2005, ESA-ESO Working Groups Report No. 1 (astro-ph/0506163)
- Riffeser et al. (2001) Riffeser, A., et al. 2001, A&A, 379, 362
- Riffeser et al. (2003) Riffeser, A., Fliri, J., Bender, R., Seitz, S., & Gössl, C.A. 2003, ApJ, 599, L17
- Stahl & Sandler (1995) Stahl, S. M., & Sandler, D. G. 1995, ApJ, 454, L153
- Struve (1952) Struve, O. 1952, Observatory, 72, 199
- Udalski et al. (2005) Udalski, A., et al. 2005, ApJ, 628, L109
- Uglesich et al. (2004) Uglesich, R.R., Crotts, A.P.S., Baltz, E.A., de Jong J., Boyle, R.P., & Corbally, G.J. 2004, ApJ, 612, 877
- Wolszczan & Frail (1992) Wolczan, A., & Frail, D. A. 1992, Nature, 355, 145