Isolated, Massive Supergiants near the Galactic Center
Abstract
We have carried out a pilot project to assess the feasibility of using radio, infrared, and X-ray emission to identify young, massive stars located between 1 and 25 pc from the Galactic center. We first compared catalogs compiled from the Very Large Array, the Chandra X-ray Observatory, and 2MASS. We identified two massive, young stars: the previously-identified star that is associated with the radio HII region H2, and a newly-identified star that we refer to as CXOGC J174516.1-290315. The infrared spectra of both stars exhibit very strong Brackett- and He I lines, and resemble those of massive supergiants that have evolved off of the main sequence, but not yet reached the Wolf-Rayet phase. We estimate that each star has a bolometric luminosity . These two stars are also associated with bright mid-infrared sources from the Midcourse Space Experiment survey, although the origin of this emission is uncertain. Likewise, the detection of these two sources in X-rays is surprising, because stars at similar evolutionary states are not uniformly bright X-ray sources. Therefore, we suggest that both stars are in binary systems that contain either OB stars whose winds collide with those of the luminous supergiants, or compact objects that are accreting from the winds of the supergiants. We also identify X-ray emission from a nitrogen-type Wolf-Rayet star and place upper limits on the X-ray luminosities of three more evolved, massive stars that previously have been identified between 1 and 25 pc from Sgr A*. Finally, we briefly discuss the implications that future searches for young stars will have for our understanding of the recent history of star formation near the Galactic center.
Subject headings:
stars: emission-line — Galaxy: center — radio continuum: stars — infrared: stars — X-rays: stars1. Introduction
In contrast to the Galactic Bulge, the inner 300 pc of the Galaxy is experiencing ongoing star formation. This is dramatically displayed by the 60 ultra-compact HII regions in the giant molecular cloud Sgr B2 (de Pree, Goss, & Gaume, 1998), and by three young, dense clusters of massive stars (the Arches, the Quintuplet, and the Central Parsec; e.g., Krabbe et al., 1995; Figer, 1999). The average star formation rate is estimated to be 0.02 yr-1, or 1% of the total Galactic value (Figer et al., 2004). About half of the recent star formation can be accounted for by the three massive star clusters mentioned above, but this implies that the sites of formation for the other half of the young stars in the central 300 pc has not yet been identified. One possibility is that star clusters less massive than the Arches and Quintuplet ( ) have already begun to dissipate, and are difficult to identify against the dense background of older stars near the Galactic center (Portegies-Zwart et al., 2002). Alternatively, a half-dozen relatively isolated HII regions near the Galactic center have been associated with individual young, massive stars (Cotera et al., 1999), which could suggest that stars can also be formed in small associations. Our understanding of how stars form near the Galactic center would be greatly helped by identifying more of the young stars expected to exist there.
We have carried out a radio survey at 8.4 GHz with Very Large Array (VLA) of the region between 3′ and 10′ from the super-massive black hole Sgr A∗, in order to identify counterparts to the 2000 X-ray sources identified using the Chandra X-ray Observatory (Muno et al., 2003a). The general properties of the radio sources detected in this survey will be described elsewhere. Here, we report the properties of two radio and X-ray sources that also had counterparts among the 18,000 stars in the same region from the Two Micron All-Sky Survey (2MASS; §2.1). We identify one, CXOGC J174516.1-290315, as a new emission-line star located 10 pc in projection from the Galactic center. The second is a previously-identified luminous, young star associated with radio HII region H2 (Yusef-Zadeh & Morris, 1987; Zhao et al., 1993; Figer, 1995; Cotera et al., 1999).
We also present an assessment of whether X-ray and radio surveys could be generally effective for identifying luminous young stars (§2.2). We find X-ray emission from two of five massive, emission-line stars that were previously identified through infrared spectroscopy of stars located near HII regions by Cotera et al. (1999) (H2 and a WN6 star associated with SgrA-A), and provide updated positions for all five stars based on the 2MASS catalog. We discuss the origin of the X-ray emission from the young stars in our sample, and the implications that the detection of the new young, massive star has for understanding the star formation history near the Galactic center (§3).
2. Observations
2.1. Radio and X-ray Selected Young Stars
We identified two young stars by comparing a catalog of discrete sources compiled from Very Large Array (VLA) observations at 8.4 GHz (3.6 cm; G. C. Bower et al., in prep) to the Chandra and the 2MASS catalogs. The VLA observations were taken in the B-array during 2002 August. They were sensitive to sources as faint as 250 Jy that were located between 5′ and 10′ of Sgr A∗, although the sensitivity declined to 3 mJy within a few arcminutes of Sgr A∗ because of the bright diffuse radio emission there. The VLA observations identified 30 unresolved sources, and 55 extended sources. The positions of the unresolved sources were accurate to 01.
We searched for X-ray counterparts using the catalog in Muno et al. (2003a). The uncertainties in the positions of the X-ray sources in the Chandra catalog are accurate to 03 at the aim point of the observation (i.e., Sgr A∗), but within 5–10′ from Sgr A∗ the average uncertainty was 1″. Since most of the radio sources were found at larger offsets, we searched for X-ray and radio sources that were located within 1″ in projection. We found two matches between the unresolved radio sources and the X-ray catalog within a radius of 1″. By adding random shifts to the relative alignments of the two catalogs, we determined that 1 of these matches was likely to be spurious. Within the extents of the diffuse VLA sources, we find 5 X-ray counterparts, although three or four should be random associations.
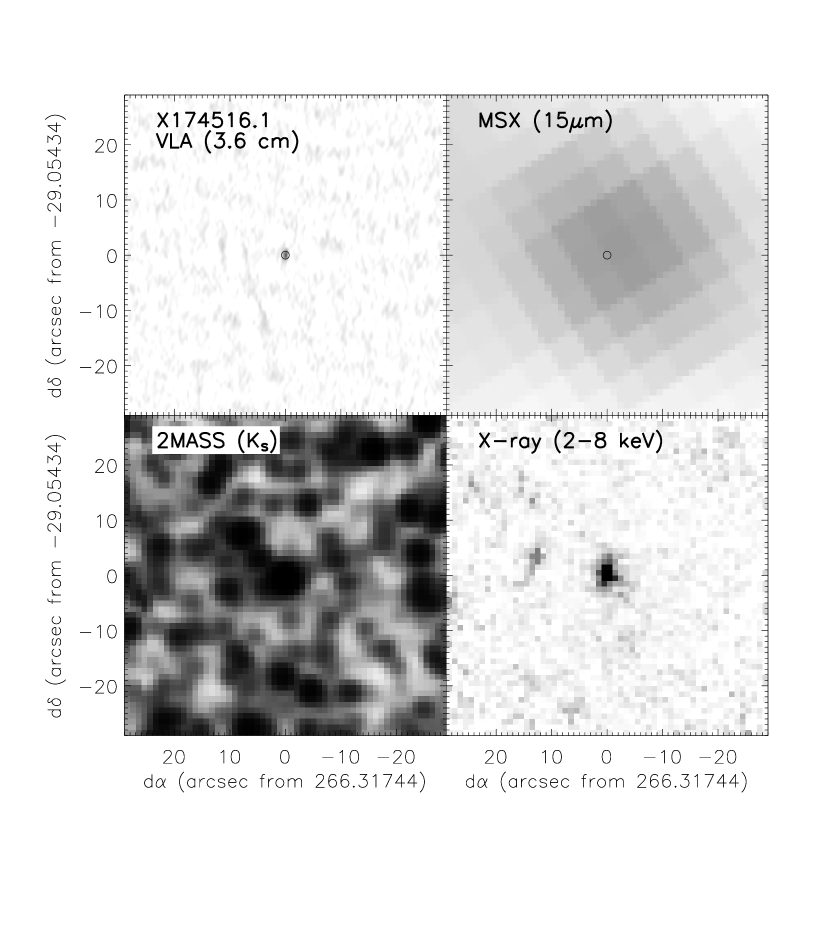
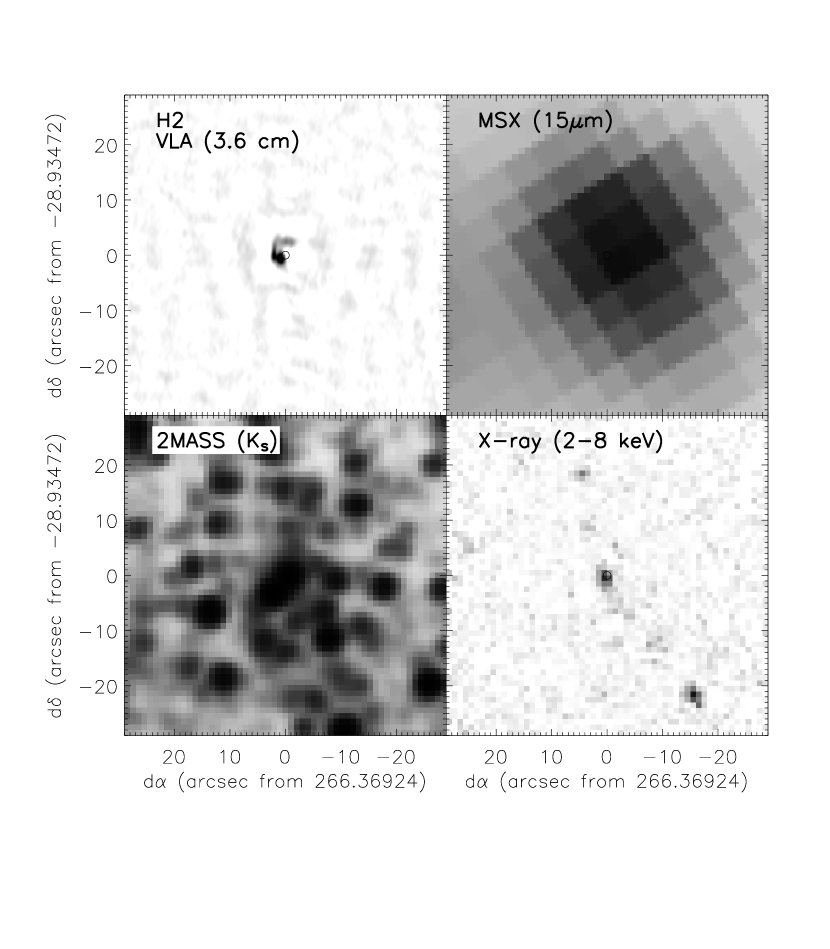
We then compared the locations of the 7 X-ray sources with the 2MASS catalog, and found that 2 had infrared counterparts within 1″ of the X-ray sources: CXOGC J174528.6–285605, which is coincident with a previously-identified young star in the bright (450 mJy at 8.4 GHz), extended radio nebula H2 (Yusef-Zadeh & Morris, 1987; Zhao et al., 1993; Figer, 1995; Cotera et al., 1999), and the new source CXOGC J174516.1-290315 (hereafter referred to as X174516.1), which is associated with a 2.30.3 mJy unresolved radio source. The chance that one of these radio and X-ray sources randomly would have a 2MASS counterpart within 1″ is 15%; if we restrict ourselves to 2MASS sources with 10, the chance is 4%. The locations and magnitudes of the 2MASS counterparts are listed in Table 1, and radio, infrared, and X-ray images of the sources are displayed in Figures 1 and 2.
| Name | ra | dec | Offset | Net | Bkgd. | |||
|---|---|---|---|---|---|---|---|---|
| (J2000) | (arcmin) | X-ray Counts | ||||||
| X174516.1 | 266.31744 | –29.05434 | 5.9 | 11.490.02 | 9.120.03 | 7.890.02 | 70631 | 170 4 |
| H2 | 266.36924 | –28.93472 | 5.0 | 14.3 | 11.260.03 | 9.220.03 | 20118 | 86 2 |
| H8 | 266.40761 | –28.95448 | 3.2 | 15.60.1 | 12.300.08 | 10.300.05 | 17 | 52 1 |
| H5 | 266.41381 | –28.88923 | 7.1 | 14.730.04 | 11.680.04 | 10.190.05 | 27 | 257 7 |
| SgrA-A | 266.46089 | –28.98879 | 2.6 | 15.590.07 | 12.450.02 | 10.900.03 | 5212 | 80 2 |
| SgrA-D | 266.46477 | –29.00643 | 2.5 | 17.6 | 15.1 | 11.200.04 | 19 | 53 1 |
Note. — Positions are accurate to 03. The offset is relative to Sgr A∗. Uncertainties on the infrared magnitudes are provided where they are available from the 2MASS catalog.
| Transition | Centroid | EW (Å) | |
|---|---|---|---|
| (m) | X174516.1 | H2 | |
| He I | 2.058 | 331 | 5.00.3 |
| He I | |||
| + He I | 2.115 | 1.80.6 | 6.90.6 |
| + N III/ C III 8–7 | |||
| Mg II | 2.142 | 2.00.7 | 1.9 |
| H I 7–4 | |||
| + He I | 2.167 | 251 | 22.50.3 |
| + He I | |||
Note. — The spectra were taken with =150, so at 2 m the resolution is 0.01 m.
To determine the nature of the infrared counterparts, we obtained low-resolution (=150) infrared spectra with SpeX on the Infrared Telescope Facility (IRTF; Figure 3; Rayner et al., 2003). The spectra were taken on 2004 September 6 (UT). The weather was clear, with 07 seeing at . The acquisition and reduction of the spectra was carried out as described in Burgasser et al. (2004). To account for background emission, a spectrum was extracted from an adjacent region along the slit that did not contain obvious stellar sources, and then subtracted from the source spectrum. The flux values for the spectra were scaled to the 2MASS magnitudes using the filter and optical responses and the atmospheric transmission in Cutri et al. (2003).
Both stars exhibit prominent emission lines (Figure 3). The strong line emission between 1.8 and 2.0 m cannot be resolved into distinct lines in our low-resolution spectrum. The strongest lines are probably from the Brackett series of H (Figer, 1999), but their equivalent widths cannot be measured because it is not possible to determine the shape of the underlying continuum. We can resolve lines from the continuum at wavelengths longer than 2.0 m. In Table 2, we tentatively identify strong lines from He I and H Brackett-, and weaker lines that could be from CIII, NIII, and/or Mg II (see Morris et al., 1996; Figer, 1999). We measured the equivalent widths of the lines by modeling the continuum between 2.1 and 2.4 m as a second order polynomial, and the lines as Gaussians. The equivalent widths also are listed in Table 2. The presence of strong H and He emission lines indicates that both sources are hot, massive stars.
The radio continuum and infrared line emission suggested that there could be significant amounts of warm gas and dust surrounding these young stars (e.g., Clark et al., 2003). We searched for this in the mid-infrared, using version 2.3 of The Midcourse Space Experiment (MSX) Point Source Catalog (Egan et al., 2003). X174516.1 and H2 are the only two sources detected in the X-ray and 2MASS catalogs that also has a counterpart within 15 in the MSX catalog. We find that there is a 15% chance of finding one random association between the three catalogs. H2 is coincident with MSX6C G259.9845+00.0275, and has fluxes of 33, 134, 220, and 490 Jy at 8.3, 12.1, 14.7, and 21.3 m, respectively. X174516.1 is coincident with MSX6C G359.8590+00.0036, and has fluxes of 2, 14, 33, and 102 Jy at 8.3, 12.1, 14.7, and 21.3 m. The fluxes are accurate to 5%, although the angular resolution of MSX was 20″, so the mid-infrared emission may represent a blend of nearby stars.
As we describe in §3, the strength of the X-ray emission from these young stars is a bit surprising. Therefore, in order to determine its origin, we determined the X-ray intensities, spectra, and light curves for each star using the acis_extract routine from the Tools for X-ray Analysis (TARA)111www.astro.psu.edu/xray/docs/TARA/ and CIAO version 3.2. The techniques are described in Muno et al. (2004), and the dates and exposure times for the observations used are listed in Muno et al. (2005). In brief, for each source we extracted source events from within the 90% contour of the point spread function (PSF), and background events using annular regions that excluded known point sources and discrete filamentary features. We list the net and background X-ray counts from each source in Table 1. These values supersede those in Muno et al. (2003a).
We then produced source and background spectra from the event lists, computed the effective area using the CIAO tool mkarf, and obtained the response functions tabulated by Townsley et al. (2002a). The mean fluxes of the sources did not change during the first 85% the exposure taken through 2003 June (Muno et al., 2004, although see below), so we used summed spectra for each source. We modeled the spectra using XSPEC version 11.3.1 (Arnaud et al., 1996) as a thermal plasma (Mewe, Lemen, & van den Oord, 1986) absorbed by interstellar gas and dust. The free parameters in this model were the column of interstellar gas (), the plasma temperature () and normalization (proportional to the emission measure ). The optical depth of dust was set to , and the halo area to 100 times that of the PSF (Baganoff et al., 2003). The best-fit spectral parameters and derived luminosities for the two detected sources are listed in Table 3, and the spectra are displayed in Figure 4.


Finally, massive stars, particularly those in binaries, are often variable X-ray sources. Therefore, we examined whether X-ray light curves for H2 and X174516.1 were consistent with a constant mean flux using Kolgomorv-Smirnov (K-S) and tests. The photon flux from X174516.1 increased by a factor of 3 from ph cm-2 s-1 between 1999 and 2003 to ph cm-2 s-1 during 2004 July. The probability that this increase in flux resulted from a constant flux was under a test. We find no evidence that the hardness of the spectrum varied during the outburst. We defined a hardness ratio using as the number of counts in the 0.5–3.0 keV band, and as the counts in the 3.0–8.0 keV band. The average hardness from 1999 through 2003 was 0.020.06, while that during 2004 July was 0.010.09, so there is no evidence for spectral variations coincident with the increase in flux. On shorter time scales, there appears to have been a flare near or before the start of the observation on 2004 July 6, which decayed with a time scale of 1 hr. During that observation, the chance that the data were produced by a constant flux was 0.3% according to a K-S test.
| Infrared | Norm | |||||
|---|---|---|---|---|---|---|
| ID | ( cm-2) | (keV) | (erg cm-2 s-1) | (erg s-1) | ||
| H2 | 11/11 | |||||
| SgrA-A | 6.0aaParameter fixed because there were few counts from this source. | 5/4 | ||||
| X174516.1 | 4.7 | 1.3 | 50/37 |
Note. — The fluxes and luminosities are quoted for the 0.5–8.0 keV band. However, as a result of the high extinction toward the Galactic Center, most of the observed flux is detected between 2 and 8 keV. The luminosities in this band are factors of 2–4 below those in the table.
The X-ray light curve from H2 has a 30% chance of being produced by a constant mean flux under both tests. However, because the count rate from H2 is lower than that from X174516.1, we cannot exclude the hypothesis that a flux variation with a factor of 3 amplitude occurred between 1999 and 2004.
2.2. X-ray Counterparts to Known Emission-Line Stars
After realizing that H2 had been previously identified as a young star, we returned to previous searches for such stars to determine if others were also strong X-ray sources. For the purposes of this paper, we are interested in relatively isolated stars,222The X-ray properties of the stars in the central parsec will be reported in a future publication. so we searched for X-ray counterparts to the four emission-line stars (besides H2) in Cotera et al. (1999). We first compared the locations and magnitudes of the Cotera et al. (1999) stars to the 2MASS catalog in order to refine their locations. We found that the published positions of the stars disagreed with their 2MASS counterparts by 1–3″. Therefore, we report updated positions and the magnitudes of the emission-line stars in Table 1. Using the updated positions, we found that one more of the remaining four emission-line stars has an X-ray counterpart in our Chandra image within the 05 uncertainty of the X-ray catalog: the WN6 star SgrA-A.333We note that the inaccurate positions in Cotera et al. (1999) led us to report initially that none had counterparts (Muno et al., 2004). This star was not detected in our radio and X-ray comparison (§2.1), because the infrared and X-ray sources are significantly offset from the nearby radio HII region. We have displayed images of SgrA-A in Figure 5.
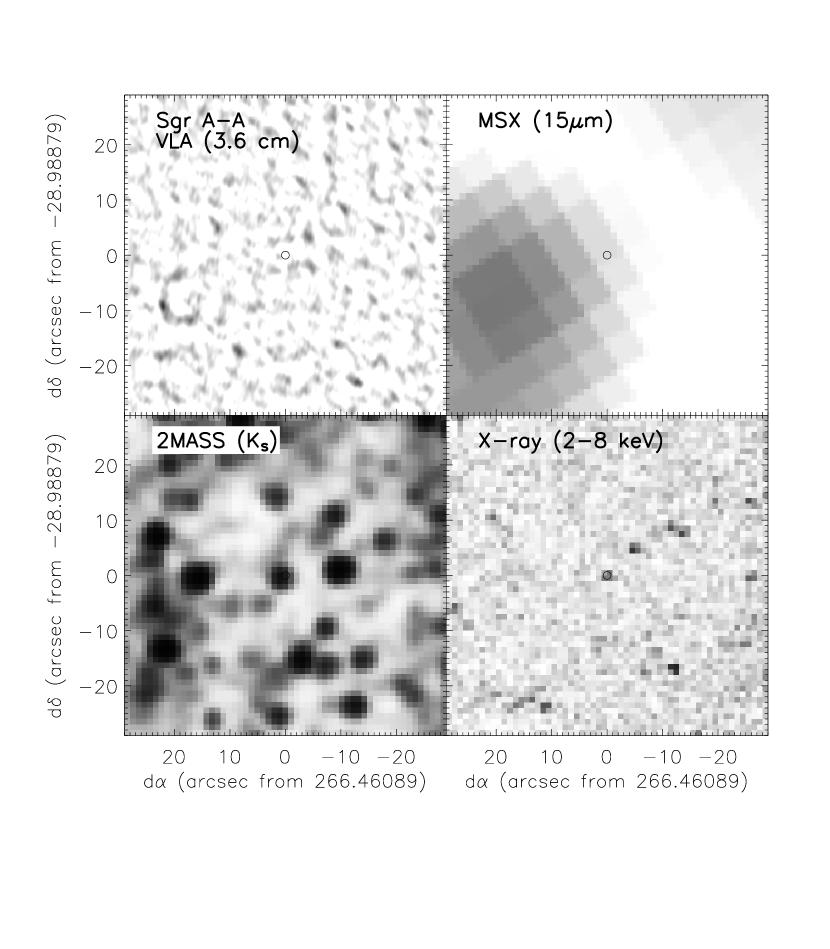
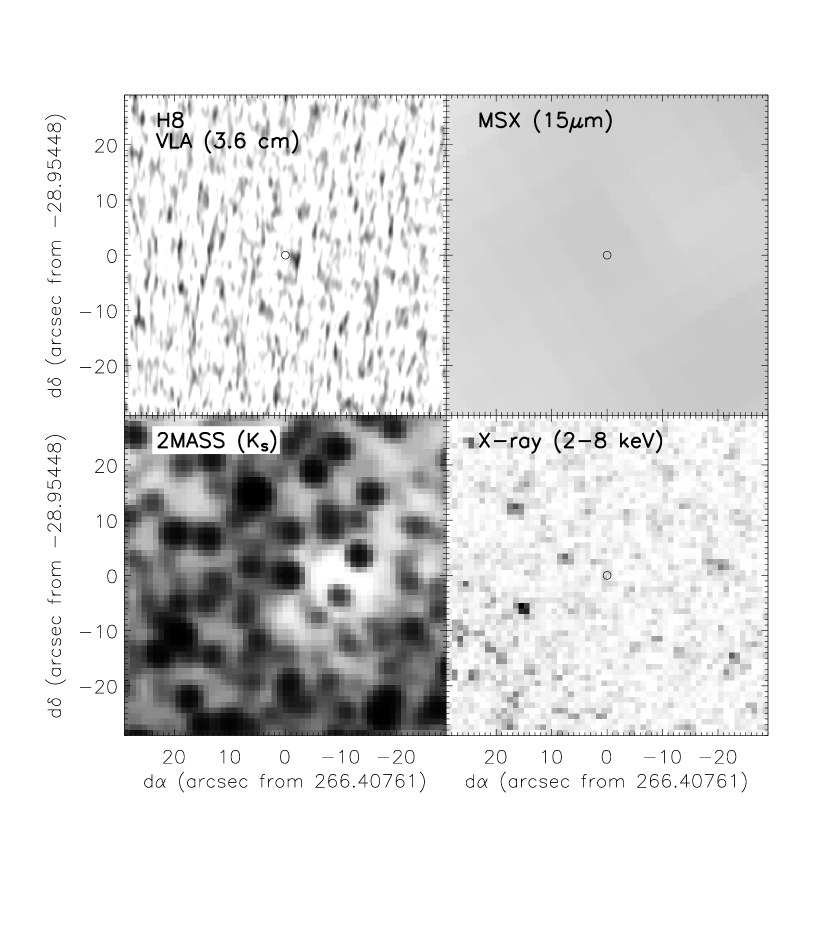
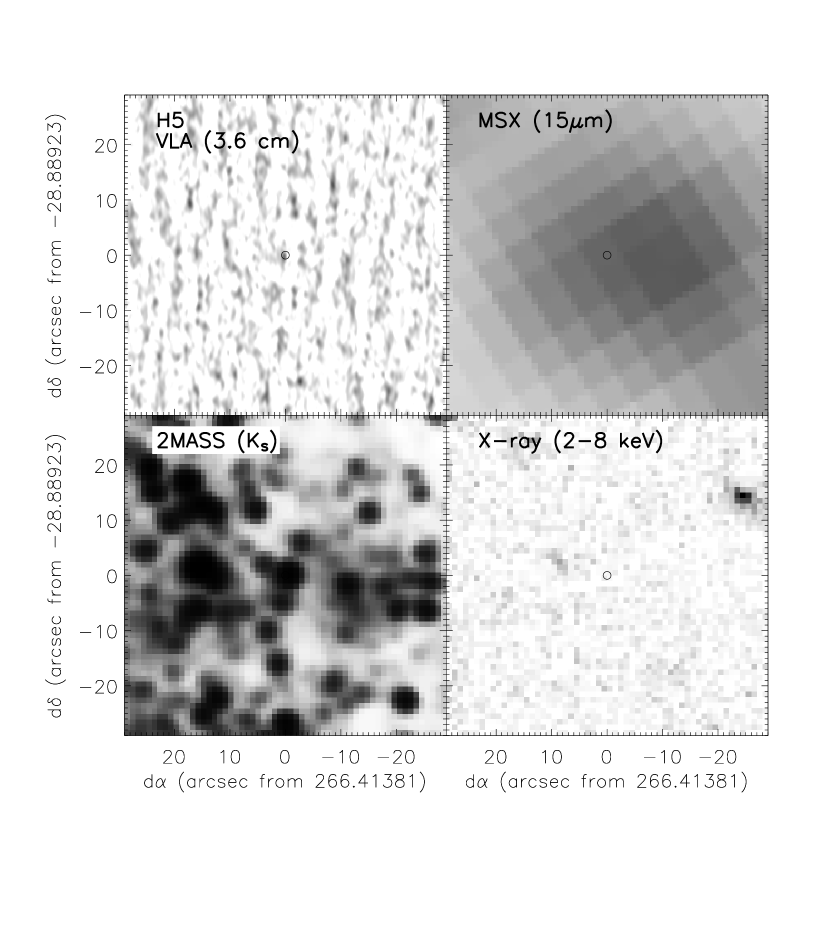
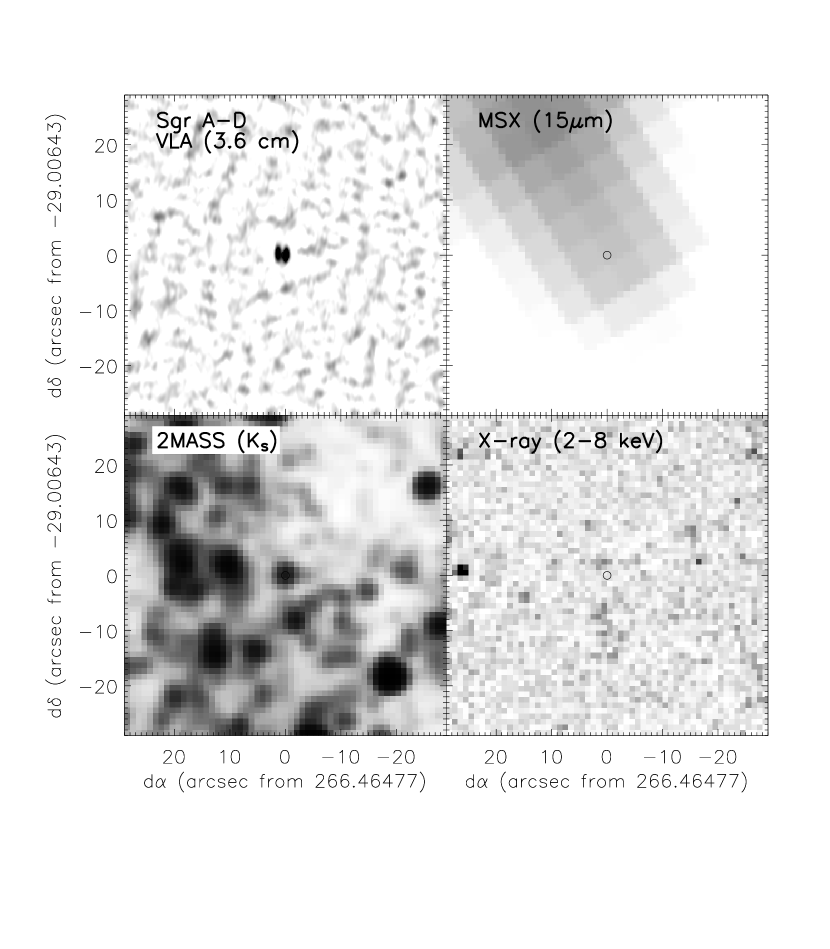
We analyzed the X-ray emission from each of the four stars in the same manner as in §2.2, and list their properties in Table 3. For the three non-detections from Cotera et al. (1999), we computed limits on their count rates by extracting events from the 2MASS positions (Table 1). The limits on their luminosities for a 1 keV thermal plasma spectrum are erg s-1, and for a 0.5 keV plasma are erg s-1. Images of the stars not detected in X-rays are displayed in Figures 6–8.
3. Discussion
We have searched for X-ray emission from young stars located between 3–23 pc in projection from Sgr A∗, and we have detected 2 of 5 known isolated, young stars (Cotera et al., 1999), and identified one new example. The stars that we detected in our Chandra image are exceptional. The star associated with the SgrA-A HII region is the only Wolf-Rayet star (spectral type WN6) in the sample of Cotera et al. (1999). Nitrogen-rich Wolf-Rayet stars (WN) produce very fast winds ( km s-1, which produce strong X-ray emitting shocks. About 75% of WN stars have erg s-1 (Wessolowski, 1996), so the detection of the SgrA-A WN6 star is not surprising (Table 3).
The two most luminous X-ray sources, X174516.1 and H2, are the brightest infrared sources in Table 1. We compared their spectra (Fig. 3) to those of the Pistol star (Figer et al., 1998) and to the atlases of Morris et al. (1996) and Hanson, Conti, & Rieke (1996).. Our low-resolution spectra cannot be used to classify stars with the detail achievable with high-resultion optical spectra. However, the line emission from Br-, He I, and Mg II in Figure 3 resembles that from the Pistol star and other B[e] supergiants, Of stars, and LBVs. All of these spectral types represent massive stars that have evolved off of the main sequence, but not yet reached the Wolf-Rayet phase, so the similarities are understandable. For H2, our results match the conclusions of Figer (1995) and Cotera et al. (1999).
Our suggestion that these stars are B[e], Of, or LBV stars suggests that they are unusually luminous. To confirm this, we estimate the intrinsic colors and luminosities of X174516.1 and H2 as follows. First, we assume that they lie near the Galactic center (8 kpc), because (1) the interstellar absorption columns that we measure from their X-ray spectra (Table 3) are quite similar to the value toward Sgr A∗, cm-2, and (2) if we ignore the heavily-absorbed half of the Galaxy more distant than 10 kpc, % of the Galactic stellar mass along this line-of-sight is located within 200 pc of the Galactic center (Launhardt et al., 2002). The distance modulus is therefore 14.5. Second, we estimate the reddening using the relationship from Predehl & Schmitt (1995), and the extinction law from from Moneti (2001). For X174516.1, taking cm-2, we find , and . Its intrinsic color is , and absolute . For H2, cm-2, we find , and . Its intrinsic color is , and . In both cases, the colors are within 1 of expected for O supergiant stars (Wegner, 1994). However, the colors are inconsistent with the infrared excesses seen from B[e] stars in the Magellanic clouds (Zickgraf et al., 1986). Therefore, we tentatively classify X174516.1 and H2 as either Of or candidate LBV stars.
We estimate the bolometric luminosities of these stars by assuming that they have temperatures comparable to those of the Pistol star and other hot, massive stars in transition, K (Morris et al., 1996; Figer et al., 1998; Clark et al., 2003). The bolometric corrections to the absolute magnitudes will then be given by (Blum, DePoy, & Sellgren, 1995), so that . Therefore, we find upper limits on the bolometric magnitudes for X174516.1 of , and for H2 of . We converted these to lower limits on the luminosities (listed in Table 3.1), and find for X174516.1 that , and for H2 that . Their true luminosities may be significantly higher. For example, assuming =30,000 K, as would be appropriate for an Of star, the bolometric luminosity would be a factor of 7 higher.
3.1. Radio, Mid-Infrared, and X-ray Emission
Although X174516.1 and H2 are very luminous stars, it is nonetheless surprising that they are so bright in the radio, mid-infrared, and X-rays. Free-free emission in the winds of massive, evolving stars stars should make them mJy radio sources from the distance to the Galactic center (e.g., Scuderi et al., 1998; Duncan & White, 2002). The point-like radio source consistent with X174516.1 is consistent with a stellar wind. We can estimate the required mass-loss rate by inverting Eq. 4 in Scuderi et al. (1998):
If we assume the electron temperature in units of K is , the mean atomic weight per free electron is , and the terminal velocity of the wind is km s-1 as appropriate for an LBV (e.g., P Cyg in Scuderi et al., 1998), then mJy implies yr-1. This is similar to the mass loss rates observed for LBVs (see also, e.g., Clark et al., 2003). A higher velocity of km s-1, as appropriate for an Of star, would imply a mass loss rate yr-1. This rate is much higher than is typically seen from Of stars (Scuderi et al., 1998). However, that we have not measured the radio spectral index of X174516.1, so it is possible that most of the flux is non-thermal, the above mass-loss rates are upper limits. To determine the nature of the radio emission from X174516.1, either the radio spectral index must be measured, or the mass-loss rate must be obtained from a high-resolution infrared spectrum.
The radio flux of the extended nebula around H2 is orders of magnitude too bright to be produced by its stellar wind. Zhao et al. (1993) model it as an unusually dense ( cm-3) HII region illuminated by a Lyman continuum flux equivalent to that of an O7 zero-age main sequence star.
The detection of both stars in the MSX mid-infrared survey demonstrates that they are surrounded by warm gas and dust. Egan et al. (2002) and Clark et al. (2003) have identified dusty ring nebulae around several known and candidate LBV stars, and hypothesize that they were produced by past episodes of rapid mass loss. Surprisingly, the mid-infrared counterparts to our Galactic center stars are 10 and 100 times more luminous at 14.7 and 21.3 m, respectively, than the nebulae around the other candidate LBVs. Therefore, we suspect either that the mid-infrared flux near X174516.1 and H2 represents interstellar dust, or that it is the unresolved emission from several massive, dusty stars. Observations with the Spitzer Space Telescope should resolve this issue.
The detection of X174516.1 and H2 with Chandra is particularly intriguing because Of and LBV stars are not always bright X-ray sources. In Table 3.1, we tabulate the values of for several of the massive stars listed in Morris et al. (1996) and Figer (1999). The measurements of were taken with instruments sensitive to different energy ranges, so some caution should be used in comparing the results, as described in the notes to the table. In general, we have extrapolated the fluxes using conservative assumptions that serve to lessen the dispersion in . Therefore, we expect the range in these values is not caused by selection effects, but represents intrinsic differences in the efficiency of X-ray production in these sources. We find that there is at least a factor of 3000 range in the values, and that the scatter is not correlated with spectral type. The LBV Car and the O6 f star HD 108 lie near the X-ray-bright end of the distribution with and , respectively. The LBV P Cyg and the O4.5 If star HD 190429 lie at the faint end with .
| Star | Type | Ref. | |||
|---|---|---|---|---|---|
| (log erg s-1) | (log) | ||||
| X174516.1 | 39.7 | 33.3 | –6.4 | 1 | |
| H2 | 39.5 | 33.1 | –6.4 | 1 | |
| P Cyg | LBV | 39.5 | 31.0aaThe luminosities are reported in the ROSAT 0.1-2.0 keV band for these sources. For direct comparison with the other sources, one would want to use the 0.5–8.0 keV luminosity, which will in general be a factor of 10 smaller. | –8.5 | 2,3 |
| Car | LBV | 40.1 | 34.8 | –5.3 | 2,4 |
| Pistol | LBVc | 40.2 | 32.0bbWe derived an upper limit to the X-ray luminosity for the Pistol star using archival Chandra data, in the same manner as we did for the other stars in our survey. | –8.2 | 1,5 |
| HD 108 | O6 f | 39.2 | 33.0 | –6.2 | 6 |
| HD 190429 | 04.5 If+ | 39.7 | 31.1a,ca,cfootnotemark: | –8.6 | 7,8,9 |
| HD 152408 | O8:Iafpe | 39.4 | 31.7aaThe luminosities are reported in the ROSAT 0.1-2.0 keV band for these sources. For direct comparison with the other sources, one would want to use the 0.5–8.0 keV luminosity, which will in general be a factor of 10 smaller. | –7.7 | 7,10 |
| HD 151804 | O8Iaf | 39.7 | 31.9a,ca,cfootnotemark: | –7.8 | 7,11,12 |
Note. — The bolometric luminosities for the two sources in this work are estimated by assuming values for the extinction and for the bolometric correction for each star, as described in the text. The X-ray luminosties are extrapolated from the observed values into the 0.5-8.0 keV band, except where indicated. The 0.5–8.0 keV luminosities of massive stars are usually dominated by keV plasma that would be undetectable through the absorption toward the Galactic center; at most 10% of should be produced by hotter 1 keV plamsa. Therefore, both luminosity values are uncertain by roughly an order of magnitude.
References. — (1) This work; (2) Humphreys & Davidson (1994); (3) Berghöfer & Wendker (2000); (4) Seward et al. (2001); (5) Figer (1999); (6) Nazé et al. (2004); (7) Morris et al. (1996); (8) Scuderi et al. (1998); (9) Voges et al. (1999); (10) Berghöfer et al. (1996); (11) ROSAT PSPC Pointed Observations catalog; (12) Lamers & Leitherer (1993).
X174516.1 and H2 lie at the high end of the scatter in in Table 3.1, which raises the question of why they are so bright in X-rays. There are several possible explanations. One is that the X-ray emitting shocks form at varying optical depths within the winds of massive stars, so that in some cases the X-ray emission is absorbed before it can reach the observer. This has been proposed to explain why Carbon-type WR stars are faint X-ray sources, whereas Nitrogen-type WR stars are bright in X-rays (Oskinova et al., 2003). However, changes in the optical depth of the wind from X174516.1 are unlikely to explain the X-ray flare observed in 2004 July (§2.1). Alternatively, the X-rays from X174516.1 and H2 could be produced when their winds collide with those of fainter companions. For instance, it has been proposed that the high X-ray luminosity of Car is produced because it is a binary, and one of the components has a fast, km s-1 wind that collides with the slow, dense wind of its companion (Seward et al., 2001). Finally, these stars could have black hole or neutron star companions that produce X-rays as they accrete from the wind of the supergiant. This would make X174516.1 and H2 analogous to faint high-mass X-ray binaries such as A 0535+26 and X Per, which have similar X-ray spectra and luminosities (Di Salvo et al., 1998; Orlandini et al., 2004), and exhibit prominent He I and Br- emission in their spectra (Hanson et al., 1996). Both colliding-wind binaries and accreting compact objects exhibit X-ray flares similar to that seen from X174516.1. Further high-resolution spectroscopic observations will allow us to model the winds from X174516.1 and H2, and to search for evidence for binary companions.
Given the scatter in in Table 3.1, it is not surprising that we did not detect X-ray emission from the remaining three stars from Cotera et al. (1999). The spectra from Cotera et al. (1999) suggest that these stars are all in similar evolutionary states as X174516.1 and H2. If we make similar assumptions to compute their , we find that the remaining stars are a only factor of a few less luminous than X174516.1 and H2. However, if we assume that they are producing X-rays with characteristic temperatures of 0.5 keV, then most of the X-ray emission would be undetectable through the absorption toward the Galactic center, and from the upper limits in §2.1 we find . These limits are not particularly interesting in the context of X-ray emission from massive stars. Nonetheless, we can confidently state these stars are at least an order of magnitude fainter than X174516.1 and H2 in the observable 2–8 keV band (Table 1), which highlights the oddity of the latter two sources.
3.2. Implications for Star Formation
Hot, post-main sequence Wolf-Rayet, B[e], Of, and LBV stars similar to those in Table 1 are thought to have initial masses of (Zickgraf et al., 1986; Figer et al., 1998), and ages of only a few million years. As a result, such stars are excellent tracers of recent star formation.
Surprisingly, unlike the Pistol star and the massive stars in the central parsec around Sgr A∗ (Figer et al., 1998; Paumard et al., 2003), none of the stars in Table 1 are associated with any known young star cluster. However, clusters less massive than the Arches and Quintuplet would be difficult to identify against the dense background of stars in the Galactic center using previous wide-field infrared surveys like 2MASS (Portegies-Zwart et al., 2002). Therefore, it is important to carry out photometric and narrow-line surveys to search for other young stars in the vicinity of H2 and X174516.1, to establish whether they are in fact isolated.
If they are isolated, then there are two possible explanations. First, it has been suggested that the young stars in the central parsec are the remnants of a cluster that was formed 10 pc from Sgr A∗ and settled into the Galactic center (Gerhard et al., 2001), and stars like H2 and X174516.1 could have been stripped from this hypothetical cluster. If this is the case, then hundreds of other young stars still await discovery in the central 10 parsecs around Sgr A∗ (e.g., Portegies Zwart et al., 2003; Kim & Morris, 2003). Alternatively, these massive, young stars may well have formed in isolation, as has been proposed by Cotera et al. (1999). This hypothesis would imply that stars form in associations that have masses ranging from 100 to . Such a conclusion would be surprising, since the high turbulent velocities of molecular clouds, the large tidal forces produced by Sgr A∗ and the surrounding stellar cusp, and possibly mG magnetic fields concentrated near the Galactic center by in-falling material should collude to make the Jeans mass closer to the upper end of this range (Morris, 1993).
References
- Arnaud et al. (1996) Arnaud, K.A., 1996, Astronomical Data Analysis Software and Systems V, eds. Jacoby G. and Barnes J., p17, ASP Conf. Series volume 101
- Baganoff et al. (2003) Baganoff, F. K. et al. 2003, ApJ, 591, 891
- Berghöfer et al. (1996) Berghöfer, T. W., Schmitt, J. H. M. M., & Cassinelli, J. P. 1996, A&AS, 118, 481
- Berghöfer & Wendker (2000) Berghöfer, T. W. & Wendker, H. J. 2000, Astron. Nachr, 321, 249
- Blum, DePoy, & Sellgren (1995) Blum, R. D., DePoy, D. L., & Sellgren, K. 1995, ApJ, 441, 603
- Burgasser et al. (2004) Burgasser, A. J., McElwain, M. W., Kirkpatrick, J. D., Cruz, K. L., Tinney, C. G., & Reid, I. N. 2004, AJ, 127, 2856
- Clark et al. (2003) Clark, J. S., Egan, M. P., Crowther, P. A., Mizuno, D.R., Larionov, V. M., & Arkharov, A. 2003, A&A, 412, 185
- Cotera et al. (1999) Cotera, A. S., Simpson, J. P., Erickson, E. F., Colgan, S. W. J., Burton, M. G., & Allen, D. A. 1999, ApJ, 510, 747
- de Pree, Goss, & Gaume (1998) de Pree, C. G., Goss, W. M., & Gaume, R. A. 1997, ApJ, 489, 143
- Cutri et al. (2003) Cutri, R. M. et al. 2003, “Explanatory Supplement to the 2MASS All Sky Data Release”
- Di Salvo et al. (1998) Di Salvo, T., Burderi, L., Robba, N. R. & Guainazzi, M. 1998, ApJ, 509, 897
- Duncan & White (2002) Duncan, R. A. & White, S. M. 2002, MNRAS, 330, 63
- Egan et al. (2002) Egan, M. P., Clark, J. S., Mizuno, D. R., Carey, S. J., Steele, I. A., & Price, S. D. 2002, ApJ, 572, 288
- Egan et al. (2003) Egan, M. P. et al. 2003, Air Force Research Laboratory Technical Report AFRL-VS-TR-2003-1589
- Figer (1995) Figer, D. F. 1995, UCLA Ph.D. Thesis
- Figer et al. (1998) Figer, D. F., Najarro, F., Morris, M., McLean, I. S., Geballe, T. R., Ghez, A. M., & Langer. N. 1998, ApJ, 506, 384
- Figer (1999) Figer, D. F., Kim, S. S., Morris, M., Serabyn, E., Rich, R. M., & McLean, I. A. 1999, ApJ, 525, 750
- Figer et al. (2004) Figer, D. F. et al. 2004, ApJ, 601, 319
- Gerhard et al. (2001) Gerhard, O. 2001, ApJ, 546, L39
- Hanson et al. (1996) Hanson, M. M., Conti, P. S., & Reike, M. J. 1996, ApJS, 107, 281
- Humphreys & Davidson (1994) Humphreys, R. M. & Davidson, K. 1994, PASP, 106, 1025
- Kim & Morris (2003) Kim, S. S. & Morris, M. 2003, ApJ, 597, 312
- Krabbe et al. (1995) Krabbe, A. et al. 1995, ApJ, 447, L95
- Lamers & Leitherer (1993) Lamers, H. J. G. L. M. & Leitherer, C. 1993, ApJ, 412, 771
- Launhardt et al. (2002) Launhardt, R., Zylka, R., & Mezger, P. G. 2002, A&A, 384, 112
- Mewe, Lemen, & van den Oord (1986) Mewe, R., Lemen, J. R., & van den Oord, G. H. J. 1986, A&AS, 65, 511
- Moneti (2001) Moneti, A., Stolovy, S., Blommaert, J. A. D. L., Figer, D. F., & Najarro, F. 2001, A&A, 366, 106
- Morris (1993) Morris, M. 1993, ApJ, 408, 496
- Morris et al. (1996) Morris, P. W., Eenens, P. R. J., Hanson, M. M., Conti, P. S., & Blum, R. D. 1996, ApJ, 470, 597
- Muno et al. (2003a) Muno, M. P. et al. 2003a, ApJ, 589, 225
- Muno et al. (2004) Muno, M. P. et al. 2004, ApJ, 613, 1179
- Muno et al. (2005) Muno, M. P., Lu, J. R., Baganoff, F. K., Brandt, W. N., Garmire, G. P., Ghez, A. M., Hornstein, S. D., & Morris, M. R. 2005, submitted to ApJ, astro-ph/0503572
- Nazé et al. (2004) Nazé, Y., Rauw, G., Vreux, J.-M., & De Becker, M. 2004, A&A, 417, 667
- Orlandini et al. (2004) Orlandini, M. et al. 2004, Nucl. Phys. B (suppl), 132, 476
- Oskinova et al. (2003) Oskinova, L. M., Ignace, R., Hamann, W.-R., Pollock, A. M. T., & Brown, J. C. 2003, A&A, 402, 755
- Paumard et al. (2003) Paumard, T., Maillard, J.-P., & Stolovy, S. 2003, ANS, 324, 303
- Portegies-Zwart et al. (2002) Portegies-Zwart, S. F. et al. 2002, ApJ, 656, 265
- Portegies Zwart et al. (2003) Portegies Zwart, S. F., McMillan, S. L. W., & Gerhard, O. 2003, ApJ, 593, 352
- Predehl & Schmitt (1995) Predehl, P. & Schmitt, J. H. M. M. 1995, A&A, 293, 889
- Rayner et al. (2003) Rayner, J. T., Toomey, D. W., Onaka, P. M., Denault, A. J., Stahlberger, W. E., Vacca, W. D., Cushing, M. C., & Wang, S. 2003, PASP, 155, 362
- Scuderi et al. (1998) Scuderi, S., Panagia, N., Stanghellini, C., Trigilio, C., & Umana G. 1998, A&A, 332, 251
- Seward et al. (2001) Seward, F. D., Butt, Y. M., Karovska, M., Prestwich, A., Shclegel, E. M., & Corcoran, M. 2001, ApJ, 553, 832
- Townsley et al. (2002a) Townsley, L. K. et al., 2002a, NIM-A, 486, 716
- Voges et al. (1999) Voges, W. et al. 1999, A&A, 349, 389
- Weisskopf et al. (2002) Weisskopf, M. C., Brinkman, B., Canizares, C., Garmire, G., Murray, S., & van Speybroeck, L. P. 2002, PASP, 114, 1
- Wegner (1994) Wegner, W. 1994, MNRAS, 270, 229
- Wessolowski (1996) Wessolowski, U. 1996, MPE Report 263
- Yusef-Zadeh & Morris (1987) Yusef-Zadeh, F. & Morris, M. 1987, ApJ, 320, 545
- Zhao et al. (1993) Zhao, J.-H., Desai, K., Goss, W. M., & Yusef-Zadeh, F. 1993, ApJ, 418, 235
- Zickgraf et al. (1986) Zickgraf, F.-J., Wolf, B., Stahl, O., Leitherer, C., & Appenzeller, I. 1986, A&A, 163, 119