1–
Spectroscopic Studies of and Galaxies: Implications for Reionization
Abstract
The recent development of large, complete samples which identify high-redshift galaxies at and from deep, wide-field surveys provides detailed information on the earliest galaxies, their numbers, spatial and kinematic distributions, and implications for early reionization of the IGM. In this contribution we present results of spectroscopic studies of and galaxies identified from our deep, Lyman alpha narrowband and multicolor surveys conducted with the SuprimeCam mosaic CCD camera on the 8.3-m Subaru telescope and observed with the DEIMOS multi-object spectrograph on Keck. The luminosity function of the galaxies is shown to be similar to the luminosity function of the galaxy samples, suggesting that a substantial star-forming population is already in place at . Comparisons of both individual and stacked spectra of galaxies in these two samples show that the Lyman alpha emission profiles, equivalent widths, and continuum break strengths do not substantially change over this redshift interval. The wide-field nature of the surveys also permits mapping the large-scale distribution of the high-redshift galaxies in spatial structures extending across individual SuprimeCam fields ( Mpc). Field-to-field variations in the number of objects at may shortly be able to place constraints on the porosity of the reionization boundary.
keywords:
cosmology: observations — early universe — galaxies: distances and redshifts — galaxies: evolution — galaxies: formation — galaxies: high-redshift1 Introduction
Substantial progress has been made over the last 5 years in high-redshift galaxy studies (see [Spinrad (2004)] for a review). The significant aspects of recent work carried out since that review are the rapid growth in the numbers of galaxies that populate the high-redshift end of the samples ( and above) and the development of large, spectroscopically complete samples from wide-area surveys for a number of discrete fields (e.g., [Hu et al. (2004)], [Taniguchi et al. (2005)], [Hu et al. (2005)]). These give a handle on the problem of cosmic variance, and also allow us to build up the large samples required for luminosity function studies. Spectroscopic completeness makes it possible to estimate the star-forming population at high redshift, and its evolution. Detailed examination and comparison of the strength and profile shape of the Ly emission line may provide insights to possible changes in the underlying stellar population, or in the neutral hydrogen content of the surrounding intragalactic medium.
2 The Hawaii Wide-Field Narrowband Surveys
The most successful method of identifying galaxies at redshifts beyond , where galaxy continuua are faint against a strong nightsky background, is by using the redshifted Ly emission line. The present surveys were were driven by the development of wide-field, red-sensitive instruments on the large telescopes: the half-degree FOV SuprimeCam mosaic CCD imager (Miyazaki et al. 2002) on the 8.3-m Subaru Telescope, and the wide-field () DEIMOS multi-slit spectrograph and imager on the Keck II 10-m telescope. Narrowband imaging is used in combination with deep multicolor and moderate infrared imaging over the SuprimeCam fields to identify high-redshift galaxies with strong Ly emission and continuum color breaks.
Current investigations use Å bandpass filters centered at 8150Å and 9130Å (Ly at and ) for the narrowband studies, with follow-up DEIMOS spectra (3.6Å resolution, ) at Keck. Survey fields are chosen from half a dozen extensively studied fields: SSA22, GOODS-N, Lockman Hole NW, SSA13, SSA17, and A370. Completed studies at for SSA22 ([Hu et al. (2004)]) show a high success rate in identifying and confirming candidates (19 confirmed of 22 observed), as well as success in discriminating against red stars and identifying/confirming T dwarf candidates ([Kakazu et al. in preparation]). A second study has been completed for the region including the HDF-N and GOODS-N fields ([Hu et al. (2005)]). At present 62 confirmed redshifts at are in hand for 3 fields, with 14 confirmed redshifts (extending to ) for 3 fields.
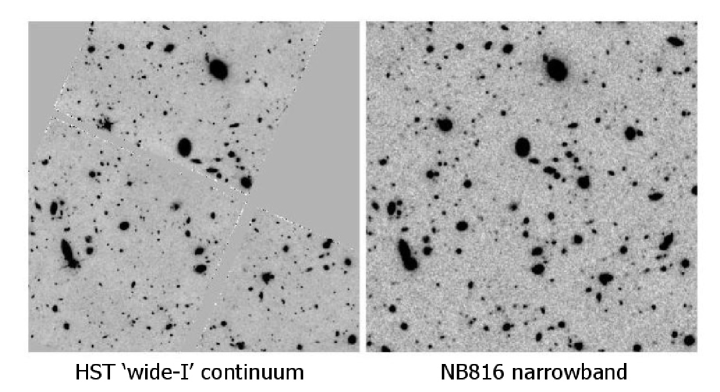
At magnitudes brighter than the number density of such high-redshift galaxies is only a few hundred per square degree and the distribution is highly correlated on sub-degree scales (e.g., Capak 2004). A combination of depth and area coverage is needed for these studies. Figure 1 shows the depth and image quality of the survey’s SuprimeCam narrowband exposures compared to deep HDF continuum images. No galaxies are found in the survey within the HDF-N. Over the larger ACS GOODS-N field (still a sub-region of the SuprimeCam field) only 6 galaxies were found. And none of the sources were found within the region of ACS GOODS-N.
3 Luminosity Functions
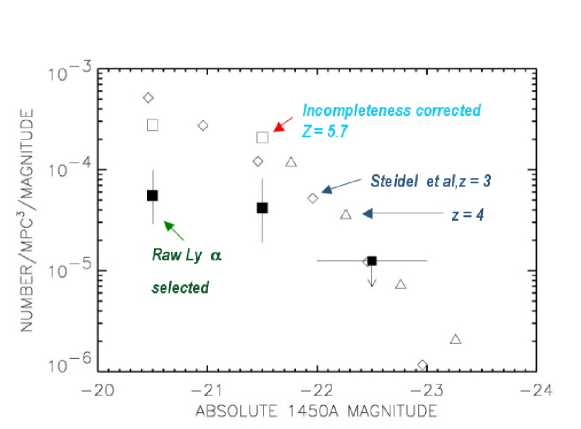
With the high-redshift samples in hand, we can construct luminosity functions at and , and compare these to results at lower redshifts. The most direct comparison is to use the UV continuum luminosities of the Ly-selected samples and compare these with luminosity functions of the Lyman-break galaxies ([Steidel et al. (1999)], [Steidel et al. (2000)]) at redshifts and (Figure 2). This avoids problems of estimating possible dust contamination on the emission line. Here the main uncertainty is how to correct the raw counts for the fractional population with strong Ly emission. If the estimate of [Steidel et al. (2000)] based on the LBGs at with strong Ly is used to assume that the Ly emitters represent only 20% of the star-forming galaxy population at , then the raw numbers for Ly-selected galaxies (filled boxes) are corrected upwards to the open boxes that overlie the and Lyman break galaxy UV continuum luminosity functions, implying there has not been a substantial decrease in the star formation rate out to redshift .
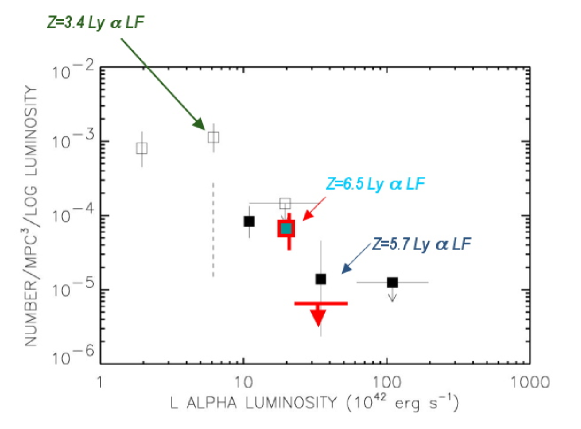
For the sample the longest wavelength deep continuum band ( around 9200 Å) spans the wavelength of Ly emission, making it difficult to estimate the line-free ultraviolet continuum. Here, we compare the Ly luminosity function with the luminosity function of the emission line obtained in narrowband samples at ([Cowie & Hu (1998)], [Hu et al. (1999)]). The results are shown in Figure 3. The points are plotted with open boxes and the points are shown with filled boxes. The vertical dashed line indicates the limits of the sample, which does not reach the flat part of the luminosity function. The filled box and upper limit drawn with heavy bars represent the points for the luminosity function and overlie the luminosity function data. The points are consistent with no marked change in the luminosity function between and as suggested by [Malhotra & Rhoads (2004)], who used a likelihood analysis to merge disparate data samples with varying degrees of incompleteness to compare the two redshift samples. The advantage of the present results lies in the larger and homogeneous samples, and the completeness of identifications.
4 Ly Emission Line Profiles
If reionization occurred at redshifts lower than we should see a major change in the equivalent widths of the Lyman alpha emission line between the sample and the sample since the damping wings of the neutral gas should scatter much of the redward wing of the Lyman alpha lines at the higher redshifts where the intergalactic gas is neutral. We can examine the emission-line profiles in the two samples. Figure 4 shows that the Ly profiles, which have been stacked to improve our sensitivity, are extremely similar. Both profiles show the strong blue asymmetry due to the Ly forest that is characteristic of the very high-redshift galaxies. The profiles have similar equivalent widths and shapes.
Does this provide clear evidence that the epoch of reionization must lie at higher redshifts? Not necessarily. For Ly-emitting galaxies that are sufficiently luminous, self-clearing can complicate their effectiveness as a probe of the surrounding neutral IGM (e.g., [Haiman (2002)]). Even for lower luminosity objects, clustered distributions or neighboring objects may ionize the local region. The samples are still relatively small, and show a surprising amount of field-to-field variation, with 10 of the identified systems coming from the A370 field – coincidentally, the first field with a discovered galaxy ([Hu et al. (2002)]). Preferred (low density) lines of sight could be ionized, and there can be selection biases in our sample. The properties could reflect large-scale structure effects or a porous reionization boundary in both the profile and luminosity function analyses.

5 Large-Scale Structure
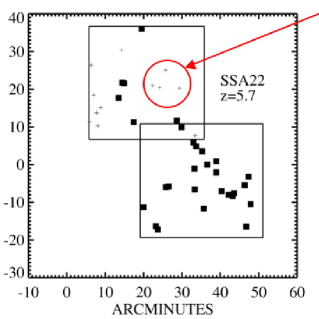
The spectroscopic samples ([Hu et al. (2004)], [Hu et al. (2005)]) with near-complete coverage in the SSA22 and HDF-N SuprimeCam fields provided the first quantitative demonstration of the existence of structured kinematic and redshift structures on large scales ( Mpc co-moving distance) at these redshifts. The long diagonal filament in right panel of Figure 5 makes up a distinct redshift system with Ly emission falling in the bottom quarter of the filter. Such features are also seen in maps of the HDF-N. Similar structured distribution at has recently been reported by [Ouchi et al. (2005)] for the Subaru XMM Deep Field.
6 Conclusions
We are now able to obtain large samples of and galaxies. The continuum and Ly luminosity functions seem to be similar to those at lower redshifts, indicating a strong contribution to to the ionization of the IGM from star-formation at these redshifts. Both the Ly luminosity function and the Ly line shapes are similar at and . Large scale structure revealed in the distribution of these high-redshift galaxies leads us to the exciting conclusion that we may be able to make 3-dimensional maps of the cosmic web at these redshifts!

Acknowledgements.
This research was supported by NSF grants AST 00-71208 to E. M. H. and AST99-84816 to L. L. C., and by NASA grant GO-7266.01-96A from Space Telescope Science Institute, which is operated by AURA, Inc. under NASA contract NAS 5-26555. We are grateful to the staff of the Keck and Subaru Telescopes for supporting these observations.References
- [Capak et al. (2004)] Capak, P. et al. 2004, AJ 127, 180
- [Cowie & Hu (1998)] Cowie, L.L. & Hu, E.M. 1998, AJ 115, 1319
- [Haiman (2002)] Haiman, Z. 2002, ApJ (Letters) 576, L1
- [Hu et al. (2005)] Hu, E.M., Cowie, L.L., & Capak, P. 2005, AJ submitted
- [Hu et al. (2004)] Hu, E.M., Cowie, L.L., Capak, P., Hayashino, T., & Komiyama, Y. 2004, AJ 127, 563
- [Hu et al. (1999)] Hu, E.M., Cowie, L.L., & McMahon, R.G. 1999 ApJ (Letters) 502, L99
- [Hu et al. (2002)] Hu, E.M., Cowie, L.L., McMahon, R.G., Capak, P., Iwamuro, F., Kneib, J.-P. Maihara, T., & Motoharo, K. 2002, ApJ (Letters) 568, L75; Erratum, ApJ (Letters) 576, L99
- [Kakazu et al. in preparation] Kakazu, Y. et al. 2005, in preparation
- [Malhotra & Rhoads (2004)] Malkhotra & Rhoads 2004, ApJ (Letters) 617, L5
- [Ouchi et al. (2005)] Ouchi et al. 2005, ApJ (Letters) 620, L1
- [Spinrad (2004)] Spinrad, H. 2004, in: J.W. Mason (ed.), Astrophysics Update, (Berlin: Springer-Verlag and Chichester, UK: Praxis Publishing), p. 155, (astro-ph/0308411)
- [Steidel et al. (1999)] Steidel, C.C., Adelberger, K.L., Giavalisco, M., Dickinson, M., & Pettini, M. 1999, ApJ 519, 1
- [Steidel et al. (2000)] Steidel, C.C., Adelberger, K.L., Shapley, A.E., Pettini, M., Dickinson, M., & Giavalisco, M. 2000, ApJ 532, 170
- [Taniguchi et al. (2005)] Taniguchi et al. 2005, PASJ 57, 165