Tracing baryons in the warm-hot intergalactic medium with broad Ly absorption ††thanks: Based on observations obtained with the NASA/ESA Hubble Space Telescope, which is operated by the Association of Universities for Research in Astronomy, Inc., under NASA contract NAS 5-26555.
We discuss physical properties and baryonic content of broad Ly absorbers (BLAs) at low redshift. These absorption systems, recently discovered in high-resolution, high-signal to noise quasar absorption line spectra, possibly trace the warm-hot intergalactic medium (WHIM) in the temperature range between and K. The central idea is that in ionization equilibrium WHIM filaments should contain a very small fraction of neutral gas (, typically), giving rise to weak intervening H i Ly absorption. Due to the high temperature of the WHIM, these Ly absorbers must be thermally broadened to Doppler parameters ( values) km s-1. It is expected, however, that also non-thermal line broadening processes, line blends, and noise features can mimic broad spectral features, complicating the quantitative estimate of the baryon content of the BLAs. To extend previous BLA measurements we have reanalyzed archival STIS data of the two quasars H 1821+643 and PG 0953+415 and have identified 13 BLA candidates along a total (unblocked) redshift path of . Combining our measurements with previous results for the lines of sight toward PG 1259+593 and PG 1116+215, the resulting new BLA sample consists of 20 reliably detected systems as well as 29 additional tentative cases, implying a BLA number density of . Eight BLAs show associated absorption from H i Ly and/or O vi. The comparison between Ly , Ly , and O vi line widths suggests that non-thermal broadening and noise features substantially affect the observed BLA value distribution. However, it remains unclear whether BLAs and O vi absorbers trace the same gas phase in the WHIM filaments. We estimate that the contribution of BLAs to the baryon density at is (BLA) for absorbers with log cmkm s. This number indicates that WHIM broad Ly absorbers contain a substantial fraction of the baryons in the local Universe.
1 Introduction
Photoionized and collisionally ionized intergalactic gas most likely makes up for most of the baryonic matter in the local Universe. While the diffuse photoionized intergalactic medium (IGM) that gives rise to the Lyman forest accounts for percent of the baryons today (Penton, Stocke, & Shull 2004), the shock-heated warm-hot intergalactic medium (WHIM) at temperatures K is expected to contribute at a comparable level to the cosmological mass density of the baryons at (Cen & Ostriker 1999; Dav\a’e et al. 2001). Gas and stars in galaxies, groups of galaxies, and galaxy clusters make up the rest of the baryonic mass (Fukugita 2003).
The WHIM is believed to emerge from intergalactic gas that is shock-heated to high temperatures as the medium is collapsing under the action of gravity (Valageas, Schaeffer, & Silk 2002). Directly observing this gas phase is a particularly challenging task, as the WHIM represents a low density ( cm-3), high-temperature ( K) plasma, primarily made of protons, electrons, He+, and He++, together with traces of some highly ionized heavy elements. Diffuse emission from this plasma is expected to have a very low surface brightness and its detection awaits UV and X-ray observatories more sensitive than currently available (see, e.g., Fang et al. 2005; Kawahara et al. 2005; Sembach et al. 2005). A promising approach to study the WHIM is the search for absorption features from the WHIM in the far-ultraviolet (FUV) and in the X-ray regime. Five-times ionized oxygen (O vi) is the most important high ion to trace the WHIM at temperatures of K in the FUV regime. Oxygen is a relatively abundant element and the two available O vi transitions (located at and Å) have large oscillator strengths. A number of detections of intervening WHIM O vi absorbers at have been reported in the literature (Tripp, Savage, & Jenkins 2000; Oegerle et al. 2000; Tripp & Savage 2000; Chen & Prochaska 2000; Savage et al. 2002; Richter et al. 2004, Sembach et al. 2004; Savage et al. 2005; Tripp et al. 2005; Danforth & Shull 2005). These measurements imply a number density of O vi absorbers per unit redshift of for equivalent widths mÅ (Danforth & Shull 2005). Assuming that 20 percent or less of the oxygen is present in the form of O vi () and further assuming a mean oxygen abundance of solar, the measured number density of O vi absorbers corresponds to a cosmological mass density of (O vi) . For the interpretation of this value it has to be noted that O vi absorption mainly traces gas with temperatures around K, but not the million-degree gas phase which probably contains the majority of the baryons in the WHIM. Very recently, Savage et al. (2005) have reported the detection of Ne viii in an absorption system at in the direction of the quasar HE 02264110. Ne viii traces gas at K (in collisional ionization equilibrium) and thus is possibly suited to complement the O vi measurements of the WHIM in a higher temperature regime. However, as the cosmic abundance of Ne viii is relatively low, Ne viii is not expected to be a particularly sensitive tracer of the WHIM at the signal-to-noise levels achievable with current UV spectrographs. This is supported by the non-detections of intervening Ne viii in other high S/N STIS data (Richter et al. 2004). X-ray absorption measurements are very important for studying the WHIM but are currently limited in scope because of the small number of available background sources and the relatively low spectral resolution of current X-ray observatories (FWHM to km s-1). Weak WHIM X-ray absorption by O vii and O viii has been observed with the Chandra X-ray observatory towards the quasar H 1821+643 (Mathur, Weinberg, & Chen 2003). More recently, Nicastro et al. (2005) have reported the detection of O vii absorption in a WHIM filament in the Chandra spectrum of the flaring blazar Mrk 421. In the future, more sensitive X-ray observatories such as the X-ray Evolving Universe Spectrometer (XEUS) and Constellation-X will be of great importance to study the properties of the warm-hot intergalactic gas over the entire temperature range in both absorption and emission.
Next to high-ion absorption from oxygen and other metals, recent observations with STIS (Richter et al. 2004; Sembach et al. 2004) suggest that WHIM filaments can be detected in Ly absorption of neutral hydrogen. Although the vast majority of the hydrogen in the WHIM is ionized (by collisional processes and UV radiation), a tiny fraction (, typically) of neutral hydrogen should be present. Depending on the total gas column density of a WHIM absorber and its temperature, weak H i Ly absorption at column densities log (H i) may arise from WHIM filaments and could be used to trace the ionized hydrogen component. The Ly absorption from WHIM filaments is expected to be very broad due to thermal line broadening, resulting in large Doppler parameters of km s-1. Such lines are generally difficult to detect, as they are broad and shallow. High resolution, high S/N FUV spectra of QSOs with smooth background continua are required to successfully search for broad Ly absorption in the low-redshift WHIM. The Space Telescope Imaging Spectrograph (STIS) is the only instrument that has provided such data, but due to the instrumental limitations of space-based observatories, the number of QSO spectra adequate for searching for WHIM broad Ly absorption (in the following abbreviated as ‘BLA’) is very limited. So far, two sight lines observed with STIS towards the quasars PG 1259+593 () and PG 1116+215 () have been carefully inspected for the presence of BLAs, and a number of candidates have been identified (Richter et al. 2004; Sembach et al. 2004). These measurements imply a BLA number density per unit redshift of for Doppler parameters km s-1 and restframe equivalent widths mÅ. The large range for partly is due to the uncertainty about defining reliable selection criteria for separating spurious cases from good broad Ly candidates (see discussions in Richter et al. 2004 and Sembach et al. 2004). Transforming the number density into a cosmological baryonic mass density, one obtains (BLA). This limit is only about 10 percent of the total baryonic mass density expected from the current cosmological models (see above), but is above the limit derived for the intervening O vi absorbers ((O vi) ; see above). Clearly, it is of great importance to extend the current sample of BLA candidates using recently obtained and archival STIS data to more reliably deduce the baryonic content of the WHIM at low .
In this paper we discuss the physical properties of the BLAs in the low-redshift Universe and review the observational constraints that limit the detectability of these systems. Moreover, we reanalyze the high S/N STIS spectra of the two QSOs H 1821+643 () and PG 0953+415 () to search for WHIM broad Ly absorption along these two sight lines (Sect. 3). We combine our data with the results from previous measurements for PG 1259+593 and PG 1166+215 and discuss physical properties and baryon content of the BLAs in Sect. 4. A summary of our study is given in Sect. 5.
2 Broad Ly absorption
2.1 Motivation
Ly lines arising in the WHIM will be thermally broadened, with values exceeding km s-1. Since the gas is ionized, only a very small fraction of the hydrogen will be in neutral form and the H i column density is expected to be small. Ly absorption from the WHIM therefore should occur in the form of very broad, shallow absorption lines. Their shape would differ significantly from the shape of ordinary Ly forest lines, which are usually relatively narrow ( km s-1; see Richter et al. 2004). For pure thermal broadening and assuming a collisional ionization equilibrium, one can estimate the total hydrogen content of each absorber directly from the measured line width ( value) and the H i column density (see Sect. 2.2). However, in addition to thermal line broadening, non-thermal broadening mechanisms exist, such as the Hubble flow or gas flows and turbulence within the cosmic web filaments. Also unresolved line blends can produce absorption features that are broad and shallow. For the analysis of interstellar and intergalactic absorption lines it is therefore common to assume that the measured value of an absorption line is composed of a thermal component, , and a non-thermal component, , so that :
| (1) |
Current FUV absorption line data typically have limited spectral resolution and moderate signal-to-noise ratios (S/N). This means that some of the apparently broad, shallow absorber candidates in these spectra may be produced by noise features, blends of multiple narrow absorption lines, and continuum undulations rather than by WHIM gas. To reliably estimate the baryon content of the WHIM from broad Ly absorption it is therefore necessary to assess the effects of non-thermal broadening processes and data quality issues. In the following sections we discuss these various aspects in more detail to identify difficulties for the interpretation of broad spectral features.
2.2 Thermal line broadening
If the width of an absorption line is governed solely by thermal broadening (i.e., ), the measured value of the line serves as a direct measure for the temperature of the gas:
| (2) |
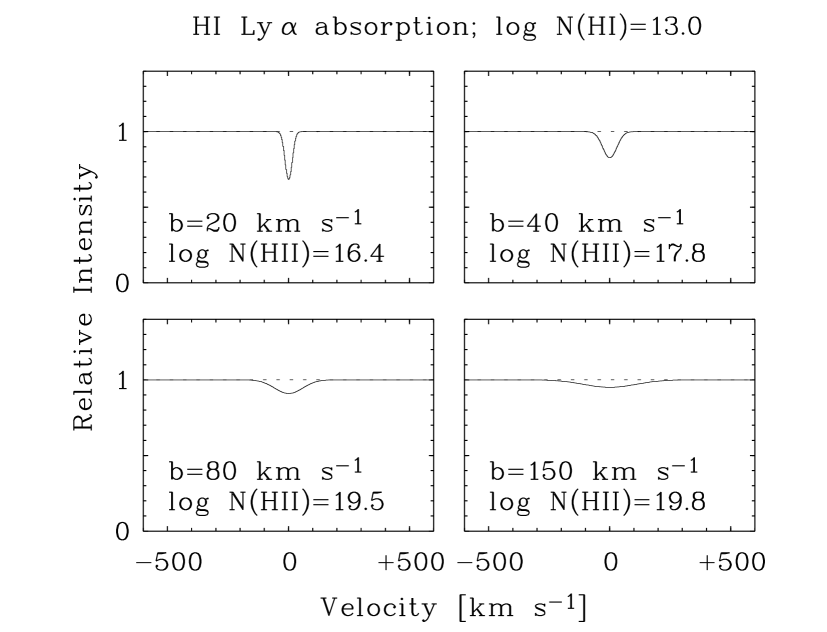
where is the Boltzmann constant, is the particle mass, and is the atomic weight of the element. We demonstrate the effect of thermal line broadening of the Ly absorption in Fig. 1: we model the expected shape (Voigt profile) of an H i Ly absorption line with a constant H i column density of log (H i) for Doppler parameters , and km s-1. From equation (2) follows that for pure thermal broadening. The values of , and km s-1 given in Fig. 1 then correspond to temperatures of log , and . Clearly, it is much easier to detect Ly absorption from gas with K than Ly absorption from gas with K. The search for broad Ly absorption from the WHIM at temperatures K therefore requires spectral data with good S/N and a smooth background continuum.
If collisional ionization equilibrium (CIE) applies, one can directly calculate the hydrogen ionization fraction log log ((HHH log (HH0) as a function of the gas temperature (Sutherland & Dopita 1993; Richter et al. 2004) :
| (3) |
Together with the measured H i column density, (H i), one can determine the total hydrogen column density via (H(H i). Under these assumptions, the chosen sequence of values in Fig. 1 not only is a sequence of increasing temperature of the absorbing gas, but also a sequence of increasing ionized hydrogen column density (log (H ii, and ). The correlation between higher gas content and weaker H i absorption has important observational consequences if the lines are thermally broadened: the broader and shallower a WHIM H i Ly line is, the more baryonic material it traces. This means that it will be particularly difficult to detect those WHIM Ly absorbers that have the largest baryon content, as many of these features may fall below the detection limit. Note that for low gas densities ( cm-3) photoionization by the UV background contributes to the ionization of the WHIM (see Sect. 2.6). Therefore, the total hydrogen column density derived from equation (3) under the assumption of CIE has to be regarded as a lower limit for (H) in BLAs.
2.3 Non-thermal line broadening
The network of WHIM filaments represents cosmic structures at scales of a several Mpc (e.g., Cen & Ostriker 1999; Davé et al. 2001), while the thickness of an individual filament is expected to be on the order of several hundred kpc (Valageas, Schaeffer, & Silk 2003). Line broadening due to peculiar velocities and turbulence in the gas therefore must be considered when it comes to the interpretation of lines widths of WHIM absorbers. Clearly, at such large scales the gas is expected to have density and velocity substructure that will leave its imprint in the observed H i optical depth distribution (Kawahara et al. 2005). These effects would result in non-Gaussian shapes of broad H i lines, which could be identified in absorption line data at sufficient spectral resolution and S/N. Broad H i lines that are asymmetric therefore should be interpreted with particular care, as their width may not represent a good measure of the temperature of the gas.
As spectral resolution and signal-to-noise (S/N) in FUV data are limited, apparently broad Ly absorption may be caused by individual unresolved velocity components. In particular the measurements of line widths from intermediate and low spectral resolution spectra (FWHM km s-1) often turn out to be imprecise due to the presence of subcomponents that are not, or only barely resolved in the data. The resolution of the STIS E140M spectra used in this and the previous two studies is high, and with a FWHM of km s-1, much smaller than the typical widths of the lines under investigation ( km s-1 or FWHM km s-1). At this resolution, most of the existing subcomponent structure in intervening absorbers should be resolved. Multiple absorption components that are separated by km s-1 will in most cases produce an absorption structure that looks asymmetric and non-Gaussian. For uniformity, in this paper we concentrate on STIS E140M spectra, but we note that BLA candidates have also been identified in lower-resolution observations with the STIS first-order gratings (e.g., Bowen, Pettini, & Blades 2002).
If the WHIM gas participates in the overall Hubble-flow, Hubble broadening will contribute with km s-1 per hundred kpc thickness of the absorber to the total line width. However, if the thickness of the absorbing WHIM structures is on the order of a few hundred kpc (Valageas, Schaeffer, & Silk 2002), one expects that km s-1, typically. Moreover, as the WHIM is produced by collapsed gaseous structures that undergo gravitational shock-heating, one may argue that the resulting WHIM filaments primarily have decoupled from the Hubble flow during the collapse phase and that the gas dynamics is driven primarily by internal processes (this should be valid at least for the main direction of the collapse). Hubble broadening therefore is not expected to dominate the widths of WHIM spectral lines. For those BLAs in which associated O vi absorption is observed, one can evaluate the possible presence of non-thermal line broadening by comparing the value of H i and O vi. For pure thermal broadening the O vi value is expected to be four times smaller than that of H i owing to the 16 times larger mass of oxygen (see equation 2). Non-thermal contributions to may be significant for BLA/O vi absorber pairs that have . However, only a small fraction of the BLAs show associated O vi absorption, so that this consistency check on the gas temperature can be applied only to a few cases. In addition, significant velocity offsets between H i and O vi as well possible multi-component structure in the O vi are observed in some cases. It thus remains unclear whether the H i and the O vi absorption always trace the same gas phase, and whether the comparison between O vi and H i line widths provides reliable information about non-thermal gas motions.
2.4 Noise
FUV spectral data of extragalactic background sources obtained with STIS typically have S/N per km s-1 wide resolution element. The presence of noise clearly hampers the reliable detection of WHIM BLA candidates. The S/N in the data will determine the detection limit of broad features and so it is clear that only the highest H i column density WHIM filaments can be detected with current FUV data. In contrast to the O vi absorbers, the detection limit for broad Ly absorption cannot easily be quantified in terms of a minimum equivalent width, as both the depth and the width of a line limit its detectability. For instance, a relatively narrow H i Ly line with km s-1 and log (see Fig. 1, upper right panel) will have an equivalent width of mÅ and can easily be detected with STIS data at a S/N. At this S/N, however, a very broad line with km s-1 and log (Fig. 1, lower right panel) would not be detectable, although the equivalent width would be the same. From the analysis of STIS data we find that BLA candidates can be identified if the following condition is fulfilled:
| (4) |
In this equation, S/N is the local signal-to-noise ratio per resolution element. The S/N ratio may vary significantly within a spectrum due to large-scale flux variations in the QSO spectrum and the wavelength-dependent sensitivity of the detector. The average S/N in our STIS data is , so that the typical detection limit for detecting broad Ly absorbers in these data is log .
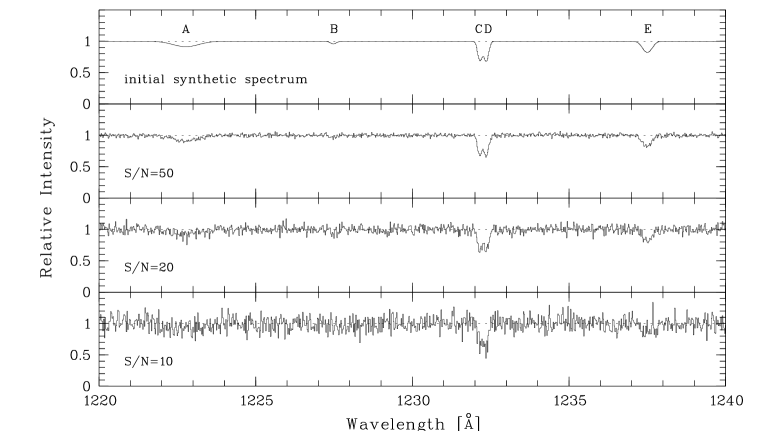
Noise features will also influence the shape of spectral features and thus will complicate the search for WHIM BLA candidates. Therefore, we have studied the influence of noise features (Poisson noise) in a set of artificial spectra with various S/N levels. The FWHM in these spectra is similar to those in the STIS data and the pixel size corresponds to one resolution element ( km s-1). An example spectrum is shown in Fig. 2. The outcome of our noise analysis of these mock spectra is the following: (1) noise can create structures in the continuum that could be mis-identified as intervening broad Ly absorption, (2) noise can create broad absorption features out of multiple, individual velocity components that are separated only by km s-1, (3) noise can substantially modify the shape of an existing broad absorber, so that Gaussian-shaped absorption lines become asymmetric, and vice versa. The binning of several pixels can help to check on the validity of an absorption feature, but we find that at S/N more than percent of all apparent broad absorption features are caused by noise rather than by intrinisically broad lines. Next to Poisson noise, other systematic noise sources can be important for the interpretation of spectral features in FUV absorption line data. For the STIS instrument, possible order-edge artifacts and features caused by the obscuration by the field electrode of the MAMA detector (the “repeller wire”; see Woodgate et al. 1998) have to be considered. The limited S/N in the currently existing FUV data introduces the largest uncertainty for the proper identification and analysis of BLA candidate lines. Note, however, that the broad lines chosen for this study currently represent the best ones available for the search of BLAs.
2.5 Continuum undulations
Due to the large width and the shallowness of the BLAs, one may argue that part of these features are not produced by intervening absorption but rather are caused caused by small-scale undulations in the overlaying quasar continuum. One simple way to test for the presence of continuum undulations in the STIS data is to analyze the smoothness of the quasar continuum shortwards and longwards of the QSO Ly emission. If some of the features identified as broad Ly absorbers are instead produced by continuum undulations, one should expect that such undulations are distributed all over the spectrum, whereas true intergalactic BLAs can occur only in the wavelength range between Å and Å. However, in none of the analyzed spectra do broad features (if significant with respect to the ambient noise) occur at wavelengths Å. This implies that continuum undulations do not interfere with our BLA search.
Continuum undulations also may be caused by weak emission lines from the QSO. Possible candidate lines for the range Å are, for instance, H i Ly , O vi , C iii . However, none of the BLA candidates considered in this paper lie close to the wavelengths at which QSO emission in these (and other) lines would be expected.
2.6 Deviations from CIE
The determination of and (H ii) using equation (3) is valid only under the assumption that the gas is in collisional ionization equilibrium, which may not be the case in general. In fact, it is expected that for low-density gas ( cm-3) photoionization from the UV background becomes important, so that the ionization fraction (as defined in Sect. 2.2) in low-density BLAs should be higher compared to what is estimated for pure collisional ionization. To investigate the influence of photoionization we have analyzed the output of a WHIM simulation presented by Fang & Bryan (2001). This simulation includes a combined (time equilibrium) collisional ionization and photoionization model (hereafter referred to as CIE+PH), based on ionization fractions from Mazzotta et al. (1998) and the CLOUDY photoionization code (Ferland et al. 1998). The WHIM simulation predicts that for K and cm-3 the CIE+PH ionization fraction is (on average) percent higher than for CIE alone. If we restrict the density range to cm-3, the CIE+PH ionization fraction typically lies percent above the CIE estimate. This shows that photoionization is important for the BLAs. However, since we do not have information about the actual hydrogen volume densities in these absorbers, we only can notice that with the CIE assumption we probably underestimate the ionized hydrogen column density (and thus the baryon content) of BLAs by percent. To more precisely pinpoint the role of photoionization in BLAs a more detailed analysis of broad Ly absorption in cosmological simulations is required. This will be presented in a future paper (Richter et al. 2005, in preparation).
| Sight line | Grating | Exposure time | Broad Ly analysis | ||||
|---|---|---|---|---|---|---|---|
| [mag] | [ks] | ||||||
| H 1821+643 | 94.00 | 14.24 | 0.297 | E140M | 25.5 | this study | |
| PG 0953+415 | 179.79 | 15.32 | 0.239 | E140M | 24.5 | this study | |
| PG 1116+215 | 223.36 | 14.80 | 0.177 | E140M/E230M | 35.5 | Sembach et al. (2004) | |
| PG 1259+593 | 120.56 | 15.84 | 0.472 | E140M | 95.5 | Richter et al. (2004) |
2.7 The baryonic content of broad Ly absorbers
The cosmological mass density of the WHIM broad Ly absorbers in terms of the current critical density can be estimated by
| (5) |
with , kg, km s-1 Mpc-1, and . The index denotes an individual broad Ly system along a line of sight . Each measured absorption system is characterized by its neutral hydrogen column density, (H i)ij and ionization fraction, (see equation 3). Each line of sight has a characteristic redshift range in which broad Ly absorption may be detected. The comoving path length available for the detection broad Ly systems then is given by:
| (6) |
where we refer to a cosmology with . Due to the presence of Ly forest lines and interstellar absorption lines a blocking correction for each sight lines has to be applied.
2.8 Summary: interpretation of H i line widths
As there currently are only very few techniques that can be used to constrain the baryon budget of the WHIM by direct observations, the analysis of broad Ly absorbers in low- QSO absorption line spectra is of fundamental importance for our understanding of the distribution of baryonic matter in the local Universe. Every WHIM filament that contains sufficient amounts of neutral hydrogen will produce a broad Ly absorption line, but, vice versa, not every broad feature observed in FUV data is caused by the WHIM. Moreover, the quantitative estimate of (H ii) from (H i) and (H i) is hampered by the various alternative broadening mechanisms discussed above. Therefore it is clear that the interpretation of broad absorption features in FUV spectra and the determination of from BLA candidates is afflicted with systematic uncertainties. This should be kept in mind for the second part of the paper, where we analyze BLA candidates along four lines of sight and estimate their baryon content.
3 STIS observations of low- broad Ly absorbers
3.1 Overview
STIS data with medium- to high spectral resolution and good S/N are available only for a very limited number of QSO sight lines, as it requires a substantial amount of observing time to observe objects with magnitudes at high spectral resolution. In this study, we analyze broad Ly absorbers along the two lines of sight towards H 1821+643 and PG 0953+415 and combine these data with previously published measurements for PG 1259+593 (Richter et al. 2004) and PG 1116+215 (Sembach et al. 2004). Information about the line-of-sight properties is summarized in Table 1. All four spectra were obtained between 1998 and 2002 using the medium resolution FUV echelle mode (E140M), which provides a spectral resolution of , corresponding to FWHM km s-1. The integration time for each spectrum varies between and ks (see Table 1). More detailed information about the observations and primary data reduction of these spectra can be found in Tripp, Savage, & Jenkins (2000), Tripp & Savage (2000), Richter et al. (2004), and Sembach et al. (2004, 2005a). Note that the STIS data sets for H 1821+643 and PG 0953+415 have been extensively used to study the distribution and properties of intervening O vi absorbers at low redshifts (Tripp, Savage, & Jenkins 2000; Tripp & Savage 2000; Tripp et al. 2001; Savage et al. 2002), as well as to investigate the statistical and physical properties of the low Ly forest (Dav\a’e & Tripp 2001). In the latter study, the authors compared the properties of the Ly forest in these two spectra with those of mock QSO spectra from hydrodynamical simulations. For the analysis, Dav\a’e & Tripp used an automated continuum fitting routine together with an automated Voigt profile fitting algorithm (AutoVP; see Dav\a’e et al. 1997) to efficiently handle the large number of lines in their data. With this method, they find 89 Ly forest absorbers with km s-1 along a total redshift path of (Dav\a’e & Tripp 2001; their Fig. 6), but apparently only two systems with km s-1. However, our experience with automated line fitting routines is that broad and shallow spectral features often are not identified by these routines, or that they are inappropriately fitted, e.g., by multiple, narrow lines. A careful re-analysis of these data focussed on the search of broad and shallow absorption features is justified.
3.2 Data analysis
For the data analysis of the STIS spectra of H 1821+643 and PG 0953+415 we follow the procedures from previous spectral anlyses of STIS data for PG 1259+593 (Richter et al. 2004) and PG 1116+215 (Sembach et al. 2004). From a careful by-eye inspection of the STIS data (put onto a heliocentric velocity scale) we first have created a catalog of broad spectral features that represent candidates for intervening broad H i Ly absorption ( Å; oscillator strength ; Morton 2003). As we do not want to include absorbers that possibly are associated with the background quasar itself, we have considered only those lines that are more than km s-1 away from the quasar. We have omitted from our candidate list those absorption features that exhibit clear evidence for sub-component structure, line blending, and irregularities due to continuum undulations. Moreover, we do not consider broad absorption features that are part of complex multicomponent absorption systems, as the width of these absorbers is particularly difficult to determine. We therefore ignore hot gas that is situated in multiphase absorbers that may preferentially be related to gas in the vicinity of galaxies and galaxy groups. This introduces a selection bias in our BLA sample. Note that recent observations of Ne viii and O vi in a multiphase absorber at toward HE 02264110 suggest that such systems may contain significant amounts of hot gas (Savage et al. 2005). It is important to emphasize that our selection procedure is based solely on the visual inspection of absorption features in the spectrum. This method thus involves a certain degree of subjectiveness for the identification of BLA candidates, in particular if it comes to the evaluation of noise features, line asymmetries, and continuum undulations. As outlined earlier, automated fitting procedures currently do not represent a reliable alternative to assess the significance of broad spectral features. Therefore, we here rely on selection criteria based on our experience with previous absorption line data. Note that the BLA candidates presented in this paper have been identified and evaluated independently by the various authors of this paper.
After having selected a sample of BLA candidate lines we have cross-checked whether these features could be higher Lyman lines or metal lines belonging to other intergalactic absorption systems, and modified the list accordingly. We then checked for associated broad Ly and O vi absorption for the BLA candidates. BLAs that show associated Ly absorption with km s-1 have been excluded from our sample (see Sect. 4.2.1). For the final BLA candidate sample, the lines have been continuum-normalized. The continuum fitting was done for each line individually, using low-order polynomials that fit the continuum around a line in range from approximately to km s-1. The base points for the polynomial fit were obtained from a binned (10 pixels, typically) version of the spectrum to smooth out the noise in the continuum flux and thus to increase the reliability of the continuum fit. The normalized broad Ly candidate lines then were fitted with Voigt profiles convolved with a Gaussian line spread function that corresponds to the spectral resolution of the STIS instrument (FWHM km s-1). As the lines under analysis generally have FWHM km s-1, possible small deviations of the STIS line spread function from a single-component Gaussian have no measurable influence on the outcome of the profile fit. For the fitting procedure we have used the Voigt profile/ minimization routine FITLYMAN installed in the ESO-MIDAS software package (Fontana & Ballester 1996), which delivers line centroids, redshifts, equivalent widths, logarithmic column densities, values, and their corresponding errors. The total uncertainty for and have been calculated by quadratically adding the error estimates from the fitting process to those from the continuum placement. Due to the fact the S/N varies over the spectrum, the detection limit for BLAs, log , as defined in Sect. 2.4, also varies across the spectrum. Many of the BLA candidates in our sample have a low S/N in their profile. In some cases, there is weak (but not compelling) evidence for asymmetries and unresolved component structure. Although these systems are all clearly detected with except for one line with , it is probable that some of them are not related to thermally broadened H i but are caused by blends of several subcomponents and noise features. As the S/N in our data is not good enough to reliably evaluate the true component structure in these broad lines, we regard these absorbers as tentative BLA detections. Throughout the following we label these cases accordingly. Measured column densities, values, and other quantities for each absorber in our final BLA candidate sample are listed in Tables 2 and 3. In Table 4 we list estimates for the temperature, ionization fraction, and total hydrogen column density for each system (see Sect. 4.3). Statistical information for each sight line is presented in Table 5.
3.3 H 1821+643
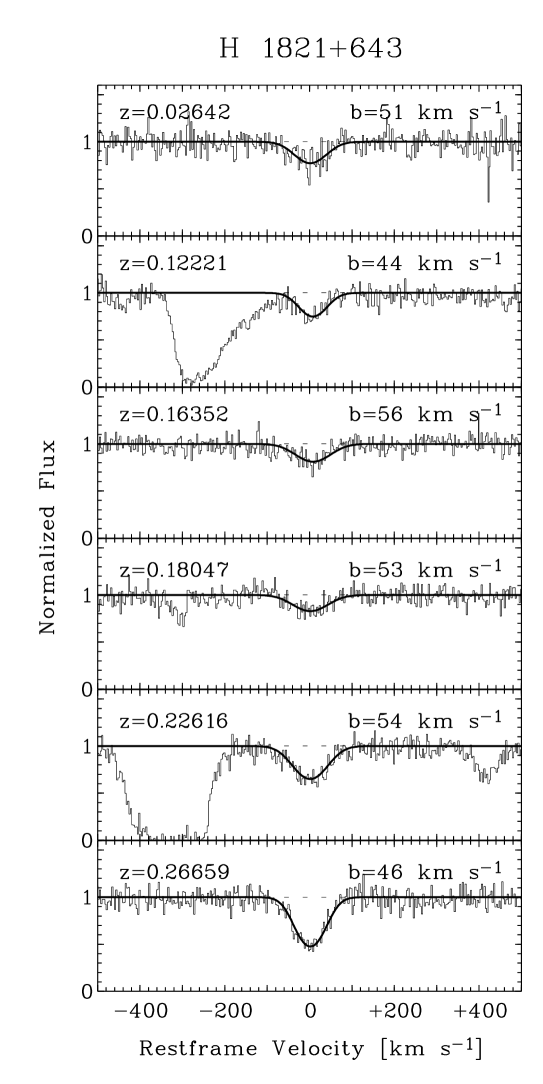
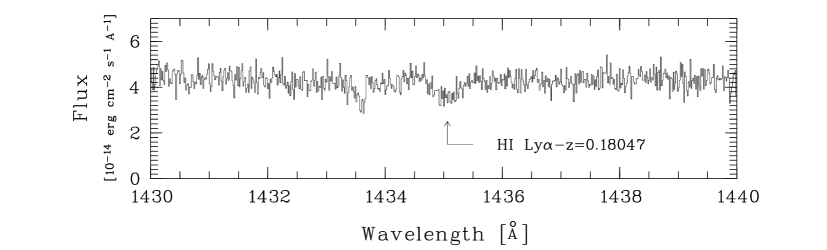
The wavelength range available for detecting intervening broad Ly absorption towards H 1821+643 () is from Å to Å ( km s-1 away from the quasar), corresponding to a redshift interval of . The typical S/N in this range is per resolution element, so that the detection limit for broad Ly absorption (see equation 4) is log . The blocking of certain spectral regions due to other interstellar and intergalactic lines reduces the total unblended redshift interval to a value of . We find six reliably detected single-component BLA candidates at , and . Equivalent widths, column densities, and values for these absorbers are listed in Table 2. The systems at , , and have been previously identified as H i Ly absorption in lower-resolution GHRS G140L data (Tripp, Lu, & Savage 1998). Two of these systems (at and ) show associated O vi absorption, which has been previously analyzed by Tripp, Savage & Jenkins (2000). For the system we find associated Ly absorption, which is also broad ( km s-1). Considering all six BLA candidates we obtain a BLA number density per unit redshift of for log . As an example for broad Ly absorption towards H 1821+643 we show in Fig. 3 the spectral region between and Å. The BLA near Å () is clearly visible, and there is no evidence that this feature is produced by a continuum undulation or a blend of several narrow absorption lines. Continuum normalized velocity profiles of all BLA candidates towards H 1821+643 are shown in Fig. 4. From Voigt profile fitting of the Ly profiles we derive values between and km s-1 and logarithmic H i column densities between and (see Table 2 for details). All the BLAs candidate lines toward H 1821+643 therefore are relatively narrow, which may imply that some of them are not related to the WHIM, but rather are Ly forest lines broadened by non-thermal processes. Our measured values of km s-1 and log for the BLA at agree well with the numbers cited by Tripp, Savage, & Jenkins (2000) ( km s-1 and log ) for this system. Note that we do not consider here the broad Ly absorption found in the system, as this line is part of a complex multiphase absorption system with very broad O vi absorption, possibly indicating unresolved component structure and non-thermal broadening processes (Tripp et al. 2001). A complete IGM analysis of the H 1821+643 sight line will be provided in a separate paper (Sembach et al. 2005a).
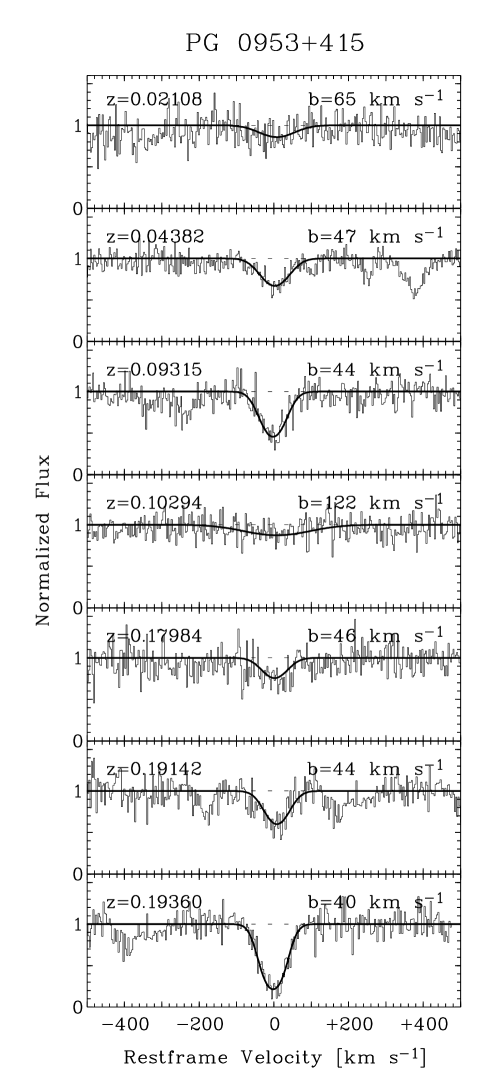
3.4 PG 0953+415
Towards PG 0953+415 we detect seven BLA candidates at , , , , , , and in the available wavelength range between and Å (). After applying a blocking correction, the total redshift path for finding BLAs towards PG 0953+415 reduces to . The systems at , , and are tentative detections (see Table 2, last column for a more detailed description of these lines). Another broad spectral feature is observed near Å, corresponding to for H i Ly . This feature most likely is an order-edge artifact caused by the slightly imperfect ripple correction in the STIS data (see Sect. 2.4) and will not be considered any further. The S/N in the PG 0953+415 spectrum is , implying a typical detection limit for broad Ly absorption of log (equation 4). The systems at , , , and have been previously identified as H i Ly by Savage et al. (2002). None of the broad Ly candidates towards PG 0953+415 shows associated O vi absorption; the two O vi absorbers identified by Savage et al. (2002) are both multiphase absorbers with H i Lyman series absorption having km s-1. The system at is also detected in broad Ly absorption (with a line width consistent with that of the Ly absorption). From the four reliably detected BLA candidates and the blocking-corrected redshift path of we obtain for log for the line of sight towards PG 0953+415. Including the three tentative cases we find . All seven systems are shown in Fig. 5. Voigt profile fitting of these lines results in values between and km s-1 and logarithmic H i column densities between and , as listed in Table 2.
| a | log a | a | log | Other det. | Status b | ||
| Å | mÅ | [km s-1] | species | ||||
| H 1821+643 | |||||||
| 1247.789 | 0.02642 | 11.5 | |||||
| 1364.232 | 0.12221 | 11.6 | |||||
| 1414.461 | 0.16352 | 11.4 | |||||
| 1435.057 | 0.18047 | 11.5 | |||||
| 1490.605 | 0.22616 | 11.7 | (O vi) | ||||
| 1539.750 | 0.26659 | 12.0 | Ly , O vi | ||||
| PG 0953+415 | |||||||
| 1241.302 | 0.02108 | 11.3 | tentative, S | ||||
| 1268.938 | 0.04382 | 11.7 | |||||
| 1328.905 | 0.09315 | 12.0 | |||||
| 1340.807 | 0.10294 | 11.2 | tentative, S | ||||
| 1434.275 | 0.17982 | 11.6 | |||||
| 1448.378 | 0.19142 | 11.8 | tentative, A | ||||
| 1451.026 | 0.19360 | 12.3 | Ly | ||||
| PG 1116+215 | |||||||
| 1235.550 | 0.01635 | 11.7 | |||||
| 1265.820 | 0.04125 | 11.2 | O vi | tentative, M | |||
| 1289.490 | 0.06072 | 11.5 | |||||
| 1291.580 | 0.06244 | 11.3 | O vi | ||||
| 1320.060 | 0.08587 | 11.2 | tentative, S | ||||
| 1328.470 | 0.09279 | 11.3 | tentative, B | ||||
| 1378.210 | 0.13370 | 11.3 | tentative, A | ||||
| PG 1259+593 | |||||||
| 1218.449 | 0.00229 | 11.9 | Ly , O vi | ||||
| 1221.024 | 0.00440 | 11.5 | tentative, S | ||||
| 1221.812 | 0.00505 | 11.7 | tentative, S | ||||
| 1232.046 | 0.01347 | 11.2 | tentative, S | ||||
| 1267.334 | 0.04250 | 11.5 | tentative, A | ||||
| 1283.572 | 0.05586 | 11.3 | tentative, A | ||||
| 1298.456 | 0.06810 | 11.2 | tentative, M | ||||
| 1313.423 | 0.08041 | 11.3 | |||||
| 1327.468 | 0.09196 | 11.1 | tentative, A | ||||
| 1340.654 | 0.10281 | 11.1 | tentative, A | ||||
| 1377.977 | 0.13351 | 11.3 | tentative, A | ||||
| 1386.276 | 0.14034 | 11.3 | tentative, S | ||||
| 1390.498 | 0.14381 | 11.1 | tentative, S | ||||
| 1396.225 | 0.14852 | 12.3 | Ly | ||||
| 1399.668 | 0.15136 | 11.5 | |||||
| 1418.044 | 0.16647 | 11.4 | tentative, A, R | ||||
| 1424.130 | 0.17148 | 11.1 | tentative, M, R | ||||
| 1433.167 | 0.17891 | 11.3 | tentative, M | ||||
| 1441.174 | 0.18550 | 11.2 | tentative, A, R | ||||
| 1493.587 | 0.22861 | 11.9 | |||||
| 1508.963 | 0.24126 | 11.5 | |||||
| 1566.428 | 0.28853 | 11.5 | tentative, S | ||||
| 1591.389 | 0.30906 | 11.5 | tentative, S | ||||
| 1600.816 | 0.31682 | 11.4 | tentative, S | ||||
| 1604.410 | 0.31978 | 12.1 | Ly , O vi | ||||
| 1610.496 | 0.32478 | 11.6 | tentative, M | ||||
| 1676.519 | 0.37909 | 11.5 | tentative, S | ||||
| 1680.862 | 0.38266 | 11.6 | tentative, M | ||||
| 1723.654 | 0.41786 | 11.5 | tentative, A | ||||
a errors are given.
b Lines listed as tentative are all clearly detected with
except for the line toward PG 1116+215
with . However, the tentative lines may not have the required Gaussian
line shape to be considered as good candidates for single component thermally broadened BLAs.
The following abbreviations are used to explain why the detected lines are marked tentative:
A = line is possibly asymmetric; B = line is blended;
M = evidence for multi-component substructure; R = possible artifact caused by the MAMA repeller wire;
S = S/N in the profile too low to reliably evaluate possible component structure.
3.5 PG 1116+215 and PG 1259+593
Detailed analyses of the BLAs towards PG 1116+215 and PG 1259+593 have been presented by Sembach et al. (2004) and Richter et al. (2004), respectively. We here briefly summarize and update the findings from these studies. Toward PG 1116+215, Sembach et al. (2004) find seven BLA candidates along a total, unblocked redshift path of . We regard four of these absorbers as tentative detections (see Table 2, last column). With an average S/N of , the study implies for log for the reliably detected systems ( including the uncertain cases). Toward PG 1259+593 there are 29 BLA candidates along relatively long, unblocked redshift path of (Richter et al. 2004). Following the selection criteria presented above, 22 of these candidate BLA systems are tentative detections. The average S/N in the the PG 1259+593 spectrum is , but note that the S/N varies within a factor of along the spectrum. The number of reliably detected broad systems () corresponds to for log ( including the uncertain cases). Column densities, values and other information about these broad Ly candidates towards PG 1116+215 and PG 1259+593 are listed in Tables 2 and 3.
4 Properties of low- broad Ly absorbers
4.1 Number distribution
The measured values for along each individual line of sight toward H 1821+643, PG 0953+415, PG 1116+215, and PG 1259+593 are summarized in Table 5. For the definitely detected systems, varies between 20 (PG 0953+415 and PG 1259+593) and 25 (H 1821+643). If we include the tentative detections, ranges between 25 (H 1821+643) and 82 (PG 1259+593). The discrepancy between the values for along the individual sight lines may be due to intrinsic scatter from the low-number statistics, possibly reflecting the peculiarities of the WHIM distribution along individual sight lines. On the other hand, part of the scatter may be caused by the varying sensitivity to detect broad Ly absorption in these spectra due to the varying S/N. The PG 1259+593 sight line, for instance, provides a large number of tentative BLA detections in regions with relatively low S/N. Most likely, a fair fraction of these tentative BLA candidates are not WHIM absorbers but are caused by noise and unresolved component structure. Combining these four lines of sight, we have a total redshift path of to detected BLA candidates. The comoving total path length sums up to , as calculated from equation (6). Along this redshift path, the STIS data then yield a mean value of 11122 for the secure detections, 53 for entire candidate sample including the tentative cases. for absorbers with log to , with an absorber weighted average of log .
4.2 Identification of different absorber types
We can distinguish between BLAs that are detected solely in Ly and systems that show associated absorption in Ly and/or O vi. Associated Ly and/or O vi absorption may be of great importance to gain insight into the physical conditions of these systems. In our sample there are eight BLA systems that show associated absorption by Ly and/or O vi, as indicated in Table 2, seventh column. In Table 3 we summarize detailed information about these systems, such as H i and O vi values and O vi velocity offsets.
| Sight line | Det. lines | a | a | ||||
|---|---|---|---|---|---|---|---|
| [km s-1] | [km s-1] | [km s-1] | [km s-1] | ||||
| 0.22616 | H 1821+643 | H i , O vi | 50.8 | … | 15.7 | 60 | 3.2 |
| 0.26659 | H 1821+643 | H i , O vi | 45.6 | 42.2 | 24.1 | 9 | 1.9 |
| 0.19360 | PG 0953+415 | H i | 40.3 | … | … | … | … |
| 0.04125 | PG 1116+215 | H i , O vi | 105.0 | … | … | 35 | … |
| 0.06244 | PG 1116+215 | H i , O vi | 77.3 | … | … | 20 | … |
| 0.00229 | PG 1259+593 | H i , O vi | 42.1 | … | … | 48 | … |
| 0.14852 | PG 1259+593 | H i | 42.1 | … | … | … | … |
| 0.31978 | PG 1259+593 | H i , O vi | 74.3 | 62.7 | 19.3 | 10 | 3.9 |
a values measured only for lines in the STIS wavelength regime.
4.2.1 BLAs with associated Ly absorption
Five broad Ly systems in our sample have an associated broad Ly line. For the occurrence of associated Ly absorption a minimum strength of log is required. This means that the high-column density systems can be detected in Ly , if this line falls into a spectral region not blended by other ISM/IGM lines. For a thermally broadened WHIM absorber, the value measured for Ly should be consistent with that of the Ly absorption. If the values for Ly and Ly are largely inconsistent with each other, blending effects or noise features are most likely affecting the data and these systems should not be considered any further. An example for this is the system toward PG 1259+593 (see Richter et al. 2004, their Fig. 3f), which shows a relatively broad Ly line with km s-1, whereas the Ly absorption is narrow with km s-1. For this system we can conclude that blending and noise effects but not thermal line broadening determine the observed large width of the Ly absorption. This system therefore is not included in our sample. A counter-example is the BLA at along the same line of sight, which has a value of km s-1 consistent with both Ly and Ly absorption (Richter et al. 2004, their Fig. 3g). Along all four sight lines we find nine BLAs with km s-1 that have associated Ly absorption, but only for five of these systems is the width of the corresponding Ly line consistent with km s-1. Although our statistics are poor, this implies that S/N features, blending issues, and other processes may contaminate our BLA sample up to a level of percent. This value is consistent with our estimate from Sect. 2.4, where we analyzed the influence of noise in a set of artificial spectra.
4.2.2 BLAs with associated O vi absorption
From the 20 reliably detected BLAs towards H 1821+643, PG 0953+415, PG 1116+215, and PG 1259+593, six show associated O vi absorption within a velocity range of km s-1. Only a small fraction of the broad Ly systems is expected to have associated O vi absorption, as the occurrence of O vi critically depends on the metallicity of the absorbing gas, its temperature, and its total column density. Therefore, most BLAs arise in WHIM gas that is too hot, to metal-poor, or too diffuse for O vi absorption to occur at detectable levels. Some of these “hybrid systems” that have good S/N in both Ly and O vi absorption have been analyzed in detail with respect to their physical properties, such as temperature, ionization conditions, and metallicity (Sembach et al. 2004; Richter et al. 2004; Tripp, Savage, & Jenkins 2000). Under the assumption of collisional ionization equilibrium, the column densities of H i and O vi can be used to constrain the oxygen abundance in the gas (see, e.g., the system towards PG 1259+593; Richter et al. 2004). The measured values for H i and O vi also can provide information about the influence of non-thermal broadening components in some systems. The comparison between broad H i and O vi absorption is often difficult, however, as the observed O vi features do not exactly align in velocity space with the broad Ly absorption (see also Sect. 2.4). The velocity centroids of broad Ly and O vi in these six systems deviate by km s-1 (see Table 3). Such velocity offsets could be caused by substructures within the filament. It is plausible that WHIM filaments are neither perfectly homogeneous (in terms of volume densities), nor are they perfectly isothermal (Kawahara et al. 2005). If substructures with higher densities exist, the gas may be able to cool, creating distinct regions where O vi absorption may occur preferentially once the gas reaches the peak temperature of O vi near K. The radial velocities of these denser spots would most likely differ from the center velocity of the entire filament, in particular if the gas stays in a hydrostatic equilibrium (e.g., Valageas, Schaeffer, & Silk 2002). Cooler spots then would move towards the mass center of the filament, creating a cooling flow. Such effects may lead to a non-uniform optical depth distribution of H i and O vi along the WHIM filament and could produce velocity offsets between the integrated absorption profiles of these two species. It therefore remains unclear whether the observed broad H i and the O vi trace the same gas phase.
Also the comparison between H i and O vi values provides information about possible non-thermal broadening effects, as outlined in Sect. 2.3. For three out of the six H i/O vi absorber pairs accurate O vi values can be measured and the resulting ratios are listed in the last row of Table 3. Only the system at towards PG 1259+593 has , as expected for pure thermal line broadening (equation 2). The systems at and towards H 1821+643 both have , thus indicating that dominates over in these systems. The large widths of the O vi lines could be caused by unresolved substructure, while the multi-component O vi still could arise in hot gas that produces thermally broadened H i absorption. Since it is unclear whether the broad Ly absorption and the O vi arise in the same gas phase, we have to conclude that the comparison between BLA and O vi line widths remains inconclusive. Two of the six broad Ly /O vi systems occur in the line of sight towards H 1821+643. This sight line exhibits a overabundance of intervening O vi systems compared to other low-z lines of sight (see Savage et al. 2002; Tripp, Savage, & Jenkins 2000). However, we here find that the H 1821+643 sight line is not particularly rich in broad Ly candidate systems, when compared to PG 0953+415, PG 1116+215, and PG 1259+593.
| log | log | log (H) a | Status b | |
| H 1821+643 | ||||
| 0.02642 | 5.20 | 5.25 | 18.49 | |
| 0.12221 | 5.07 | 5.00 | 18.23 | |
| 0.16352 | 5.27 | 5.39 | 18.58 | |
| 0.18047 | 5.22 | 5.30 | 18.51 | |
| 0.22616 | 5.24 | 5.33 | 18.80 | |
| 0.26659 | 5.10 | 5.05 | 18.70 | |
| PG 0953+415 | ||||
| 0.02108 | 5.41 | 5.65 | 18.77 | tentative |
| 0.04382 | 5.13 | 5.11 | 18.45 | |
| 0.09315 | 5.06 | 4.98 | 18.64 | |
| 0.10294 | 5.95 | 6.55 | 19.87 | tentative |
| 0.17982 | 5.10 | 5.06 | 18.30 | |
| 0.19142 | 5.06 | 4.98 | 18.45 | tentative |
| 0.19360 | 4.99 | 4.83 | 18.74 | |
| PG 1116+215 | ||||
| 0.01635 | 5.15 | 5.16 | 18.55 | |
| 0.04125 | 5.82 | 6.35 | 19.59 | tentative |
| 0.06072 | 5.27 | 5.38 | 18.66 | |
| 0.06244 | 5.55 | 5.91 | 19.09 | |
| 0.08587 | 5.21 | 5.28 | 18.18 | tentative |
| 0.09279 | 6.03 | 6.66 | 20.05 | tentative |
| 0.13370 | 5.62 | 6.03 | 19.30 | tentative |
| PG 1259+593 | ||||
| 0.00229 | 5.03 | 4.91 | 18.48 | |
| 0.00440 | 6.09 | 6.74 | 20.39 | tentative |
| 0.00505 | 5.29 | 5.44 | 18.88 | tentative |
| 0.01347 | 5.81 | 6.34 | 19.58 | tentative |
| 0.04250 | 5.00 | 4.84 | 17.90 | tentative |
| 0.05586 | 6.10 | 6.76 | 20.22 | tentative |
| 0.06810 | 5.66 | 6.10 | 19.24 | tentative |
| 0.08041 | 5.02 | 4.90 | 17.87 | |
| 0.09196 | 5.89 | 6.45 | 19.58 | tentative |
| 0.10281 | 6.37 | 7.10 | 20.51 | tentative |
| 0.13351 | 5.14 | 5.14 | 18.15 | tentative |
| 0.14034 | 5.29 | 5.42 | 18.48 | tentative |
| 0.14381 | 5.91 | 6.48 | 19.66 | tentative |
| 0.14852 | 5.03 | 4.91 | 18.82 | |
| 0.15136 | 5.41 | 5.65 | 18.97 | |
| 0.16647 | 5.72 | 6.19 | 19.53 | tentative |
| 0.17148 | 6.02 | 6.64 | 19.89 | tentative |
| 0.17891 | 5.77 | 6.26 | 19.55 | tentative |
| 0.18550 | 5.65 | 6.08 | 19.26 | tentative |
| 0.22861 | 4.99 | 4.83 | 18.30 | |
| 0.24126 | 5.68 | 6.12 | 19.53 | |
| 0.28853 | 5.48 | 5.78 | 19.12 | tentative |
| 0.30906 | 5.09 | 5.04 | 18.24 | tentative |
| 0.31682 | 5.06 | 4.96 | 18.01 | tentative |
| 0.31978 | 5.52 | 5.85 | 19.84 | |
| 0.32478 | 5.11 | 5.07 | 18.31 | tentative |
| 0.37909 | 5.49 | 5.80 | 19.16 | tentative |
| 0.38266 | 6.38 | 7.12 | 21.04 | tentative |
| 0.41786 | 5.19 | 5.23 | 18.48 | tentative |
a Total hydrogen column densities are derived under the assumption
that the gas is in collisional ionization equilibrium (i.e., additional photoionization
is not considered).
b The tentative status implies that the BLA, although clearly detected,
may not qualify as a single-component Gaussian broadened
absorber for the reasons given in Table 2.
4.3 CIE properties of the BLAs
Despite the remaining uncertainty about the interpretation of the the observed line widths of BLAs and the uncertain contribution of photoionization, we now want to estimate the total gas content of these absorbers assuming the ideal case in which the lines are predominantly thermally broadened while the gas is in collisional ionization equilibrium. We use the measured values and H i column densities from our STIS sample together with equations (2) and (3) to derive the total hydrogen column density, (H), in these systems. In Table 4 we have listed for each of the 49 BLA candidates values for log , log , and log (H). The BLAs cover a temperature range from to K for pure thermal broadening, and the resulting total hydrogen column densities span a range from to cm-2. All of the very broad systems with km s-1 are considered to be tentative detections (see Table 4), so that the validity of the highest column density systems is particularly critical.
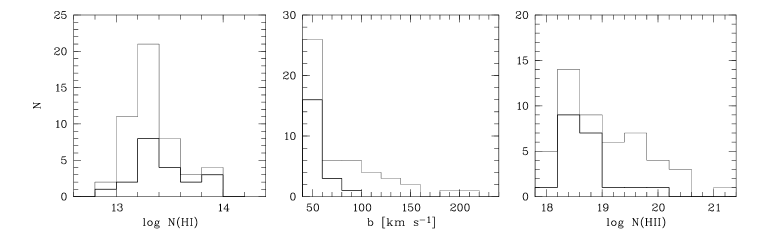
4.4 Distribution of hydrogen column densities and values
In Fig. 6 we show the distribution of H i column densities, values, and (estimated) ionized hydrogen column densities ((H ii) for our BLA sample. Thin lines indicate the distribution for the entire candidate sample (49 absorbers), the thick lines indicate the distribution for the secure cases (20 absorbers). The H i column density distribution (Fig. 6, left panel) peaks in the range log (H i). No system with log (H i) has been found, demonstrating that the neutral gas content of these absorbers is generally low. Note that for log (H i) our sample is incomplete due to the limited sensitivity in the lower S/N regions of the spectra. Only a few systems are observed in this range, but it is probable that the intrinsic broad Ly number distribution rises further towards the low-column density end. The value distribution of the BLAs (Fig. 6, middle panel) is strongly peaked at km s-1 and shows a tail towards higher values. The value distribution is difficult to interpret, as there are various selection effects that have to be taken into account. First of all, our sample is incomplete for higher values. Since the sensitivity to detect broad Ly lines scales with (see equation 4), we preferentially detect narrow lines rather than broad lines for a given column density level. It is probable that a considerable fraction of very broad lines lie below our detection limit and do not show up in the value distribution shown in Fig. 6. Secondly, if non-thermal line broadening mechanisms such as peculiar gas motions are important also for the Ly forest lines, we expect to find a number of lines from the photoionized Ly shifted into the value regime between and km s-1. Such lines may significantly contaminate our broad Ly sample at low values, whereas the contamination should be less severe at higher values. The number of WHIM absorbers with values km s-1 shown in Fig. 6 thus may be overestimated. At the sensitivity of the current data, we should be able to detect very broad ( km -1) Ly absorption toward H 1821+643, and possibly PG 0953+415 down to a level of log and , respectively. However, all except one of the Ly lines detected in these two directions have km -1. This result stands in stark contrast to the PG 1116+215 and PG 1259+593 sight lines, for which several lines with km -1 are found. Differences in the number of very broad Ly absorbers for the four sight lines might be caused by geometrical effects resulting from the intersection of the cosmic web filaments at different angles. If so, this would imply that the line broadening is dominated by flows within the filaments or by projection effects. Alternatively, the four sight lines may intersect regions of the web with very different physical conditions, in which case the line-width differences may be dominated by the temperature of the gas. Distinguishing between these two possibilities will require observations of a larger number of sight lines to construct a complete line width frequency distribution for absorbers in a wide variety of cosmic web environments.
In Fig. 6, right panel, we show the distribution of the ionized hydrogen column density, (H ii), as estimated for each BLA candidate from equations (2) and (3) (see Sect. 4.3 and Table 4). If our estimate for (H ii) is at least roughly correct, most of the detected WHIM BLA candidates have total gas column densities between cm-2. Only three of the securely detected systems have column densities larger than cm-2, while for the more uncertain cases the relative fraction of systems at these column densities is significantly higher. This is because high (H ii) systems are expected to have the highest temperatures and thus the lowest neutral gas content. As these systems will be particularly broad and shallow, they are most difficult to detect. Therefore, our sample is incomplete for total gas column densities cm-2.
4.5 Broad Ly absorbers and structures along the line of sight
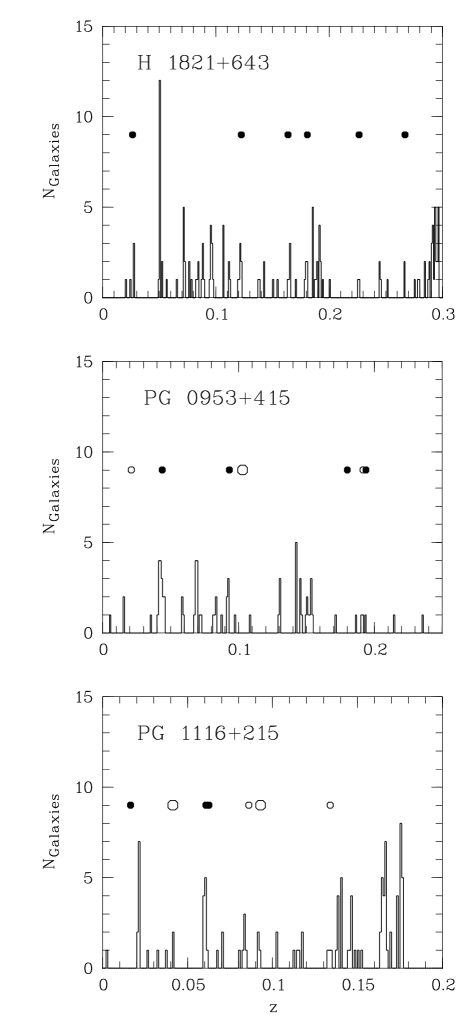
Important information about the origin of the broad Ly absorption can be obtained by comparing the redshift distribution of BLAs with that of galactic structures along the individual lines of sight. For the lines of sight toward H 1821+643, PG 0953+415, and PG 1116+215 redshift information about nearby galaxies is available from previous studies (Tripp, Lu, and Savage 1998; Savage et al. 2002). These galaxy-redshift data have been obtained with the m WIYN telescope on Kitt Peak, using the multi-object fiber spectrograph (HYDRA). The measurements provide redshift information for galaxies in a field of size around each quasar. Unfortunately, the completeness of these galaxy redshift surveys varies substantially among the different sight lines, mostly due to the varying stellar contamination. However, within of each quasar, the survey is percent complete for objects with (see Tripp, Lu, and Savage 1998). In Fig. 7 we compare the redshift distribution of our BLA candidates to the distribution of galaxies along the lines of sight towards H 1821+643, PG 0953+415, and PG 1116+215 within a radius of from the QSO. From a visual inspection of Fig. 7 it appears that BLAs are loosely correlated with the occurrence of galaxies along the redshift path. One or more galaxies are present within a velocity radius of 3000 km s-1 around each BLA candidate. However, in contrast to the O vi absorbers (e.g., Sembach et al. 2004) the BLAs do not appear to be significantly clustered around the peaks of the galaxy-redshift distribution. This suggests that the BLAs also trace only mildly overdense WHIM filaments in the vicinity of individual galaxies, whereas the O vi systems may be more closely related to higher density gas in galaxy groups. However, we may have missed broad systems that are part of more complex multi-component absorbers, as we have restricted our sample to single-component systems. Since multi-component systems most likely arise preferentially in the vicinity of individual galaxies and galaxy groups due to the more complex gas distribution in these environments, our BLA sample is biased against WHIM absorbers close to galaxies and galaxy groups. Therefore, the observed weak correlation between BLAs galaxies may simply be a result of our BLA selection criteria. Additional galaxy-redshift data for other lines of sight (e.g., PG 1259+593) will be required to improve the statistics and to investigate the relation between BLAs and galaxies in more detail.
4.6 Estimate for
Following equation (5), the total hydrogen column densities derived for each of the detected BLA candidates toward H 1821+643, PG 0953+415, PG 1116+215, and PG 1259+593 (Table 4) allow us to estimate the baryon content of the broad Ly absorbers. As discussed earlier in this paper, there is strong evidence that a significant fraction of the detected BLA candidates have origins other than the WHIM, and that the -value distribution of the WHIM H i absorbers is affected also by non-thermal broadening processes. Moreover, we have shown that photoionization from the UV background may significantly influence the ionzation fraction in the BLAs. However, as it is impossible to reliably quantify the contamination from these alternative processes, we now want to provide an estimate for (WHIM) assuming the ideal case (i.e., without any contamination and without photoionization). Summing over the hydrogen column densities, log (H), listed in Table 4, we obtain a total hydrogen column density of log (H) for the reliably detected systems, and a value of log (H) including the tentative systems. The total path length to detect BLA along the four lines of sight is (see Sect. 4.1 and Table 5). From equation (6) we then derive (BLA) considering only the 20 reliable cases and (BLA) for all 49 BLA candiates. Estimates for (BLA) for each individual sight line are listed in the last column of Table 5. Current cosmological models favour a value for of , and the contribution from the WHIM to at is expected to be percent (e.g., Dav\a’e et al. 2001), so that (WHIM) is predicted in the local Universe. The value for (BLA) derived from the restricted sample therefore is percent of the expected contribution from the WHIM to . This is slightly higher than the contribution from intervening O vi absorbers ((O vi) ; Danforth & Shull 2005; Sembach et al. 2004). The estimate from the entire BLA candidate sample, however, exceeds the expected value for (WHIM) by a factor of . The reason for this is that the by far dominating contribution to (BLA) comes from the very broad lines, which are exclusively tentative detections. The reliability of these few very broad features is very uncertain, and the unrealistically high value for (BLA) from these systems indeed implies that a considerable fraction of these features probably are not related to hot gas in the WHIM. Note that broad lines with km s-1 make up percent of the baryon content in the total sample, although they contribute only with percent to the total number of absorbers. If we take non-thermal broadening processes and additional photoionization into account, we believe that our estimate of (BLA) from the limited data sample represents a realistic lower limit for the baryon content of broad Ly systems at low for a detection threshold of log .
5 Summary
| Sight line | S/N a | log b | (BLA) c | |||||
|---|---|---|---|---|---|---|---|---|
| [] | ||||||||
| H 1821+643 | ||||||||
| PG 0953+415 | ||||||||
| PG 1116+215 | ||||||||
| PG 1259+593 | ||||||||
| Total |
a Typical S/N per resolution element ( km s-1).
b Typical detection limit for BLAs. is in units cm-2,
in units km s-1.
c Estimates for (BLA) are calculated assuming pure thermal broadening for the BLAs and
collisional ionization equilibrium.
d Plain numbers refer to the restricted BLA candidate sample, numbers put in parentheses refer to
the total BLA candidate sample (including the tentative cases).
In this paper we have studied intervening broad Ly absorbers at low redshifts that probably trace large amounts of baryonic matter hidden in the warm-hot intergalactic medium (WHIM) at temperatures between and K. In ionization equilibrium a very small fraction (, typically) of the hydrogen in the WHIM is expected to be neutral. Depending on parameters like the gas temperature and the total gas column density, a certain fraction of this neutral gas should be detectable as thermally broadened Ly absorption at column densities log (H i) and km s-1. Given the limitations in sensitivity for detecting very broad and shallow absorption features in currently existing STIS data, it becomes clear that only certain regions of the WHIM (those with relatively low temperatures and high total gas column densities) can be traced with broad Ly absorption. If the gas is in CIE and if thermal broadening dominates, one can directly estimate the baryon content of WHIM broad Ly absorbers (BLAs) from the measured H i line widths and column densities. However, the CIE hypothesis probably is only a poor approximation for low-density absorbers, so that the estimated ionization fractions are uncertain by up to 50 percent. In addition, the interpretation of BLA line widths is complicated, as non-thermal broadening processes like peculiar gas motions, macroscopic turbulence, the Hubble flow, as well as noise features and continuum undulations potentially mimic some of the broad absorption features attributed to the WHIM. Therefore, every WHIM filament that contains sufficient amounts of neutral hydrogen will produce broad Ly absorption, but conversely, not every broad spectral feature observed in QSO spectra is related to the WHIM. Due to the non-thermal broadening processes, we expect that the error rate for detecting the WHIM with broad Ly absorption may be as high as 50 percent and that for true WHIM BLAs the baryon content may be overestimated when relying solely on the observed value distribution. However, it is clear that BLA systems represent an important baryon reservoir in the local Universe. Thus, their frequency in high-resolution QSO spectra and their physical properties should be studied to the greatest extent possible.
Our analysis of the two STIS spectra of H 1821+643 and PG 0953+415 has resulted in the detection of 14 broad Ly absorber candidates with log (H i) and km s-1 along a total (unblocked) redshift path of . These measurements complement previous analyses of broad Ly absorption towards PG 1259+593 (Richter et al. 2004) and PG 1116+215 (Sembach et al. 2004). Considering all four lines of sight, we find 20 reliably detected BLA systems and additional 29 tentative cases along a total redshift path of . With detected BLA candidate systems, the number of systems per unit redshift is . Most of these systems have H i column densities between log and values km s-1. Assuming CIE and pure thermal line broadening, the total hydrogen column density in these absorbers typically ranges between log . Unfortunately, most of the systems that have relatively high total hydrogen column densities log (and thus the largest baryon content) belong to the tentative detections, and thus are highly uncertain.
Five of the stronger BLA systems show associated broad Ly absorption. The presence of broad Ly is of great help to assure that the H i absorption in these systems is indeed intrinsically broad and not caused by noise features and continuum undulations. Six BLA candidate systems show associated O vi absorption. In all cases, the O vi absorption shows a velocity offset compared to the H i absorption. Moreover, in two out of three cases the measured O vi values are incompatible with the values measured for H i, possibly implying unresolved component structure and non-thermal line broadening. However, as it is not clear whether or not the BLAs and the O vi systems trace the same gas phase, the comparison between these two WHIM absorber types remains inconclusive. If we consider only the 20 reliably detected BLA candidates, their baryon content sums up to a value of (BLA) (assuming CIE), which is percent of what is expected to be the contribution of the WHIM to at and about 30 percent more than what is estimated for intervening O vi systems. If we include the tentative detections we derive a high value for (BLA) of , suggesting that a fair number of these tentative detections are not related to hot gas in the WHIM but rather are caused by noise features and non-thermal line broadening. These findings demonstrate that it is quite difficult to exactly pinpoint the baryon budget of the BLAs with currently existing STIS data. Next to the BLAs that are not related to the WHIM, the possible overestimate of (BLA) due to non-thermal line broadening and, conversely, the possible underestimate of (BLA) due to photoionization effects further complicate the situation. However, we believe that the value of (BLA) is a reliable lower limit for the baryon content of BLAs that lie above a detection limit of log . Our study therefore suggests that broad Ly absorbers arising in WHIM filaments contain a significant fraction of the baryons at .
The BLAs represent an excellent way of studying the baryonic content of WHIM gas in the temperature range from to K. Although there are substantial complications associated with the separation of the thermal and non-thermal broadening components and the uncertain role of photoionization, the fact that the baryon-content estimate does not require knowledge of the metallicity of the gas is a major advantage for using the BLAs when determining the distribution and baryonic content of the WHIM. A better understanding of these systems will require additional high-resolution ultraviolet spectroscopic observations and detailed comparisons with models of the hydrodynamical evolution of the gas. Observations of the BLAs with the Hubble Space Telescope Cosmic Origins Spectrograph (HST/COS) and future ultraviolet spectroscopic facilities may be the only direct way of probing low-metallicity regions in the cosmic web. Comparing the frequency of observed BLAs with values of predicted by the simulations would help to constrain the hot gas content of the web and test the importance of WHIM heat sources other than gravitational collapse of the web filaments (i.e., galactic feedback by supernovae). Next to the important future X-ray observations of the WHIM in emission and absorption, spectral imaging of the Ly emission over large enough fields of view to quantify the morphology of the WHIM gas would provide strong tests of the formation of large-scale gas structures and their relationship to galaxies. The WHIM Ly and metal-line emission is expected to be faint but could be observed with a moderate cost observatory designed for such an investigation (see Sembach et al. 2005b for one such mission concept).
Acknowledgements.
P.R. acknowledges financial support by the German Deutsche Forschungsgemeinschaft, DFG, through Emmy-Noether grant Ri 1124/3-1. B.D.S. acknowledges financial support from NASA grant HST-GO-09184.03-A.References
- (1) Cen, R., & Ostriker, J. 1999, ApJ, 514, 1
- (2) Chen, H.-W., & Prochaska, J.X. 2000, ApJ, 543, L9
- (3) Danforth, C.W., & Shull, J.M. 2005, ApJ, 624, 555
- (4) Davé, R., Hernquist, L., Weinberg, D.H., & Katz, N. 1997 ApJ, 477, 21
- (5) Davé, R., & Tripp, T.M. 2001, ApJ, 553, 528
- (6) Davé, R., Cen, R., Ostriker, J., et al. 2001, ApJ, 552, 473
- (7) Fang, T., & Bryan, G.L. 2001, ApJ, 561, L31
- (8) Fang, T., et al. 2005, ApJ, 623, 612
- (9) Ferland, G.J., Korista, K.T., Verner, D.A., Fergueson, J.W., Kingdon, J.B., & Verner, E.M. 1998, PASP, 110, 761
- (10) Fontana, A., & Ballester, P. 1995, ESO Messenger, 80, 37
- (11) Fukugita, M. 2003, astro-ph 0312517
- (12) Kawahara, H., et al. 2005, astro-ph 0504594
- (13) Mathur, S., Weinberg, D.H., & Chen, X. 2003, ApJ, 582, 82
- (14) Mazzotta, P., Mazzitelli, G., Colanfrancesco, S., & Vittorio, N. 1998, A&AS, 133, 403
- (15) Morton, D.C. 2003, ApJS 149, 205
- (16) Nicastro, F., et al. 2005, Nature, 433, 495
- (17) Oegerle, W.R., et al. 2000, ApJ, 538, L23
- (18) Penton, S.V., Stocke, J.T., & Shull, J.M. 2004, ApJS, 152, 29
- (19) Richter, P., Savage, B.D., Tripp, T.M., & Sembach, K.R. 2004, ApJS, 153, 165
- (20) Savage, B.D., Sembach, K.R., Tripp, T.M., & Richter, P. 2002, ApJ, 564, 631
- (21) Savage, B.D., Lehner, N., Wakker, B.P., Sembach, K.R, & Tripp, T.M. 2005, ApJ, 626, 776
- (22) Sembach, K.R., Tripp, T.M., Savage, B.D., & Richter, P. 2004, ApJS, 155, 351
- (23) Sembach, K.R., et al. 2005a, in preparation
- (24) Sembach, K.R., et al. 2005b, ”The Baryonic Structure Probe: Characterizing the Cosmic Web of Matter Through Ultraviolet Spectroscopy”, an Origins Probe concept study submitted to NASA, May 13, 2005
- (25) Sutherland, R.S., & Dopita, M.A. 1993, ApJS, 88, 253
- (26) Tripp, T.M., Lu, L., & Savage, B.D. 1998, ApJ, 508, 200
- (27) Tripp, T.M., & Savage, B.D. 2000, ApJ, 542, 42
- (28) Tripp, T.M., Savage, B.D., & Jenkins, E.B. 2000, ApJ, 534, L1
- (29) Tripp, T.M., Giroux, M.L., Stocke, J.T., Tumlinson, J., & Oegerle, W.R. 2001, ApJ, 563, 724
- (30) Tripp, T.M., et al. 2005, in preparation
- (31) Valageas, P., Schaeffer, R., & Silk J. 2002, A&A, 388, 741
- (32) Woodgate, B.E., et al. 1998, PASP, 110, 1183