751
11email: bs@astro.keele.ac.uk
Different convection models in ATLAS
Abstract
Convection is an important phenomenon in the atmospheres of A-type and cooler stars. A description of convection in ATLAS models is presented, together with details of how it is specified in model calculations. The effects of changing the treatment of convection on model structures and how this affects observable quantities are discussed. The role of microturbulence is examined, and its link to velocity fields within the atmosphere. Far from being free parameters, mixing-length and microturbulence should be constrained in model calculations.
keywords:
Convection, Turbulence, Line: profiles, Stars: atmospheres, Stars: late-type1 Introduction
The gross properties of a star, such as broad-band colours and flux distributions, are significantly affected by the effects of convection in stars. Consequently, our modelling of convection in stellar atmosphere models can significantly alter our interpretation of observed phenomena.
1.1 Mixing-Length Theory
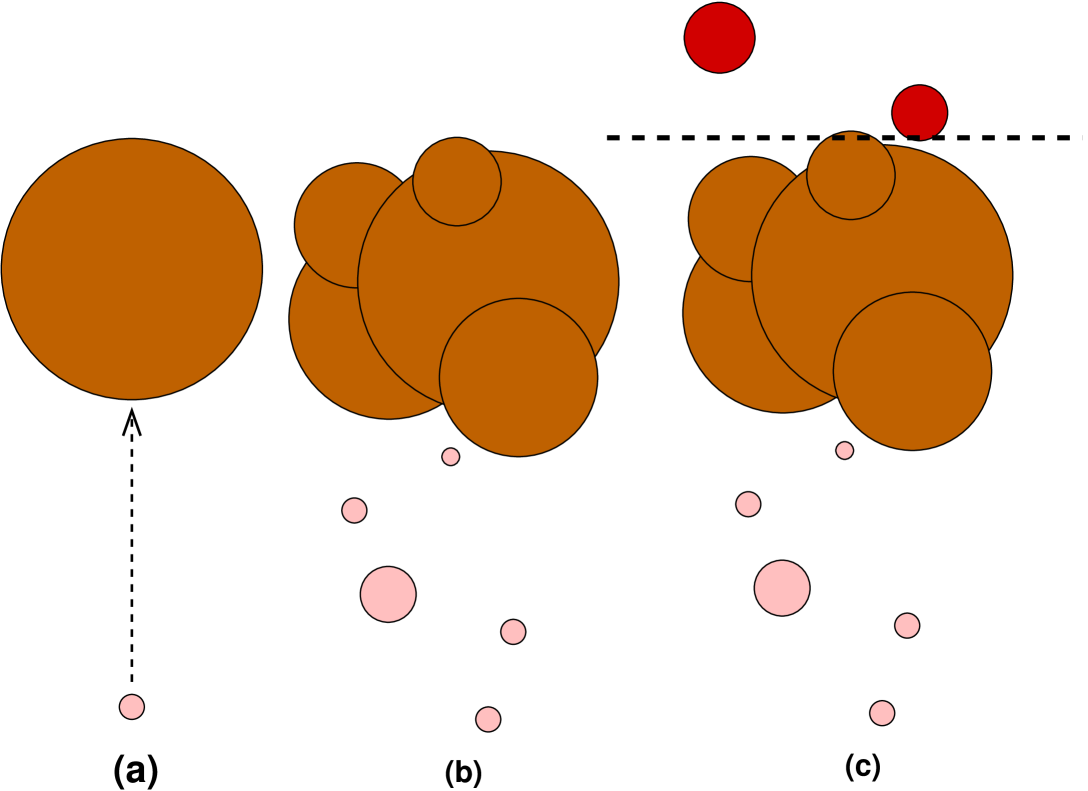
Convection in stellar atmospheres is usually based on mixing-length theory (MLT) of Böhm-Vitense (1958). In this model a single bubble of gas rises a certain mixing-length () before dispersing (Fig. 1a). The problems with this theory is that it is clearly too simple and that the mixing-length is a totally free parameter. In their discussion of the ATLAS6 models Relyea & Kurucz (1978) found discrepancies between theoretical and observed colours which might be the result of inappropriate treatment of convection within the models. Subsequently, several attempts have been undertaken to improve the situation. Lester et al. (1982), for example, introduced “horizontally averaged opacity” and a “variable mixing length” which improved the match with observed colours, but did not remove all the discrepancies.
1.2 The Canuto & Mazzitelli (CM) Model
Canuto & Mazzitelli (1991, 1992) proposed a turbulent model of convection in order to overcome one of the most basic short-comings of MLT, namely that a single convective element (or “bubble” or “eddy”) responsible for the transport of all the energy due to convection. This new model accounts for eddies of various sizes that interact with each other (Fig. 1b). The CM convection model was implemented in the ATLAS9 code by Kupka (1996) and has no user adjustable free parameters. An improved variant is the self-consistent (CGM) method of Canuto et al. (1996).
1.3 Convective Overshooting
Convective bubbles rise above the convections zone into the stable regions (Fig. 1c). This is called overshooting, and should be present in our model atmosphere calculations. The ATLAS9 models introduced an “approximate overshooting” which has not been without its critics (see Castelli et al. 1997 for full details). The following quote from Kurucz’ web site is aptly summarizes the situation:
convective models use an overshooting approximation that moves flux higher in the atmosphere above the top of the nominal convection zone. Many people do not like this approximation and want a pure unphysical mixing-length convection instead of an impure unphysical mixing-length convection
1.4 Atmospheric Structure

At = 8000K, CM gives essentially radiative temperature gradient with significantly less convective flux than MLT, while approximate overshooting introduces flux into higher layers (Heiter et al., 2002). Figure 2 shows the situation for slightly cooler models (=7000 K). The CM model remains close to the radiative temperature gradient. MLT gives more convective flux than CM, even when = 0.5. Overshooting produces an excess of convective flux in higher layers, which produces a noticeable bump in the temperature-depth relation compared to MLT without overshooting.
2 The ATLAS CONVECTION Card
A single control card specifies how the treatment of convection within ATLAS.
If the card is not present in the ATLAS input, convection is turned off. A couple of variables have default values which should be noted: mixing-length MIXLTH = 1 and amount of overshooting OVERWT = 1.
-
CONVECTION OFF
Ensures that convection is turned off for the model calculation. Note that this sets MIXLTH to 1, but leaves OVERWT unchanged.
-
CONVECTION ON MIXLTH
Turns on convection within the model calculation. The value of mixing-length MIXLTH is set to the user specified value, but OVERWT is not modified. Hence OVERWT will be the default value of 1 and approximate overshooting is enabled by default.
-
CONVECTION OVER MIXLTH OVERWT
This variant of the control card, which allows full control over approximate convective overshooting. See Castelli et al. (1997) for details of convective overshooting.
Note that setting OVERWT = 0 turns off approximate overshooting.
-
CONVECTION OVER MIXLTH OVERWT NCONV
ATLAS puts the constraint that the convective flux () must be zero above layer NRHOX/2 (i.e. higher than the middle layer in the model atmosphere desk) This was originally introduced to remove numerical artifacts. The value is usually a good number, except for coolest models, where constraint generates a jump in T() for 4000K (Castelli, 2005). In order to alleviate this problem, NCONV introduced into a version of ATLAS by Castelli to allow user to specify the layer above which is surely zero. The default value is 36. This is NRHOX/2 for NRHOX = 72 which is typical number of layers used in a model calculation.
2.1 The CM and CGM routines
Drop-in replacements for the CONVEC and TCORR subroutines were implemented by Kupka (1996).
Usage is similar to standard ATLAS version: CONVECTION ON MIXLTH. However, there are differences depending on whether the CM or CGM routines are used:
- CM
-
In this case MIXLTH not actually used, but must be set to 0 in order for the routine to work correctly. This is to ensure that rest of the ATLAS codes knows that convection is running.
- CGM
-
Here MIXLTH has the meaning of * (see Canuto et al. 1996 for details). The standard value used is 0.09.
3 Testing convection models
None of the current 1d models of convection are totally satisfactory. 2d and 3d numerical simulations are producing impressive results (Freytag & Steffen, 2004), as are improved analytical 1d treatments (Kupka, 2004). However, in order to be confident that the current generation of ATLAS models are producing reliable results, we need to know how good the treatment of convection is in ATLAS and the limitations.
3.1 uvby photometry
Smalley & Kupka (1997) compared the predicted colours for the CM model with that from the standard ATLAS9 MLT models with and without “approximate overshooting”. Comparison against fundamental and stars revealed that the CM models gave better agreement than MLT without overshooting. Models with overshooting were clearly discrepant. This result was further supported by stars with obtained from the Infrared Flux Method (IRFM) and from stellar evolutionary models. However, some discrepancies still remained, including a “bump” around 6500 K in the obtained for the Hyades and continued problems with the Strömgen index. Similar conclusions were found by Schmidt (1999) using Geneva photometry.
3.2 The index
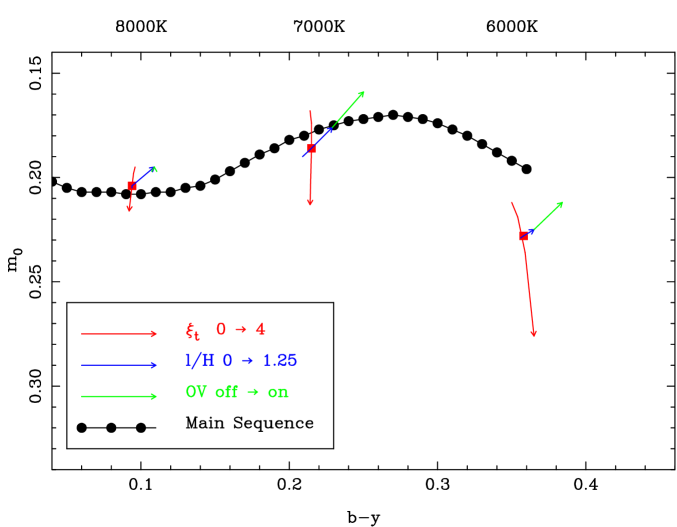
The index is sensitive to metallicity and microturbulence, but also convection efficiency (Relyea & Kurucz, 1978; Smalley & Kupka, 1997). Inefficient convection (CM and MLT 0.5) clearly works in the domain of the A stars down to 0.20 (7000 K, F0). For cooler stars, convection becomes more efficient and substantive within the atmosphere and higher values of mixing-length and lower microturbulent velocities would be required to fit the observed indices of the main sequence (Fig. 3). The 2d numerical radiation hydrodynamics calculations of Ludwig et al. (1999) indicate a rise in mixing-length from 1.3 at 7000 K to = 1.6 for the Sun (5777 K), while a much lower 0.5 was found at 8000 K (Freytag, 1995). This is in agreement with that implied by index. However, around 6000 K there still remains a significant discrepancy, which could only be reduced by invoking the approximate overshooting option (Fig. 3). None of the convection models used in classical model atmospheres allows for the reproduction of the index, unless and the amount of “approximate overshooting” are varied over the H-R Diagram.
3.3 Stellar Fluxes
The stellar flux distribution is influenced by the effects of convection on the atmospheric structure of the star. As we have seen with photometric colours, these effects have a clearly observable signature. Hence, high-precision stellar flux measurements should provide significant and useful information on convection.
Lester et al. (1982) presented a study of convective model stellar atmospheres using a modified mixing-length theory. They found small, systematic differences in the optical fluxes. Their figures also demonstrate that convection can have a measurable effect on stellar fluxes.
Figure 4 shows the effect of changing mixing length from 0, through 0.5 to 1.25 on the emergent flux for solar-composition models with =7000 K, = 4.0 and = 2 . The differences are noticeable, with the effect of overshooting being considerable.

3.4 Balmer line profiles
The temperature sensitivity of Balmer lines makes them an excellent diagnostic tool for late A-type stars and cooler (Gardiner, 2000). However, as emphasised by van’t Veer & Mégessier (1996), the and profiles behave differently due to convection: is significantly less sensitive to mixing-length than . Both profiles are, nevertheless, affected by the presence of overshooting, with being more influenced than (Fig. 5). Since is formed higher in the atmosphere than , Balmer lines profiles are a very good depth probe of stellar atmospheres. Naturally, Balmer profiles are also affected by microturbulence, metallicity and, for the hotter stars, surface gravity (Heiter et al., 2002).

4 Microturbulence
Microturbulence is a free parameter introduced to allow abundances from weak and strong lines to agree. It is an extra source of broadening, which is added to thermal broadening of stellar lines. Physically, it is postulated as small-scale turbulent motions within the atmosphere, where the size of the turbulent elements is less than the unit optical depth (Gray, 1992).
Microturbulence does appear to vary with effective temperature. Several studies have found that microturbulence appears to vary systematically with (Chaffee, 1970; Nissen, 1981; Coupry & Burkhart, 1992; Gray et al., 2001). Fig. 6 shows the variation of with for near main-sequence stars ( 4.0) based on the results given by Gray et al. (2001). Microturbulence increases with increasing , peaking around mid-A type, before falling away to zero for B-type stars. There is a relatively abrupt change in behaviour between 6500 and 7000 K, which is related to the change from weak subsurface convection to the fully convective atmospheres of cooler stars.

| No convection | Weak convection | Strong convection | ||||
| (sub-surface) | (surface) | |||||
| 2km s-1 | 2-4 km s-1 | 1-2 km s-1 | ||||
| A0V | A5V | F0V | ||||
| 10 000 K | 8500 K | 7000 K | ||||
4.1 Line Asymmetries
Velocity fields are present in stellar atmospheres which can be measured using line bisectors (Dravins, 1987; Gray, 1992). Compared to solar-type stars, the line bisectors in A-type stars are reversed, indicating small rising columns of hot gas and larger cooler downdrafts (Landstreet, 1998). It is these motions that are thought to be responsible, at least in part, for the existence of microturbulence. In fact, 3d numerical simulations of solar granulation can account for observed line profiles without the need for any microturbulence (Asplund et al., 2000). Similar results have been found for Procyon (Gray, 1985; Allende Prieto et al., 2002), which is also a star with well-known physical parameters (e.g. Kervella et al. 2004).
Numerical simulations avoid the need for a microturbulence free parameter (Asplund et al., 2000). The microturbulence of 1d is not turbulent motions, but rather velocity gradients within the atmosphere. Hence, microturbulence should no longer a free parameter, but ought to be constrained within ATLAS model calculations. Infact, Kurucz presented an empirical method for constraining depth-dependent microturbuluce within ATLAS at this Workshop (Kurucz, 2005).
5 A Convection Recipe
Smalley (2004) presented a schematic variation of microturbulence and mixing length with for stars near the main sequence (Fig. 7). For stars hotter than A0 there is no convection or significant microturbulence. For the early A-type stars there is essentially no convection within the atmosphere, since the temperature gradient is radiative, but there are velocity fields as indicated by the modest microturbulence values. Velocity fields increase as we go through mid to late A-type stars, and inefficient convection is required within the atmosphere. Once convection becomes efficient (F-type and later) the value of microturbulence is found to drop, while the mixing-length increases.
6 Conclusions
The effects of convection on the stellar atmospheric structure can be successfully probed using a variety of observational diagnostics. The combination of photometric colours and Balmer-line profiles has given us a valuable insight into the nature of convection in stars. High quality observations that are currently available and those that will be in the near future, will enable further refinements in our theoretical models of convection and turbulence in stellar atmospheres.
Overshooting is still an issue to be resolved, since there are clearly velocity fields above the convection zone. While the “approximate overshooting” of Kurucz appears to have been discounted by observational tests, there is clearly the need for some sort of overshooting to be incorporated within model atmosphere calculations.
Acknowledgements.
The author would like to thank Fiorella Castelli and Friedrich Kupka for useful discussions on convection and its implementation within ATLAS.References
- Allende Prieto et al. (2002) Allende Prieto C., Asplund M., López, R.J.G., Lambert D.L., 2002, ApJ, 567, 544
- Asplund et al. (2000) Asplund M., Nordlund Å., Trampedach R., Allende Prieto C., Stein R.F., 2000, A&A, 359, 729
- Böhm-Vitense (1958) Böhm-Vitense E., 1958, ZA, 46, 108
- Canuto & Mazzitelli (1991) Canuto V.M., Mazzitelli I., 1991, ApJ, 370, 295
- Canuto & Mazzitelli (1992) Canuto V.M., Mazzitelli I., 1992, ApJ, 389, 724
- Canuto et al. (1996) Canuto V.M., Goldman I., Mazzitelli I., 1996, ApJ, 473, 550
- Castelli (2005) Castelli F., 2005, private communication
- Castelli et al. (1997) Castelli F., Gratton R.G., Kurucz R.L., 1997, A&A, 318, 841
- Chaffee (1970) Chaffee F.H., 1970, A&A, 4, 291
- Coupry & Burkhart (1992) Coupry M.F., Burkhart C., 1992, A&AS, 95, 41
- Dravins (1987) Dravins D., 1987, A&A, 172, 200
- Freytag (1995) Freytag B., 1995, Ph.D. Thesis, Universität Kiel
- Freytag & Steffen (2004) Freytag B., Steffen M., 2004, IAUS, 224, 139
- Gardiner (2000) Gardiner R.B., 2000, Ph.D. Thesis, University of Keele
- Gardiner et al. (1999) Gardiner R.B., Kupka F., Smalley B., 1999, A&A, 347, 876
- Gray (1985) Gray D.F., 1985, ApJ, 255, 200
- Gray (1992) Gray D.F., 1992, The observation and analysis of stellar photospheres, CUP.
- Gray et al. (2001) Gray R.O., Graham P.W., Hoyt S.R., 2001, AJ, 121, 2159
- Heiter et al. (2002) Heiter U., Kupka F., van’t Veer-Menneret C., Barban C., Weiss W.W., et al. 2002, A&A, 392, 619
- Kervella et al. (2004) Kervella P., Thévenin F., Morel P., Berthomieu G., Bordé P., Provost J., 2004, A&A, 413, 251
- Kupka (1996) Kupka F., 1996, ASP Conf., 44, 356
- Kupka (2004) Kupka F., 2004, IAUS, 224, 119
- Kurucz (2005) Kurucz R.L., 2005, this workshop.
- Landstreet (1998) Landstreet, 1998, A&A, 338, 1041
- Lester et al. (1982) Lester J.B., Lane M.C., Kurucz R.L., 1982, ApJ, 260, 272
- Ludwig et al. (1999) Ludwig H.-G., Freytag B., Steffen M., 1999, A&A, 346, 111
- Nissen (1981) Nissen P.E., 1981, A&A., 97, 145
- Philip & Egret (1980) Philip A.G.D., Egret D., 1980, A&AS, 40, 199
- Relyea & Kurucz (1978) Relyea L.J., Kurucz R.L., 1978, ApJS, 37, 45
- Schmidt (1999) Schmidt W., 1999, Master’s Thesis, Johannes Kepler University Linz, Austria
- Smalley (2004) Smalley B., 2004, IAUS, 224, 131
- Smalley & Kupka (1997) Smalley B., Kupka F., 1997, A&A, 293, 446
- Smalley et al. (2002) Smalley B., Gardiner R.B., Kupka F., Bessell M.S., 2002, A&A, 395, 601
- van’t Veer & Mégessier (1996) Van’t Veer C., Mégessier C., 1996, A&A, 309, 879