2Institut für Astrophysik, Universität Göttingen, Friedrich-Hund-Platz 1, D-37077 Göttingen, Germany
Internal kinematics of isolated modelled disk galaxies
We present a systematic investigation of rotation curves (RCs) of fully hydrodynamically simulated galaxies, including cooling, star formation with associated feedback and galactic winds. Applying two commonly used fitting formulae to characterize the RCs, we investigate systematic effects on the shape of RCs both by observational constraints and internal properties of the galaxies. We mainly focus on effects that occur in measurements of intermediate and high redshift galaxies. We find that RC parameters are affected by the observational setup, like slit misalignment or the spatial resolution and also depend on the evolution of a galaxy. Therefore, a direct comparison of quantities derived from measured RCs with predictions of semi-analytic models is difficult. The virial velocity Vc, which is usually calculated and used by semi-analytic models can differ significantly from fit parameters like Vmax or Vopt inferred from RCs. We find that Vc is usually lower than typical characteristic velocities derived from RCs. Vmax alone is in general not a robust estimator for the virial mass.
Key Words.:
Galaxies: kinematics and dynamics - Galaxies: spiral - Galaxies: structure1 Introduction
Spatially resolved rotation curves (RCs) are a fundamental tool to
study the internal kinematics and the distribution of mass in
spiral galaxies. The first discrepancy between the differential
kepler-type of rotation and the rotation of galaxies was detected
by Babcock (1939). These first indirect measurements of
non-luminous matter introduced the concept of dark matter (DM)
into astrophysics. An overview is given by Sofue and Rubin
(2001) and references therein.
An important application of RCs lies within a correlation of the
luminosity and the maximum rotational velocity of spirals found by
Tully & Fisher (1977). The physical origin of the slope and the
scatter of the TFR is still subject to debate. Different
theoretical approaches exist, which differ mainly in the
predictions of the redshift evolution of the TFR. Therefore,
Ziegler et al. (2002) and Böhm et al. (2004) used a sample of
field galaxies in the FORS Deep Field to study the TFR at
intermediate redshift. They find a significant change of slope in
comparison to local samples, mainly caused by small, star forming
distant galaxies. However, the measurement of rotational
velocities is more complicated in the case of distant, apparently
small
spirals.
In this work we investigate how parameters from models, describing
the shape of RCs, are influenced by observational constraints and
by internal properties of galaxies. Only techniques that take
these systematics into account, as e.g. the method presented in
Böhm et al. (2004), can get
robust results for Vmax.
In recent years, fully N-body/hydrodynamic simulations of spiral
galaxies became an important tool to understand the formation and
evolution of spiral galaxies (e.g. Mihos & Hernquist 1994;
Springel & Hernquist 2002). In these simulations cooling, stellar
feedback and galactic winds are taken into account to model
galaxies in a physically motivated way. Here, we extract RCs from
model galaxies simulated with GADGET2 (Springel 2005). We
investigate for intermediate and high redshift galaxies the
influence of large relative slit widths, inclinations and slit
misalignments on the determination of fitting parameters like
Vopt or Vmax. These parameters are commonly
used (e.g. Courteau 1997, Yegerova & Salucci 2004) as a measure
for the ’peak’ circular velocity, e.g. to determine Tully-Fisher
relations.
2 Simulations
Recently Kapferer et al. (2005) studied the influence of galaxy-interactions on the strength and evolution of the star formation rate of the interacting system. In this work we investigate the isolated model galaxies, presented in Kapferer et al. (2005). The initial conditions (hereafter ICs) of the model galaxies were built according to Springel et al. (2004), which is based on the work of Mo et al. (1998). The two model galaxies in this work are chosen such that they represent a Milky Way type and a small spiral galaxy without any bulge component. In Table 1 the properties of the ICs of the model galaxies are listed. The combined N-body/SPH simulation calculates then 5 Gyr of isolated evolution. For every time step we know the velocity of each particle and can hence extract realistic rotation curves.
| Properties | Galaxy A | Galaxy B |
|---|---|---|
| circular velocity 1 | 160 | 80 |
| disk mass fraction2 | 0.05 | 0.05 |
| gas content in the disk3 | 0.25 | 0.25 |
| disk thickness4 | 0.02 | 0.02 |
| total mass [] | 1.33x10¹² | 1.67x10¹¹ |
| disk scale length [kpc] | 4.51 | 2.25 |
1… circular velocity at
in km/s
2… fraction of disk
particles (stars/gas) in units of halo mass
3…
relative content of gas in the disk
4… thickness of the disk in units of radial scale
length
2.1 Rotation Curve Extraction
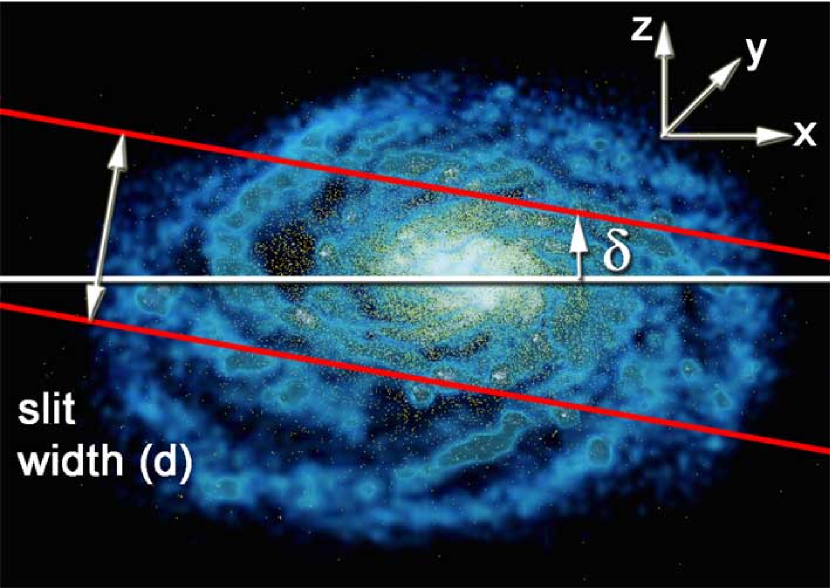
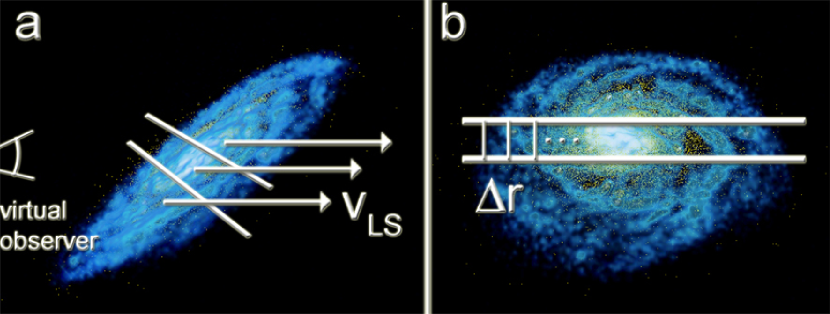
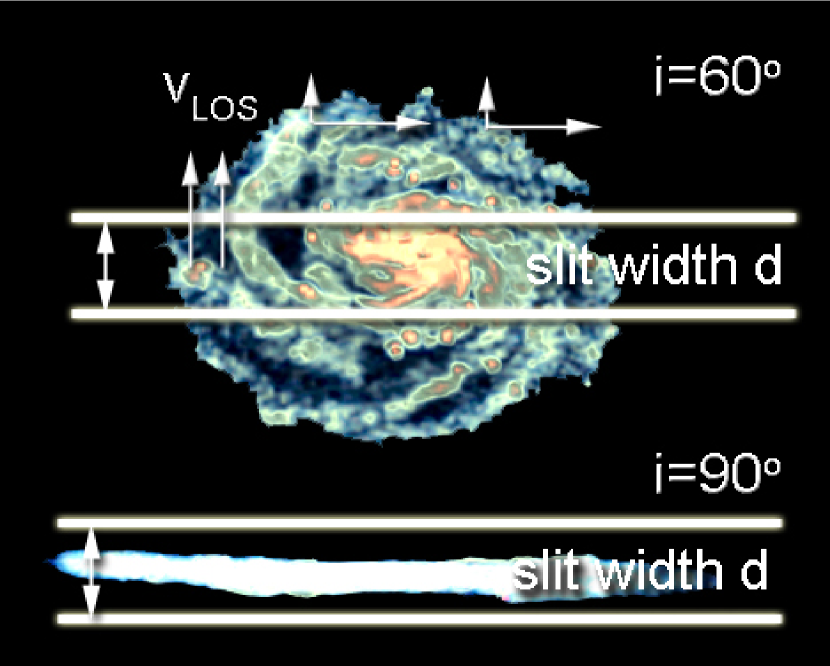
In order to extract the rotation curves (RCs) of our simulated model galaxies, we define a slit with a width d, see Fig. 1. In addition we allow for a misalignment angle to simulate rotations of the slit with respect to the major axis of the system. Such rotations sometimes occur in observations using multi-object spectroscopy. In Fig. 1 the different parameters for the slit are shown. The slit width d and the misalignment of the slit with respect to the major axis define the virtual slit. We extract the RCs from the velocity field of the gas in the following way. The velocity as a function of radius is determined by averaging over all line-of-sight velocities of gas particles in thin bins, with a bin size r along the slit and a side length d perpendicular to the spatial axis. In Fig. 2 the velocity field taken for the RC extraction is shown (a). In Fig. (b) the spatial sampling along the slit is sketched. An RC with a resolution of 0.1 kpc was extracted and used as a reference.
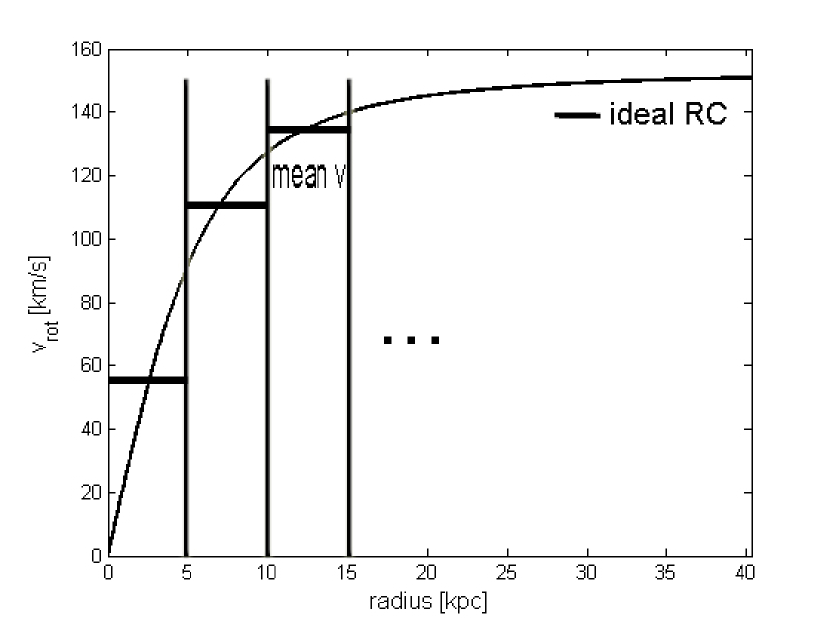
In order to determine systematic effects of large slit widths d (relative to the galaxy size), which occur in the case of observations of distant (z0.5) galaxies (e.g. Böhm et al. 2004) we vary d in a range of several kpc. Not only the relative slit width varies in observations of distant disk galaxies but also the sampling of the velocity field along the spatial axis (i.e. the spatial resolution). In order to simulate this finite spatial resolution we bin the reference RC with different bin sizes. In Fig. 3 we show the extraction of different RCs, corresponding to different spatial resolutions along the slit.
3 Results
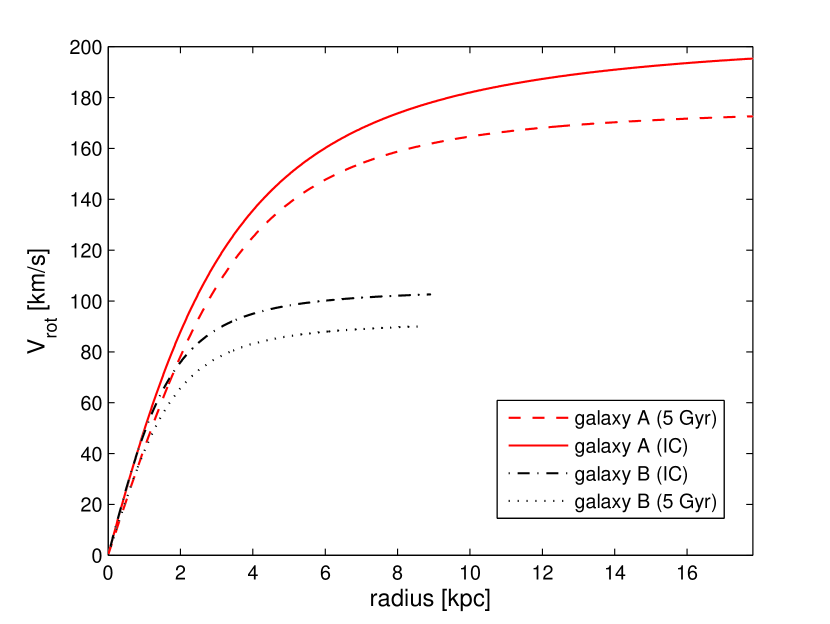
3.1 Rotation curves as a function of evolution
As a first step we investigate the RCs of the ICs and compare them to the RCs of the fully hydrodynamically treated galaxies after 5 Gyr of evolution. Note that the ICs are based on an analytic model introduced by Mo et al. (1998). The evolution starting from these ICs is determined by the influence of the dynamics, the star formation with feedback and stellar winds of the system. Therefore the RCs and other internal properties of the evolved galaxies do differ from those of the ICs. The general evolutionary trend of the RCs is presented in Fig. 4. The rotation curves were obtained by setting a slit width of 4 kpc (galaxy A) and 1 kpc (galaxy B) without any slit misalignment . The galaxies were inclined with an inclination angle of i=. A spatial resolution of 0.1 kpc was adopted to extract ideal RCs. It is clearly visible, that the rotational velocities get lower for the evolved galaxies. The decrease of the overall angular momentum of gas particles in the disk can be explained by mass ejection due to galactic winds and the rearrangement of the gas in the disk due to the fully hydrodynamic treatment as the disk rotates. As we want to investigate the dependencies on different observational constraints, e.g. galaxy alignment with respect to the spectroscopic slit or slit misalignment, we use hereafter models to describe the shape of the RC. Used in observational work are physically motivated fitting functions, like the universal rotation curve (URC) eq. 2 (Persic et al. 1996), or purely phenomenological fitting formulae like eq. 1 (Courteau 1997). Although we are aware that eq. 1 cannot reproduce the many observed declining RCs, it is suitable for our model galaxies, which do not decline in the outer parts. The RCs shown in Fig. 4 are best fits to the measured rotational velocities of the model galaxies using the fitting formula of Courteau (1997). This function is defined as
| (1) |
where r is the galactocentric distance and and are free fitting parameters. Clearly, with the general decrease of the rotational velocities also Vmax gets lower. The physically motivated URC (Persic et al. 1996) is a superposition of the velocity field of the DM halo and the disk. The URC can be expressed as follows
| (2) | |||||
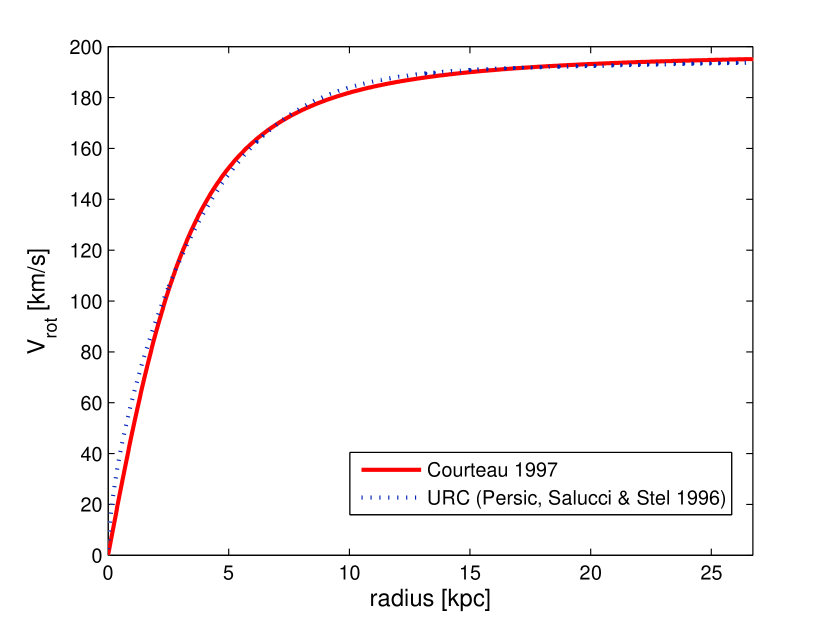
where , is the rotational velocity at (the reference scale, which for an exponential disc is 3.2) and the absolute blue luminosity of the galaxy. In Fig. 5 the URC fit to our data is shown together with the Courteau (1997) fit. Both functions represent the RCs of the model galaxies very well. Although we are aware that the Courteau fitting function has no physical justification, we use both functions to fit our data, in order to investigate the shape of the RC as a function of the observational setup, i.e. galaxy alignment and slit properties.
The fit parameters for eq. 1 and 2 with 95% confidence
level errors are listed in Table 2 and 3,
respectively. Note that no restrictions were set on the fit
parameters (Vmax, r0 and a for the Courteau
function and for the URC). The blue band luminosity
was estimated from the stellar mass assuming a stellar mass
to light ratio of 1.2 (mean from different star formation
histories in the redshift range , Dickinson et al.
2003). The luminosity at was adopted as
(Gabasch et al. 2004) this corresponds to
. We find values for on the range of
0.61-0.65 for model galaxy A and 0.075-0.08 for model galaxy B. An
evolution of , due to new forming stars in the galaxies,
can be seen. For the investigations of the RC as a function of
observational bias, we choose as an additional free
parameter, to get better
representations of the RCs.
Most present models of galaxy formation and evolution rely on the
work of Mo et al. (1998). Indeed, this model can reproduce
correctly the general shape of rotation curves, but galaxy
evolution can alter the RC. Note especially the differences
between Vc and Vmax/opt from tables
1, 2 and 3,
respectively. A comparison of semi-analytic models and
observations is generally complicated by the fact that
Vmax/opt is determined differently from Vc. In
the case of mass reconstruction via RCs the superposition of the
velocity field of the halo and the disk in the URC ansatz would be
the adequate approach.
| Fitting | Parameter | Galaxy A | Galaxy B |
|---|---|---|---|
| I | Vmax [km/s] | 205 | 105 |
| I | r0 [kpc] | 3.91 | 1.83 |
| I | a | 1.62 | 1.89 |
| II | Vmax [km/s] | 169.67 | 91.8 |
| II | r0 [kpc] | 4.6 | 2.05 |
| II | a | 3.39 | 2.14 |
I … initial
conditions
II … evolved galaxies (t=5 Gyr)
| Fitting | Parameter | Galaxy A | Galaxy B |
|---|---|---|---|
| I | Vopt [km/s] | 186.5 | 80.3 |
| I | L/L∗ | 0.61 | 0.075 |
| II | Vopt [km/s] | 183.2 | 91.1 |
| II | L/L∗ | 0.65 | 0.08 |
I … initial
conditions
II … evolved galaxies (t=5 Gyr)
3.2 Rotation curves as a function of the slit width for model galaxy A
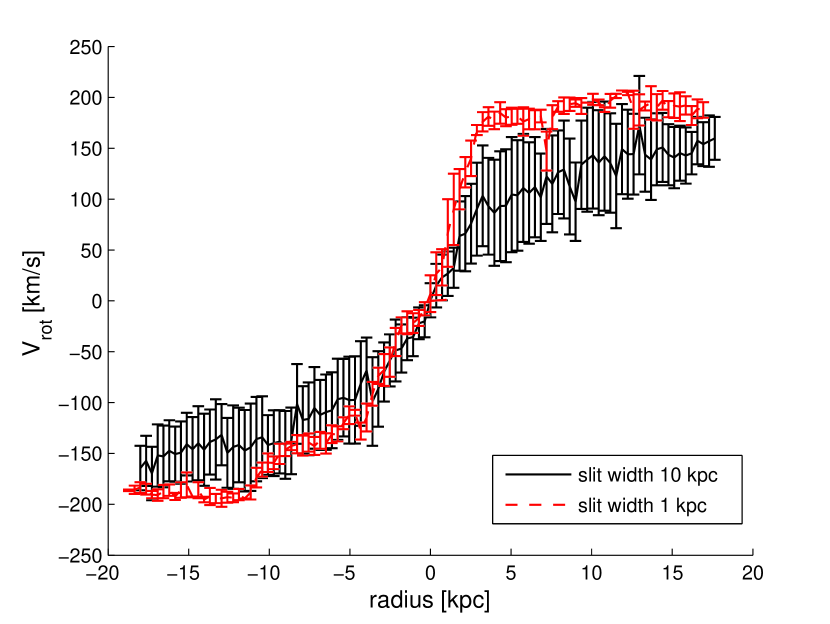
In order to study systematic effects of large relative slit widths, as they appear in observations of galaxies at intermediate and high redshift, we extract the RC of model galaxy A for several slit widths. Of course slit widths for local spiral systems are orders of magnitudes smaller. But for observations of galaxies in the redshift range 0.5 to 1, as carried out in a project related to the present work (Ziegler et al., 2003), typical slit widths become comparable to the disk scale length Rd. It is important to note, that such large slit widths result in an integration of the velocity field perpendicular to the spatial axis (slit direction). This effect is the optical equivalent to ’beam smearing’ in radio observations. To investigate this effect we measure RCs for slit widths ranging from 1 kpc to 10 kpc, which corresponds for our model galaxy A to 0.2 Rd to 2.2 Rd. In Fig. 6 and 7 we show the RCs for model galaxy A (IC and evolved, respectively) for two very different slit widths (1 kpc and 10 kpc).
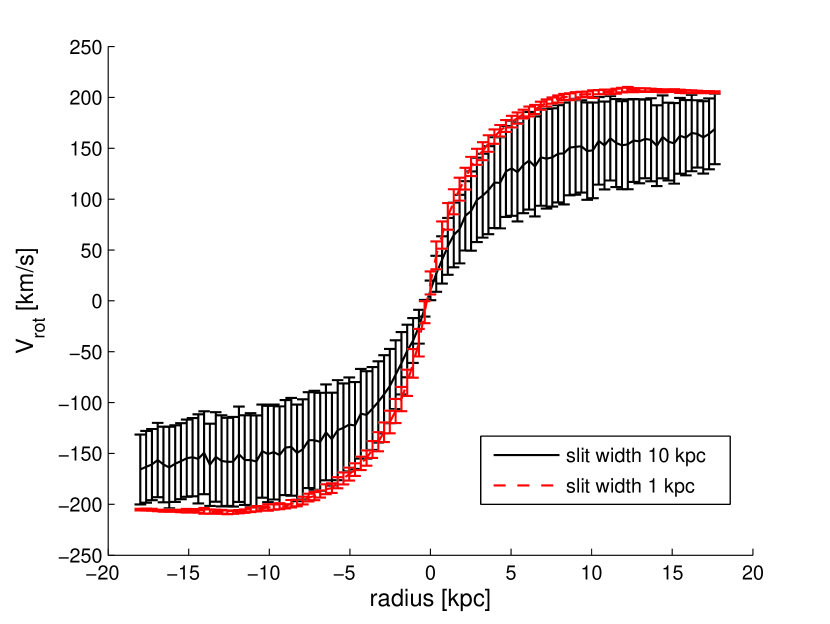
If the slit width is 1 kpc the scatter around the mean velocity in each bin is very small in comparison to the 10 kpc slit. This can be explained in terms of velocity distributions in a bin. As the slit width is increasing more gas particles can contribute to the measured mean velocity in a bin. In other words, the mean velocity is a superposition of velocity components from different regions of the galaxy, mainly due to the line of sight velocity distribution. In Fig. 7 the same quantity is shown as in Fig. 6, but after 5 Gyr of evolution of model galaxy A. Again the same behaviour in the scatter and mean velocity is present, but the overall velocity field shows more structure. This is a consequence of the fully hydrodynamic treatment of the galaxy. Note that ICs (as analytic models) do not include prescriptions for spiral arms, which are present in observed galaxies. Only the N-body/SPH simulations can reproduce this feature. Therefore the measured ideal RC for the evolved galaxies shows local fluctuations, connected to e.g. spiral arms. This fact is well known from observations, where fluctuations of a few tens of km/s are superposed on the smooth rotation curve of the galaxy due to spiral arms (see e.g. Sofue and Rubin, 2001). This is in good agreement with our model RCs (cf. Fig. 6 and Fig 7).
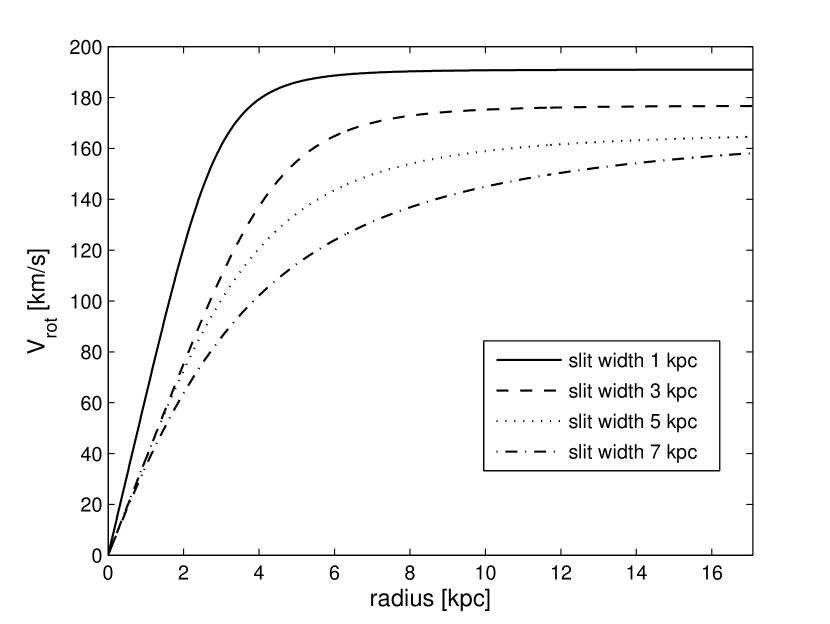
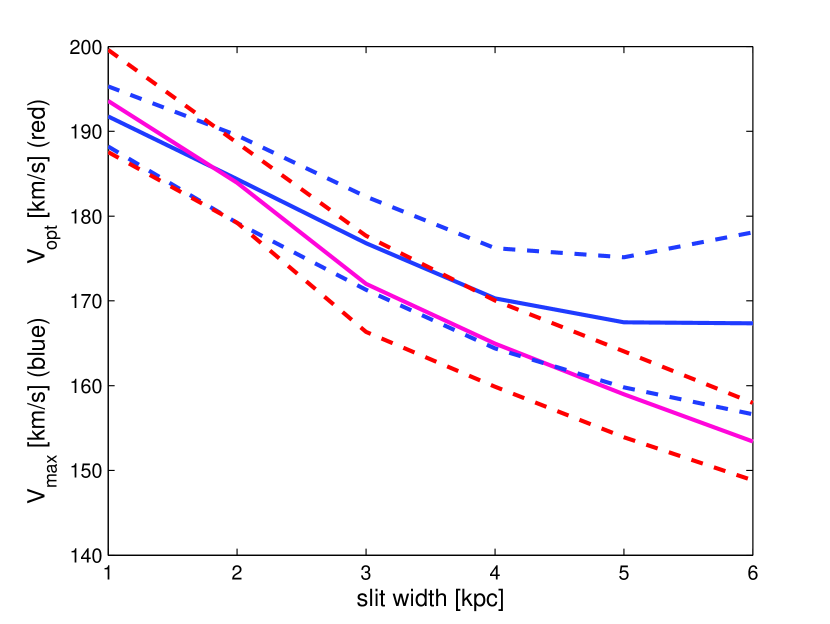
As a next step we fit eq. 1 to the RCs, extracted from different slit widths, shown in Fig. 8. We used galaxy model A after 5 Gyr of evolution. The galaxy was always ’observed’ with an inclination , with an ideal spatial resolution of 0.1 kpc. As the slit width increases the fitted curves decrease. Again this can be explained by the averaging process. It is obvious that too wide slits (dRd) result in non-flat RCs, which should not be fitted by eq. 1. Instead an observer would use here the URC. If we adopt our fitting procedures and extract Vmax and Vopt for different slit widths, we obtain a dependence of Vmax and Vopt on d, as shown in Fig. 9. A nearly linear decrease of Vmax and Vopt from d=1 kpc to d=4.5 kpc can be seen. From this investigation we would recommend to apply only a maximum slit width in the order of Rd.
3.3 Rotation curves as a function of inclination
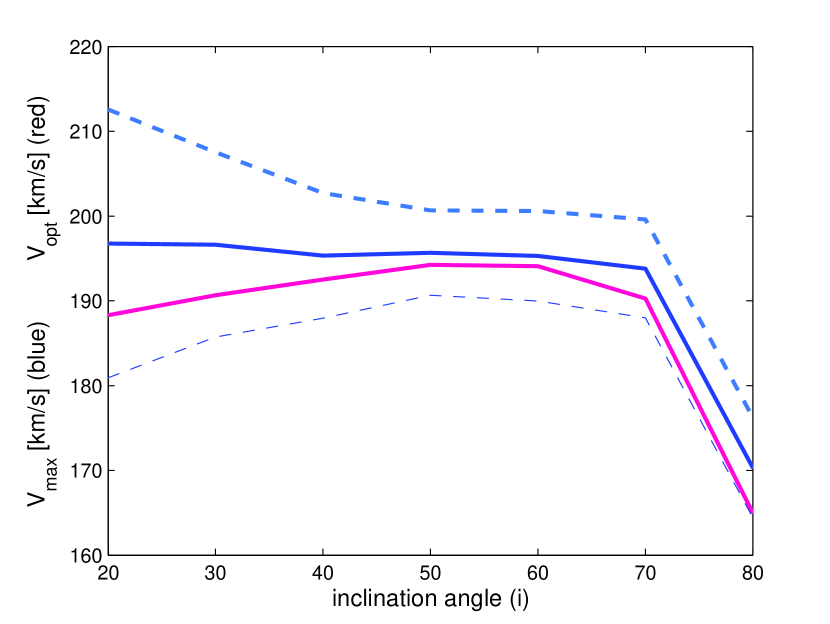
Galaxies are very rarely observable edge-on and therefore a correction of inclination effects on the RC is important. The intrinsic RC Vint(r) of a galaxy is most often corrected by the sine of the inclination angle, i.e. by the simple geometric correction Vint(r)=Vobs(r)/sin(i) (edge-on galaxies are defined to have i=). We investigate the RC of model galaxy A by rotating the galaxy from i= to i=, which is a typical range of inclination angles accessible in observations. The slit was centred on the gas disk with a slit width fixed to d=4 kpc. After each rotation we extract the RC, corrected with the simple expression Vint(r)=Vobs(r)/sin(i) before, and fit the data with eq. 1 and 2. The dependence of Vmax and Vopt on the inclination angle is shown in Fig. 10. In the inclination range 80 Vmax and Vopt show a steep increase while for 65∘ Vmax and Vopt stay roughly constant. The explanation for this behavior is shown in Fig. 11. If a galaxy is observed nearly edge-on, the rotational velocity is an average of velocities from all radial distances along the line-of-sight. With decreasing inclination, more and more gas particles with lower line-of-sight velocity components move out of the slit, and are therefore not taken into account in the averaging process. Thus, the mean velocity in each bin increases, which again leads to a larger Vmax and Vopt. Below a certain inclination angle, depending on the slit width, most of the volume of the disk is not covered by the slit. In this volume most gas particles with a low line-of-sight velocity component are located. In our case 70% of the volume is not covered by the slit for . Note that this behavior is most significant for large relative slit widths. In observations one tries to overcome the problem occurring at high inclination angles by special techniques, as e.g. the ’envelope-tracing’ method (e.g. Sofue and Rubin, 2001).
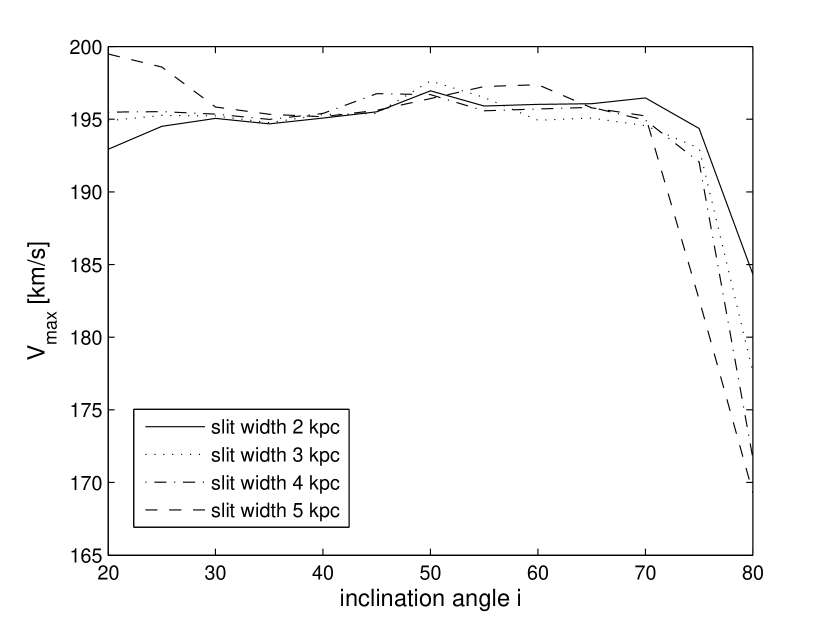
As the inclination angle decreases the errors for the fit become larger. Note that for the errors are in the order of 10%. In Fig. 12 we show the fitting parameter Vmax as a function of the inclination angle for different slit widths. If the inclination is below 70∘ and above 30∘ the slit width does not affect Vmax. The same behaviour was found for Vopt. Only in the cases near edge on and face on, the slit width plays an important role in covering gas particles. The overall trend is the same as shown in Fig. 9, where larger slit widths lead to lower Vmax and larger errors.
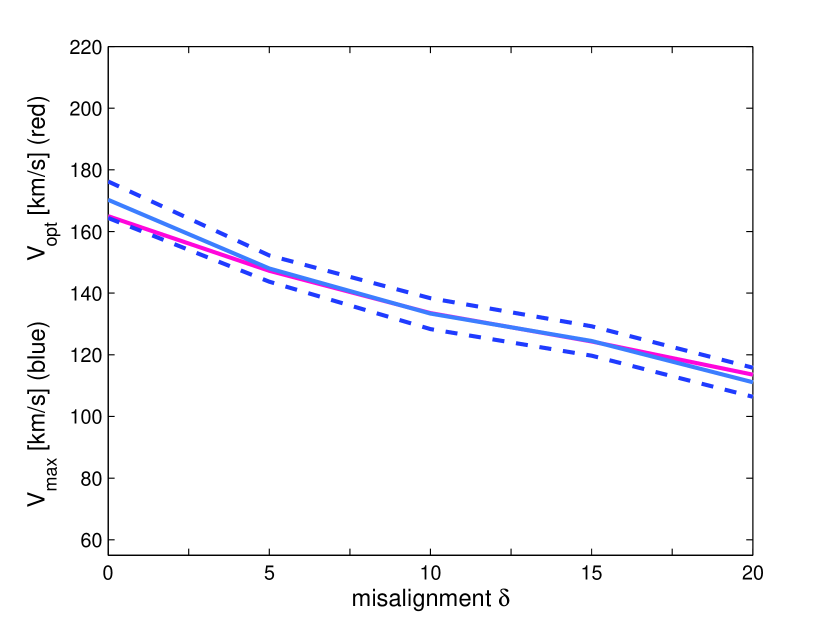
3.4 Rotation curves as a function of misalignment
As shown in Fig. 1 the slit for measuring the RCs can have a misalignment , with respect to the major axis of the projection of the galaxy on the sky. Especially multi-object spectroscopy has to deal with misaligned slits, therefore we investigate the effect of on the fitting parameters Vmax and . In Fig. 13 we plot the result for different for a fixed slit width of d=4 kpc for model galaxy A. Note that we applied the standard correction. Nevertheless the fitting parameters Vmax and are not independent of . The corresponding error (scatter around the mean velocity in a bin), does not show any dependence on the misalignment angle , if it covers particles all along the slit. As the correction, that we have applied, is only fully valid for two dimensional disks, without any thickness, Vmax and show a dependence on , the slit misalignment. In the case of multi-object spectroscopy, where the misalignment can be much higher, more advanced corrections have to be applied. We have introduced one method in Böhm et al. (2004).
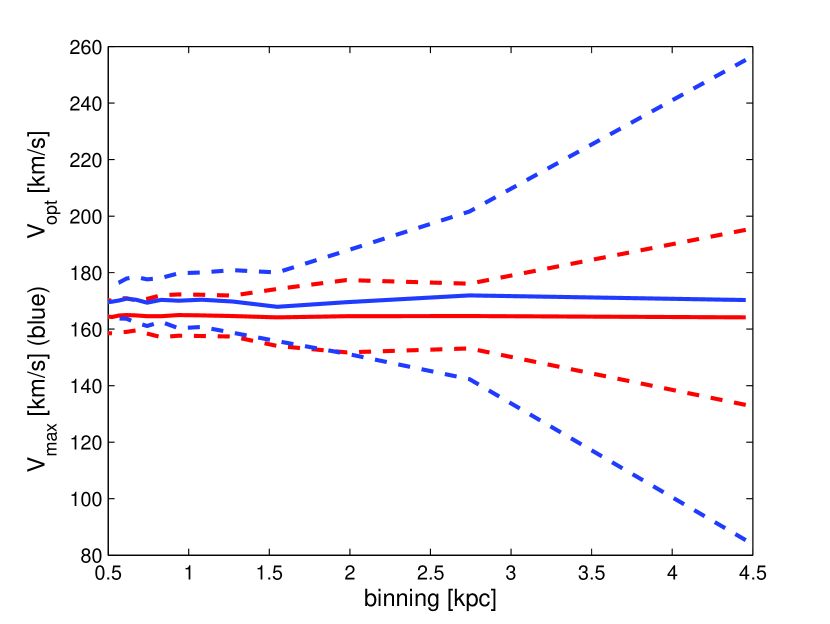
3.5 Rotation curves as a function of binning
To simulate different spatial resolution we bin our ideal RC, see Fig. 3. In Fig. 14 we show the dependency of the fitting parameters on different spatial resolutions, together with standard deviations. Obviously a poor spatial resolution leads to larger errors, but the value Vmax shows no dependence. As Vmax represents the flat part of the RC (the asymptotic velocity), the binning does not vary Vmax, but of course a and r0.
3.6 Estimators for the virial mass
One major goal of investigating RCs is the possibility to determine the mass of the system including baryonic and non-baryonic components. The virial mass of a galaxy is to V (e.g. Mo et al. 1998), where Vc is the rotational velocity of the galaxy at the virial radius. Unfortunately, it is not possible to measure this velocity directly, therefore the virial mass of a galaxy is estimated by some suitable measure of the maximum circular velocity. If Vmax converges to Vc at the virial radius, the RC fitting procedure with eq. 1 is a good estimator for the virial mass. However, as Vmax depends on observational constraints and of internal properties of the galaxy, it seems to be no robust estimator for the total virial mass. Van den Bosch (2002) investigated the impact of cooling and feedback on disk galaxies using an analytical model. The author comes to similar conclusions, however, as he does not treat the gas self consistently (i.e. fully hydrodynamically), he cannot derive a rotation curve and Vmax as we do. Instead in van den Bosch’s work Vmax is defined as the maximum rotation velocity inside the radial extend probed by the cold gas (van den Bosch, 2002). The author finally concludes that eq. 3 seems to be a good fitting function to obtain the virial mass of a system.
| (3) |
Van den Bosch (2002) did not intend to give an exact
estimator of the virial mass by this fitting function. Instead, it
seems that he wanted to give a rough estimate for the influence of
cooling and feedback on the determination of the virial mass using
Vmax. Therefore, it is clear that eq. 3 is not exact.
Nevertheless, as some observers use this function we also
apply it to our simulated galaxies.
As we treat the galaxies fully hydrodynamically, we are able to
show the influence of evolution on the RCs. In Fig. 4
the general decrease of Vmax is given. The main part,
which decreases the angular momentum is the presence of a galactic
wind, which ejects matter from the disk into the surrounding halo.
In most cases we find that Vmax derived from the fitting
procedures does not represent Vc and is also different
from the maximum rotation velocity present in the full velocity
field. Most determinations of Vmax (different
inclination, slit misalignments and slit widths) result in an
overestimation of Vc, if the standard corrections
and are applied. The virial mass of our
model galaxies, obtained by extracting r200 as limiting
radius, yields to M200=1.131012 M☉ for
model galaxy A and M200=1.441011 M☉ for
model galaxy B. We used eq. 2 to determine the virial mass and
find a systematic underestimation of 50%. As van den
Bosch (2002) states correctly, matter can be ejected by galactic
winds and therefore reduce Vmax by increasing at the
same time Rd. The same behavior is present in our
N-body/SPH simulations. However, we find that eq. 3 underestimates
the virial mass of our model galaxies. The same underestimation of
van den Bosch’s (2002) estimation was stated by Conselice et al.
(2005). However, as we have mentioned earlier, eq. 3 is not
thought to be exact. In fact, van den Bosch (2002) mentions that
the error for an individual galaxy can still exceed a factor of 2.
Thus it is no surprise, that the result is not correct for our
model galaxy.
A more detailed mass decomposition by applying the URC fitting
would allow a deeper insight into the mass distribution of a
galaxy. Nevertheless, the same problems from the observational
point of view would be inherent, like slit width, slit
misalignment or galaxy orientation. A detailed investigation of
the influence of the previous mentioned effects on the mass
decomposition by the RC will be investigated. Here we conclude
that it is important for observers to investigate the environment
of the measured galaxy. As galactic winds can strongly influence
the internal kinematics of the gas in the disk, the knowledge of
the star formation rate gives constraints on the robustness of the
determination of the virial mass from Vmax. An important
issue in this context is the membership of the galaxy to a group,
a galaxy cluster or the field. It is important to note that
especially spiral galaxies in galaxy clusters can often interact
with each other. As the interaction (Kapferer et al. 2005)
increases the star formation rate significantly, merger-driven
starbursts occur for a short (up to several 100 million years)
time and expel huge amounts of inter stellar matter into the
surrounding halo. Therefore, these systems might have lower
rotational velocities than isolated, low star forming galaxies
while the general shape of the RC remains similar.
3.7 The Tully-Fisher relation of spiral galaxies
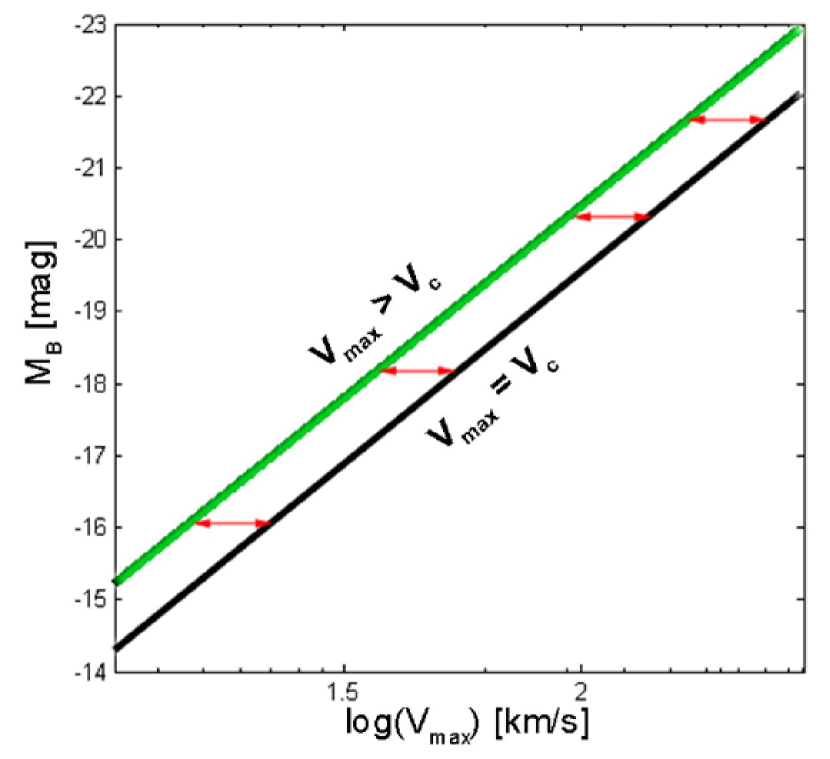
Semi-analytical galaxy formation models usually fix their free parameters such that the models match observed present-day luminosity functions (LF) or TFRs. Early models had problems predicting at the same time the correct LF and the correct zero point of the TFR. Therefore, additional physical processes were introduced to fit both important statistical properties of a galaxy population at the same time. However, most semi-analytical models only have rough models to approximate the circular velocity of the halo Vc, to derive a TFR for the underlying galaxy population. This in turn, can differ significantly from the maximum rotational velocity Vmax, derived from observed RCs, as discussed in the previous sections. Thus, differences of the zero point of observed and modelled TFRs could, at least to some extend, origin from these discrepancies of Vmax and Vc. We do not claim here, that the differences between Vmax and Vc solve the problem of the zero point discrepancies of observed and simulated TFRs. We just point out that these two quantities are in general not equal and therefore it is problematic to use them equivalently. A major contribution to the difference between Vmax and Vc are galactic winds, as they are able to decrease angular momentum of a disk, by expelling a significant amount of matter into the surrounding halo. As we are now able to show, that for given modelled galaxies, Vmax as derived in observations, indeed mostly overestimates Vc, we emphasise the importance of cooling and feedback processes. We plan to investigate the TFR of a semi-analytical model, taking this discrepancy into account, in a forthcoming work. The effect of the overestimation of Vmax as Vc is sketched in Fig. 15. If Vmax was equal to Vc we would expect that observed and simulated TFRs coincide in the right line. If Vmax is higher than Vc the TFR of the simulations would be located at the position of the left indicated line.
It is important to stress, that the direct comparison of observation (Vmax) and simulation (Vc) does invoke uncertainties originating from internal kinematics of the disk, like galactic winds. Similar concerns were emphasized by van den Bosch (2000). Tully Fisher relations can also be constructed by using . Again the same observational constraints would introduce uncertainties, but the increase of the disk scale length due to galactic winds is compensated by measuring at a given optical radius. Different disk scale lengths result in different optical radii and therefore the evolution of the gaseous disk is taken into account.
4 Summary and conclusion
In this work we use fully hydrodynamically modelled galaxies, including star formation, stellar feedback and galactic winds to study the internal kinematics of the gas in a spiral galaxy. We extract an RC from the line-of-sight velocities of the gas particles. Then we use a three-parameter fitting formula to describe the rotation curve (Courteau, 1997) and the universal rotation curve (URC, Persic et al. 1996). We find
-
•
that for evolved model galaxies the extracted and fitted RCs show a tendency to lower rotational velocities, compared to the initial conditions. This can be explained by galactic winds, which expel a certain amount of matter into the surrounding halo and therefore decrease the total angular momentum.
-
•
We show that the variation of the slit width does influence the quality of the RC and the values of Vmax as well as . If the slit width is small, Vmax and are systematically higher and show less scatter. If the slit width is large, the mean velocity is a superposition of particles along the line of sight, which introduces low velocity components and therefore larger scatter.
-
•
The dependence of Vmax and on the inclination angle is nearly constant over the range of . In the range above both show a strong dependence on , which can be explained by rotating velocity components from the foreground and background of the disk into the slit. It turned out that the sine correction leads to similar results in the range of . In this range we do not encounter strong dependencies on the slit width.
-
•
The correction for the slit misalignment is only fully valid for two dimensional disks, without any thickness. Thus, Vmax and show an almost linear dependence on . In the case of multi-object spectroscopy, where misalignments are inherent, more advanced corrections have to be applied, as for example introduced by Böhm et al. (2004).
-
•
The spatial resolution does not influence Vmax and strongly, but influences the quality of the RC.
-
•
We test the capability of Vmax as an estimator for the virial mass of the system and found a strong overestimation of the virial mass, by applying the virial theorem. By testing a more sophisticated relation, including results of semi-analytic models, introduced by van den Bosch (2002), we find an underestimation in the order of 50% of the virial mass. The explanation for the disagreement with van den Bosch lies in the fully N-body/hydrodynamic treatment in our simulations. Another point is the discrepancy of deriving Vmax, in our case from RCs from our model galaxies and in his case of the semi-analytical approach.
-
•
As Tully-Fisher relations are a common tool for testing models of galaxy evolution, any systematic differences between observations and theory play an important role. We show that Vmax and usually differ from Vc, which introduces a shift into the Tully-Fisher relation.
The investigation of the influence of minor/major mergers and galaxy flybys is an important issue on this topic, which will be discussed in a forthcoming paper.
Acknowledgements
The authors would like to thank Volker Springel for providing them GADGET2 and his initial conditions generators. generators. The authors are grateful to the anonymous referee for his/her criticism that helped to improve the paper. The authors acknowledge the Austrian Science Foundation (FWF) through grant number P15868, the UniInfrastrukturprogramm 2004 des bm:bwk Forschungsprojekt Konsortium Hochleistungsrechnen, the bm:bwk Austrian Grid (Grid Computing) Initiative and the Austrian Council for Research and Technology Development and the German Science Foundation (DFG) through Grant number Zi 663/6-1. In addition the authors acknowledge the Deutsches Zentrum für Luft- und Raumfahrt through grant 50 OR 0301, the ESO-Mobilitätsstipendien des bm:bwk (Austria) and the Tiroler Wissenschaftsfonds.
References
- (1) Babcock, H. W. 1939, Lick Observatory Bulletin, 19, 41
- (2) Böhm, A., et al. 2004, A&A, 420, 97
- (3) Conselice, C. J., Bundy, K., Ellis, R.S., Brichmann, J., Vogt, N.P., and Phillips, A.C. 2005, ApJ, 628, 160
- (4) Courteau, S. 1997, AJ, 114, 2402
- (5) Dickinson, M., Papovich, C., Ferguson, H. C., & Budavári, T. 2003, ApJ, 587, 25
- (6) Gabasch, A., et al. 2004, A&A, 421, 41
- (7) Kapferer, W., Knapp, A., Schindler, S., Kimeswenger, S., & van Kampen, E. 2005, A&A, 438, 87
- (8) Mihos, J. C., & Hernquist, L. 1994, APJ, 437, 611
- (9) Mo, H.J., Mao, S., White, S.D.M. 1998, MNRAS 295, 319
- (10) Persic, M., Salucci, P., Stel, F. 1996, MNRAS 281, 27
- (11) Persic, M. & Salucci, P. 1991, ApJ 368, 60
- (12) Sofue, Y., & Rubin, V. 2001, ARA &A, 39, 137
- (13) Springel, V., Hernquist, L. 2002, MNRAS, 333, 649
- (14) Springel, V., Di Matteo, T., Hernquist, L. 2005, MNRAS, 361, 776
- (15) Springel, V. 2005, MNRAS submitted, astro-ph/0505010
- (16) Tully, R. B., & Fisher, J. R. 1977, A&A, 54, 661
- (17) van den Bosch, F. C. 2002, MNRAS, 332, 456
- (18) van den Bosch, F. C. 2000, APJ, 530, 177
- (19) Yegorova, I., & Salucci, P. 2004, Baryons in Dark Matter Halos
- (20) Ziegler, B. L., et al. 2002, ApJ, 564, L69
- (21) Ziegler, B. L., Böhm A., Jäger, K., Heidt, J., and Möllenhoff, C. 2003, ApJ 598, L87