Scaling Mass Profiles around Elliptical Galaxies Observed with Chandra and XMM-Newton
Abstract
We investigated the dynamical structure of 53 elliptical galaxies, based on the Chandra archival X-ray data. In X-ray luminous galaxies, a temperature increases with radius and a gas density is systematically higher at the optical outskirts, indicating a presence of a significant amount of the group-scale hot gas. In contrast, X-ray dim galaxies show a flat or declining temperature profile against radius and the gas density is relatively lower at the optical outskirts. Thus it is found that X-ray bright and faint elliptical galaxies are clearly distinguished by the temperature and gas density profile. The mass profile is well scaled by a virial radius rather than an optical-half radius , and is quite similar at between X-ray luminous and dim galaxies, and smoothly connects to those of clusters of galaxies. At the inner region of or , the mass profile well traces a stellar mass with a constant mass-to-light ratio of . ratio of X-ray bright galaxies rises up steeply beyond , and thus requires a presence of massive dark matter halo. From the deprojection analysis combined with the XMM-Newton data, we found that X-ray dim galaxies, NGC 3923, NGC 720, and IC 1459, also have a high ratio of 20–30 at 20 kpc, comparable to that of X-ray luminous galaxies. Therefore, dark matter is indicated to be common in elliptical galaxies, and their distribution almost follows the NFW profile, as well as galaxy clusters.
1 Introduction
Dynamical studies indicate the presence of dark matter (DM) around spiral galaxies (Persic, Salucci, & Stel, 1996), and the DM mass profile has been measured through the rotation velocity profile. On the other hand, random motions of stars and clouds did not allow us to determine accurately the mass profile in elliptical galaxies. Alternatively, X-ray distribution of a hot interstellar medium (ISM) traces the gravitational potential (Forman, Jones, & Tucker, 1985), and, using ROSAT and ASCA satellites, it is revealed that massive DM halo exists around X-ray bright giant elliptical galaxies at (5–10), where is an effective radius or optical half-light radius (Ikebe et al., 1996; Trinchieri, Fabbiano, & Kim, 1997; Loewenstein, & White III, 1999; Matsushita et al., 1998; Matsushita, 2001). Numerical simulations based on cold cark matter (CDM) predict the cusp structure of the density profile (Navarro, Frenk, & White, 1997), whose shape is well scaled for various systems from small galaxies to rich clusters. The DM halo structure is sensitive to the properties of the DM, and attention of many workers is now focussed on the inner slope of the DM density profile. DM profile of galaxy clusters measured with Chandra and XMM-Newton has been reported to be consistent with the CDM picture (Arabadjis, Bautz, & Garmire, 2002; Lewis, Buote, & Stocke, 2003; Katayama, 2003; Buote, & Lewis, 2004). However, the mass profile around the optical body of elliptical galaxies has not been constrained, since the previous X-ray observations could not measure the brightness and temperature profile at the inner region of galaxies. In addition, there is still a lack of information on DM content in X-ray faint elliptical galaxies.
Recently, several other techniques become available to probe the mass profile around elliptical galaxies: strong gravitational lensing (Kochanek, 1995) at 1–10 of distant galaxies, and kinematics of stars, nearby dwarfs, and planetary nebula (Kronawitter et al., 2000; Gerhard et al., 2001; Kleyna et al., 2002; Romanowsky et al., 2003) at (0.1–5). These observations revealed that the mass-to-light ratio is almost constant at 3–30 around with radius of (0.5–5), and possibly correlates with the optical luminosity. Analyses of the Einstein and ROSAT HRI data derived a mass profile of X-ray bright elliptical gaiaxies down to , and confirmed that the innermost mass profile from X-ray observations is consistent with those from other techniques (Paolillo et al., 2002, 2003; Mathews, & Brighenti, 2003). Presence of DM around elliptical galaxies are also implied by the difference between X-ray and optical distributions (Buote, & Canizares, 1998; Buote et al., 2002).
Generally, previous X-ray and lensing measurements determined the total mass at the outer region of , where the DM dominates, while kinematics of objects constrain the mass at the inner region of , where the stellar mass dominates. Therefore, the overall mass profile from (0.1–10) for many elliptical galaxies is still unknown; we are not aware of where the cross point between the DM and stellar mass profiles is. Previous works reported two different pictures of DM content in elliptical galaxies; dominance of DM even at the inner region of NGC 4636 (Loewenstein, & Mushotzky, 2002) and NGC 720 (Buote et al., 2002), while no need for dark matter in several less-luminous elliptical galaxies (Romanowsky et al., 2003). These issues are concerned with formation scenario of elliptical galaxies; they formed through galaxy merger or intrinsically. Also it should be solved why X-ray bright and faint elliptical galaxies exist.
Such study is also important, since a substantial fraction of elliptical galaxies are central galaxies of galaxy groups and we must consider a massive dark matter associated with galaxy groups, apart from that of galaxies. ASCA observation of NGC 1399 found that it has a double structure of gravitational potential (Ikebe et al., 1996), and it is implied that DM forms two distinct scales. Such a double structure is not predicted by the CDM structure formation. However, ASCA could not resolve the innermost region within the optical half radius of NGC 1399, and thus contribution of stellar mass was not well studied.
Nowadays X-ray studies allow us to obtain the mass profile with a wide scale from 0.1 to 10, and thus give us information on the overall DM density profile. Unprecedentedly good angular resolution of Chandra enables us to measure the temperature and brightness of ISM in elliptical galaxies down to 0.1. In addition, a high signal-to-noise ratio and a wide field of view of XMM-Newton allow us to trace the DM profile beyond the optical outskirts even for X-ray dim elliptical galaxies. Previously several workers reported on the Chandra and XMM-Newton studies of DM profiles in elliptical galaxies (Loewenstein, & Mushotzky, 2002; Buote et al., 2002; O’Sullivan & Ponman, 2004a, b), but sample is still poor, and a general view of DM in elliptical galaxies is not yet known. Here, we report on studies of 53 elliptical galaxies observed with Chandra and deprojection analyses of 6 elliptical galaxies observed with both Chandra and XMM-Newton, to examine mass profiles of elliptical galaxies. Throughout this paper, we assume km s-1 Mpc-1.
2 Observation and Results
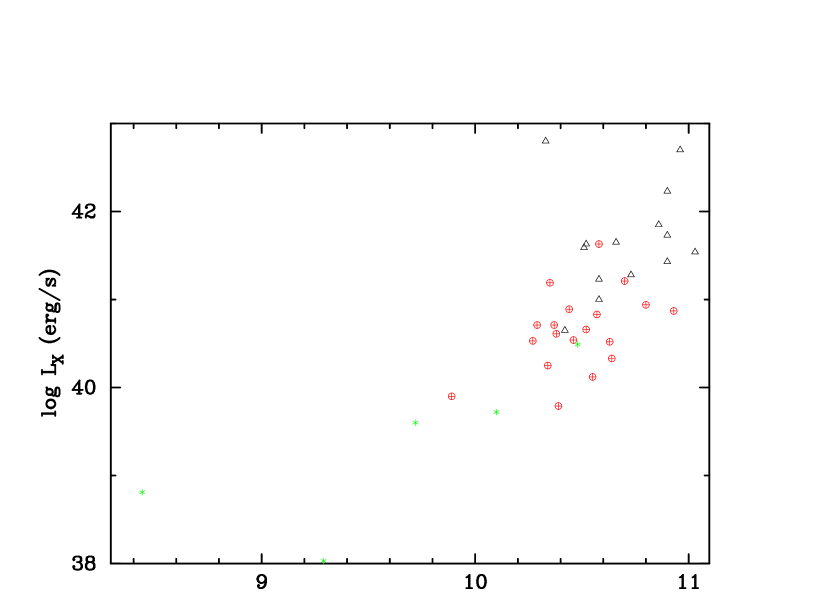
We analyzed archival data of 53 elliptical galaxies observed with Chandra ACIS instruments during 1999-2003 (table 1). These galaxies are selected so that their exposure time or the total photon count is more than 18 ks or 10,000 cts, respectively, to achieve a good signal-to-noise ratio. Figure 1 shows the relation of the optical and X-ray luminosity of our sample galaxies. Their optical luminosity is in the range of , and thus they are ordinary or giant elliptical galaxies, while X-ray luminosity scatters widely from erg s-1 to erg s-1. All of galaxies lie at a redshift of , and most of galaxies were observed with the back-illuminated CCD chip, ACIS-S3, and 6 galaxies were with the ACIS-I. NGC 4697 has been observed several times, and a total exposure of Chandra data is 145 ks in 4 pointing observations in 2000 and 2003–2004. Data analysis is performed with the CIAO software package version 2.3 and the calibration data base version 2.21. We reprocessed the level 2 data from the level 1 data, and excluded time regions with high background rate. We also eliminated point sources identified with the tool wavedetect. We constructed response matrices, considering the source extent by using the tool acisspec, and corrected the low energy efficiency with the tool acisabs. Background is estimated in the same detector region as on-source data by using the archival background data indicated by the tool acis_bkgrnd_lookup. We checked with eye the background level by comparing the light curves, the spectrum of the whole regions of the main CCD chip, and the X-ray radial count profile between the on-source and background data. In most of the data, the background was well reproduced within 20% accuracies, but for some objects (NGC 720, NGC 1700, NGC 1705, NGC 2434, NGC 4494, and NGC 5253), the background level of the on-source data is somewhat higher due to the continual particle flare. Since the excess background is harder and the thermal emission from elliptical galaxies are dominant at 0.6–1.5 keV around the Fe-L line complex, it is not so significant for our analysis.
We also utilized the XMM-Newton archival data of some elliptical galaxies in table 1, to trace the mass profile far away from the optical isophoto. About half of our sample galaxies were observed with XMM-Newton. Since the outer region of X-ray bright galaxies has already been investigated well with ROSAT and ASCA, we here treat two representative X-ray bright elliptical galaxies, NGC 1399 and NGC 5044. Since we intend to investigate the mass profile from the innner to the outer region, we chose the objects whose data of both Chandra and XMM-Newton have a good signal-to-noise ratio. Then, 8 X-ray faint galaxies remain, but two objects (NGC 4552 and NGC 5171) significantly suffer the Galactic soft X-ray emission around them, and two objects are associated with the intragroup medium (NGC 4261 and NGC 7619). As a result, we analyzed the data of four X-ray faint elliptical galaxies, NGC 3923, NGC 4697, NGC 720, and IC 1459, around which we do not find any significant flat X-ray emission. Observations of six galaxies analyzed here are summarized in table 2. We processed and analyzed the EPIC data with XMMXAS ver. 6.0.0. We constructed response matrices, considering the source extent. Time regions with high background rate are excluded. We also excluded the point source regions in the XMM-Newton data. Here point sources were picked up as the same method in Fukazawa, Makishima, & Ohashi (2004), but the exclusion radius is set to 20′′. Background is estimated in the same detector region as on-source data by using the archival background data (Jan. 2002 version). For most of the data, the background level is well reproduced within 30% and 60% accuracies for the MOS and PN, respectively, in the energy range of 0.5–5 keV. On the other hand, the background level of NGC 1399 is much higher due to the heavy particle flare. Fortunately, the X-ray emission of NGC 1399 is relatively bright, the thermal emission around the Fe-L line complex is still higher than the background level even at the outer galaxy region, and thus, we restricted the energy band for analyses within 0.8–2.0 keV.
3 Results
3.1 Overall Spectral Features
Before the datailed analysis, we analyze an overall spectrum obtained with the Chandra ACIS, to obtain overall spectral properties. We accumulated the spectra centered on the galaxy nucleus within the maximum detection radius , which is described in the subsequent section. In order not to use the CCD chip edge, we set the outer radius to 240′′ when is larger than 240′′. For some galaxies, we changed the integration radius so that the central point sources or the ambient background diffuse emission are not included in the spectrum. Then we fitted each spectrum with the APEC model (Smith et al., 2001) plus bremsstrahlung multiplied by the Galactic absorption. The bremsstrahlung model represents the emission from unresolved point sources and we fixed the temperature to 7 keV (Matsushita et al., 1994; Matsumoto et al., 1997). The column density of the Galactic absorption is fixed to the value referred to Dickey & Lockman (1990). Some galaxies show an indication of excess absorption, and we left the column density free for such galaxies. The results are summarized in table 3. For X-ray faint galaxies, the spectra were well fitted with this model, and the flux of the bremsstrahlung is consistent with the contribution of unresolved point sources in each galaxy. Our results of the temperature for NGC 3585 and NGC 4494 is also consistent with that of O’Sullivan & Ponman (2004a), who analyzed the Chandra and XMM-Newton simultaneously. On the other hand, X-ray bright galaxies give a large reduced-. This is thought to be due to the significant temperature gradient, as shown in the next subsection. Several galaxies give a very high luminosity of the hard component with erg s-1, possibly due to the imcomplete modeling of the thermal emission. Since the hard component is not so significant for our studies, we do not discuss it furthermore.
3.2 Parameterization studies on Chandra data
Temperature and density profiles of ISM are necessary to derive the mass profile. The most accurate is to obtain these profiles from analysis of deprojected spectra. However, signal-to-noise ratio of data for many of X-ray dim galaxies does not allow us to measure the mass at enough number of radii. Therefore, we first obtained the temperature profile from the projected spectra at several annuli, and the ISM density profile from the X-ray surface brightness profile by ignoring the temperature dependence of emissivity, and then parameterized these two profiles by appropriate functions from which we derived the mass profile. In this method, projection effect on the temperature profile and neglect of the temperature dependence of emissivity gives an error to the mass estimation, but it is at most 30–40% which is smaller than the statistical error in the deprojection analysis. Furthermore, as described later, the mass profile derived here is found to be consistent with that derived by the deprojection analysis. Therefore, the parameterization studies are valuable to obtain an overall picture of radial profiles of the temperature, gas density, and mass for elliptical galaxies.
We divided a galaxy region into several rings so that the signal-to-noise ratio is more than 15, which is enough to constrain the temperature by utilizing center energy of strong Fe-L lines. The APEC model is usually employed for fitting the thermal X-ray emission, but convergence of fitting is slower than the MEKAL (Liedahl, Osterheld, & Goldstein, 1995) and the fitting often falls into the local minimum. In this analysis, we treat many radially sorted spectra, and thus we do not apply the APEC model. Then we fitted each spectrum with the MEKAL model plus bremsstrahlung multiplied by the Galactic absorption. The column density of the Galactic absorption is fixed to the value referred to Dickey & Lockman (1990). Allmost all of the spectra were well fitted with this model, and the flux of the bremsstrahlung is consistent with the contribution of unresolved point sources in each galaxy. The metal abundance cannot be determined accurately, and thus we do not discuss it. Thus-obtained temperature profile of each galaxy is represented by a polynomial function with 0, 1, 2, or 3th order. Since several galaxies show a complex profile, we fitted the profile at a radius of 0–50′′ and 50′′–, separately, with a 2th-order polynominal, and jointed two polynomials smoothly. The order of the polynomial function is the same between the inner and outer region. For all the galaxies, we obtained good fits to the radial temperature profile. In the case that the number of the radially-sorted spectra is less than 5, we assume a constant temperature profile, where the temperature is obtained in the previous subsection.
In most of galaxies, the X-ray image is not circularly symmetric: the hot gas at the center region often suffers the jet from the galactic nucleus (Jones et al., 2002; Buote et al., 2003; Kraft et al., 2004), while the outer region is sometimes elongated toward the specific direction. In the case of the jet disturbance, the assumption of hydrostatic equilibrium does not completely hold. Therefore, we must note on the correctness of mass estimation. However, the assymmetry is as small as those of the X-ray emission of galaxy clusters, for which it was reported that the assymmetry does not affect the mass estimation so much (Schindler, 1996; Katayama, 2003). The X-ray surface brightness profile is derived at an energy of 0.5–1.5 keV, and fitted with single, double, or triple model. Profiles of most of the galaxies could be fitted well by either of the above three models with 10% accuracies. In several galaxies, the radial X-ray surface brightness profile has local structures, but the deviation is at most 20%, which gives 10% error to the hot gas density. Point-like emission from the galactic nuclei is observed for NGC 1553, NGC 4261, and IC 1459, and we modeled its X-ray profile by the -model with and core radius of 1.68′′, which are obtained by fitting the X-ray profile of the point source M33 X-8.
In table 4, we summarized the results of analysis on temperature and surface brightness profile for sample galaxies. The temperatures in this work are almost consistent with those obtained by the ROSAT PSPC (Matsushita, 2001) for 29 galaxies, but the temperature at the center region, in table 4 is sometimes lower for galaxies with a strong positive temperature gradient, due to finer angular resolution of Chandra.
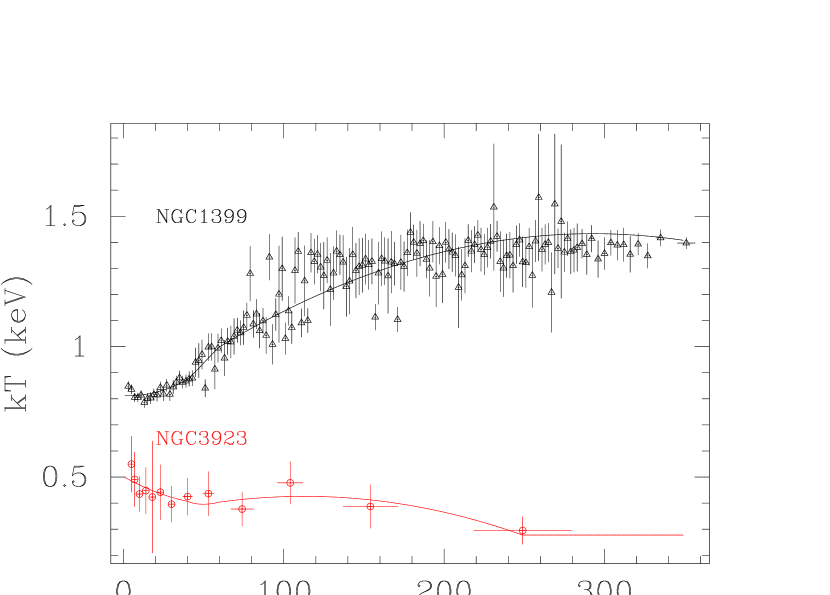
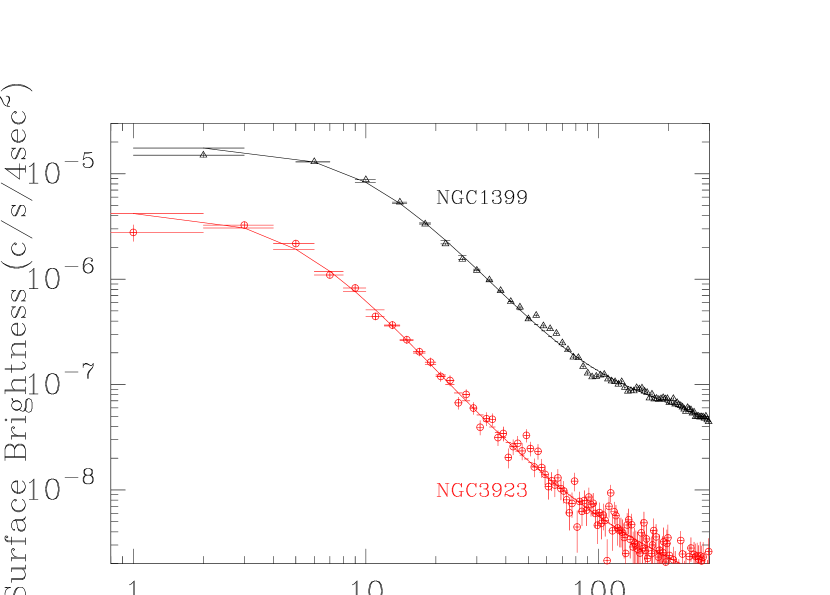
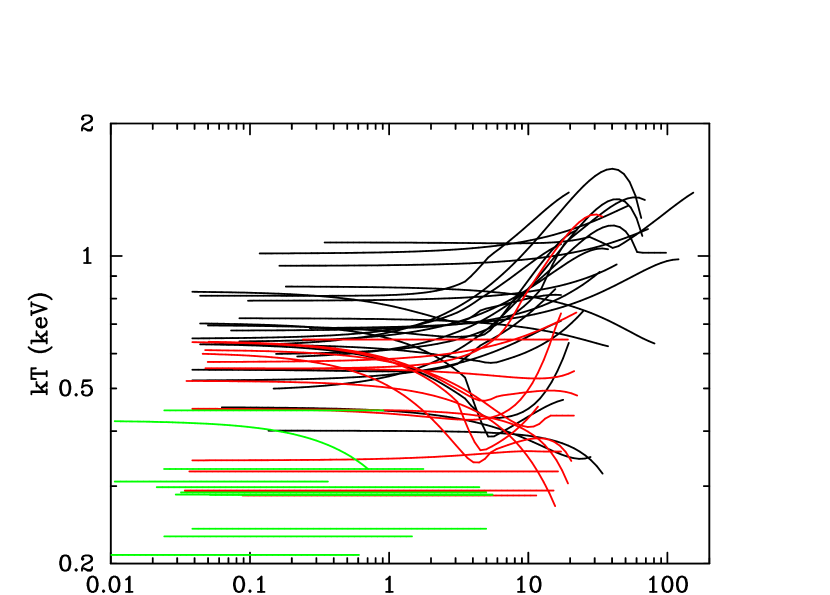
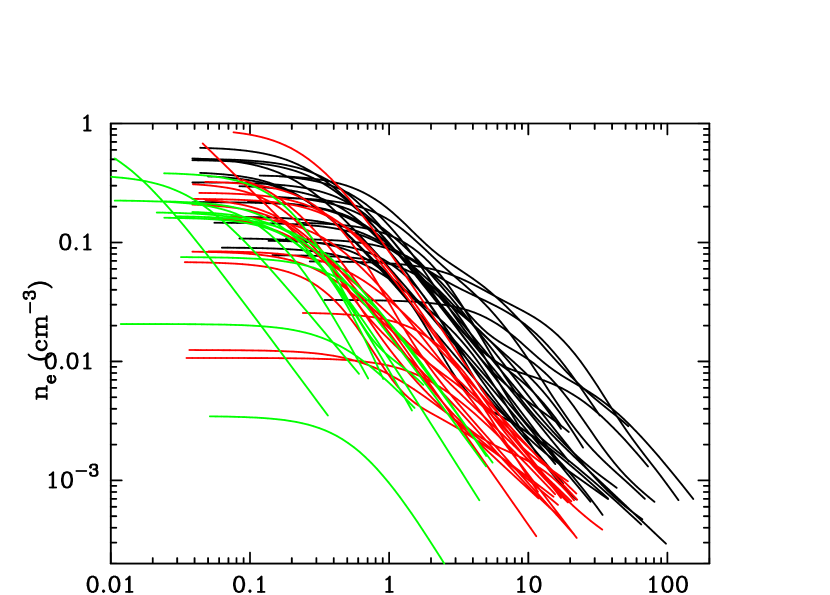
Examples of two typical profiles of temperature and X-ray surface brightness are shown in figure 2, together with the parameterized function. Left panel displays those of a X-ray bright galaxy NGC 1399, wherein the temperature gradually increases toward the outer radius from 0.8 to 1.4 keV, and the X-ray emission is detected beyond the ACIS-S field of view. In contrast, right panel of a X-ray dim galaxy NGC 3923 presents a flat or declining temperature profile at 0.4–0.5 keV and a compact X-ray emission region for the same surface brightness. In figure 3, we plot the temperature and ISM density profiles of objects analyzed here, where the temperature profile is plotted for objects with more than three radial bins. These profiles are plotted up to the maximum radius , within which the source brightness is higher than cts s-1 pix-2 cm-2. When the X-ray emission from the object is extended beyond the Chandra field of view, we plot the profile within . Around some galaxies, there is a significant flat emission at the outer region, which is due to the excess instrumental background, the bright Galactic X-ray background, or the Virgo cluster X-ray emission. In that case, we set the to be small. We divide our sample into two galaxies, based on whether the ISM density at 10 kpc radius is higher or lower than cm-3. Hereafter we call them an extended X-ray galaxy (EXG) or a compact X-ray galaxy (CXG), respectively. The classification is shown in table 4. In addition, galaxies whose X-ray emission does not reach 10 kpc are classified into a very compact X-ray galaxy (VCXG), because we can obtain the ISM properties of such objects to some extent but cannot constrain their total mass profile to say anything about the DM profile.
EXG has a higher ISM density by 3–10 times than CXG at the outer region, and tends to show a positive gradient in the temperature profile, like NGC 1399. Looking at the X-ray images of ROSAT and ASCA, the X-ray emission of some EXGs is extended beyond 100 kpc. The temperature at the outer region is 0.9–1.3 keV, corresponding to that of galaxy groups. These phenomena indicate that the EXG is embedded by the ambient hot intragroup medium. In fact, several EXG galaxies are identified as a cD galaxy in the galaxy group, such as NGC 1399, NGC 5044, and NGC 4325. On the other hand, CXG and VCXG show a flat or declining temperature profile like NGC 3923, and the X-ray emission is detected up to at most several tens kpc. Therefore, no significant hot intragroup medium is seen around CXG and VCXG. The central temperature ranges from 0.2 to 1.0 keV, and the temperature of all EXGs is higher than 0.5 keV. As seen in figure 1, EXG and CXG+VCXG galaxies correspond to the X-ray bright and faint ellipticals, respectively. However, this classification does not strictly mean that EXG or CXG is surrounded by the intragroup X-ray emission or not, since some galaxies associated with the intragroup X-ray emission are included in CXGs: for example, NGC 4261 (Davis et al., 1995) and NGC 7619 (Fukazawa, Makishima, & Ohashi, 2004).
Assuming the hydrostatic equilibrium, we derived the total mass profile from the parameterized temperature and gas density profiles, following the equation,
The total mass is obtained for several elliptical galaxies in our sample, by the optical measurements of kinematics of stars, planatory nebulas, and dwarf galaxies. We compare the total mass at a given radius, to that obtained by the previous optical works. In most cases, not the total mass but the mass-to-light ratio is available. To derive the mass-to-light ratio, the light profile is nesessary. We assumes the de Vaucouleurs law for the stellar distribution, while optical workers derived it from the optical observation. This difference possibly gives a different mass-to-light ratio. Therefore, when the total mass is available, we compare it with our result. Since Kronawitter et al. (2000) summarizes many data of , we convert their value of at their optical-half radius to the total mass , by using half of the total optical luminosity used in the literature. Since the at the optical-half radius is not explicitly written in the literature, this conversion may associate the systematic error. Furthermore, depends on the distance to the source, and thus we corrected the reference values, by using the distance used in this work. The comparison is shown in table 5. Our values are almost consistent with the optical works within 30% errors, but three galaxies show a large difference by a factor or . This is partly due to the systematic error in converting the into the total mass, for NGC 1399 and NGC 5846. Quite a large for NGC 3379 in our values indicate that the ISM is not in the hydrostatic equilibrium or the contribution from unresolved point sources to the X-ray emission is significant. Our result for NGC 720 and NGC 4555 is almost consistent with those in Buote et al. (2003) and O’Sullivan & Ponman (2004b), respectively, who analyzed the same X-ray data as ours. In addition, our values are consistent with those estimated by the stellar population synthesis (Gerhard et al., 2001). In figure 6 top, we compare the mass profile in this work with that in the optical works (Kronawitter et al., 2000; Saglia et al., 2000), for NGC 4472 and NGC 1399. The mass profile is consistent with each other, and our mass profile of NGC 1399 beyond 10 kpc is also consistent with that in the previous X-ray measurements with ASCA (Ikebe et al., 1996). These demonstrate that the X-ray mass measurement around is consistent with that in the optical works, indicating that the hot ISM is roughly in the hydrostatic equilibrium. Accordingly, we can trace the mass profile in a wide range of .
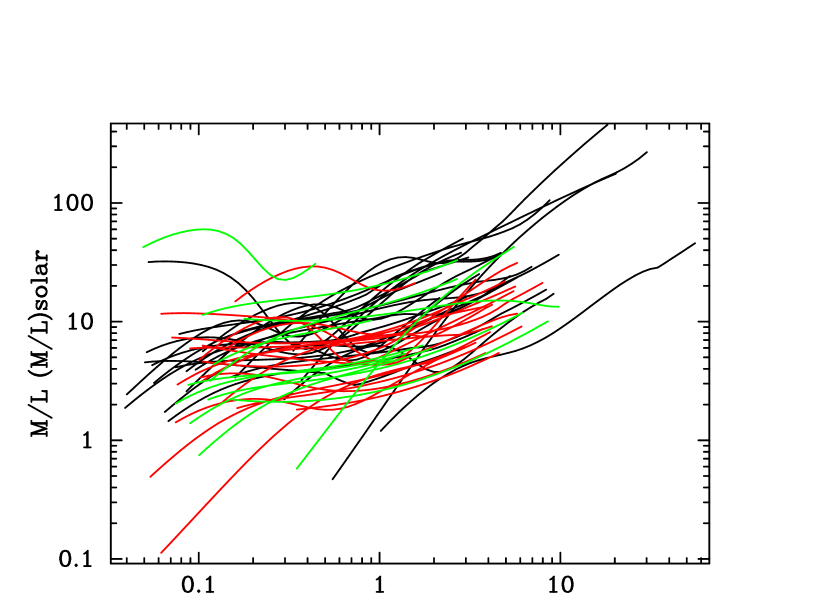
We then derive the profile of mass-to-light ratio , scaled total mass , where is a radius. A scaling virial mass is calculated as , referring to Evrard, Metzler, & Navarro (1996). We scale profile with a scaling (virial) radius kpc, and profile with an optical-half radius . Here, is a temperature at 10 kpc from the galaxy center where the dark matter in general dominates, and this temperature is calculated from the model of the temperature profile. The reason why we do not derive the virial radius by extrapolating the mass profile is that the maximum detection radius is smaller by a factor of than the virial radius for most galaxies, and thus the extrapolation introduces large uncertainties. We present the above profiles from to the maximum X-ray detection radius in figure 4, since a bin number of the radial surface brightness profile is not enough within a central 4′′ and thus the modeling is incomplete.
It is clearly seen that, in many galaxies, there is a region where becomes constant around 3–10 . This region () corresponds to that where stellar mass dominates. values of EXG at this region tend to be larger than that of CXG; 7–25 for EXG, and 3–7 for CXG. On the other hand, profile has a break around , and gradually rises up toward the outer region. These indicate that is not constant around galaxies and thus the presence of dark matter is needed. In comparison to CXG, EXG has a clear break in the profile and a breaking radius is small. The drop of at the innermost radius is seen in several galaxies. Since the inner region often suffers the radio jet from the central active galactic nucleus (AGN), the ISM is thought to be deviated from the hydrostatic equilibrium in those galaxies. In contrast to a large scatter of the profile in the outer DM-dominated region, the scaled mass profile has a small scatter. These indicate that the temperature at the outer region well represents the gravitational potential depth, and the optical-half radius is not appropriate for scaling the total mass profile. The slope of the scaling mass profile has a break around 0.01, within which stars dominate dark matter in mass.
3.3 Deprojection Analyses on Chandra data
In the parameterization analyses, we must pay attention to model dependencies of mass profiles, by considering uncertainties associated with the parameterizing model functions. Alternatively, we here performed the deprojection analyses on the Chandra data. We extracted several projected spectra of concentric annulus centered on the galaxy. We chose the radial bins so that the signal-to-noise ratio is more than 40 or 30 for EXGs or CXGs, respectively. However, as seen in table 4, photon statistics for 40% of galaxies, most of which are CXGs or VCXGs, is too poor to perform the deprojection. Deprojected spectra were derived from these projected spectra, following the method described in Ikebe, Böhringer, & Katayama (2004). Here, we modified their method by considering the emission out of the deprojected spherical region. We fitted the X-ray radial count rate profile with a single model, and utilized the best-fit parameters to represent the emission out of the deprojected spherical region and calculate the projection contribution of that region to the inner region.
Deprojected spectra were fitted with one temperature MEKAL plasma model multiplied by the photoelectric absorption. We fixed the absorption column density to the Galactic value. Since release of an abundance parameter introduces a large error on the emission measure, we first fitted the spectra with the abundance free and took an average of the abundance values over deprojected spectra. Then, we fixed the abundance to the average value. For X-ray faint galaxies, we fixed the temperature to the value which is calculated from the parameterized model function of the temperature profile obtained in the previous subsection for the corresponding radius. From the fits of deprojected spectra, we can obtain the 3-dimensional temperature and ISM density profiles, and , where we took a bin radius as a count-rate-weighted average of radii of all pixels in the analyzed region. In figure 5, we plot an example of 3-dimensional profiles obtained here. We then obtained the mass profiles from and , based on the hydrostatic equilibrium in which we took a finite difference approximation for calculating a derivative term.
In figure 6, we plot an example of the mass profile obtained by the deprojection analysis. The total mass profile obtained in the parameterization analysis, the stellar, and ISM mass profiles are also plotted. It can be seen that total mass profiles in both analyses are consistent with each other. For NGC 4697, we can measure the mass up to 20 kpc, thanks to its long exposure, but it is impossible in most CXGs like NGC 3923. The total mass seems to be lower than the stellar mass in some galaxies, but this is thought to be attributed to the incorrect distance or the incorrect mass-to-light ratio for the stellar mass. Note that the total or stellar mass dependes on the distance with or . For example, to NGC 4697 is assumed to be 15.1 Mpc in this work, and if we use Mpc in Méndez et al. (2001), the total mass becomes higher than the stellar mass.
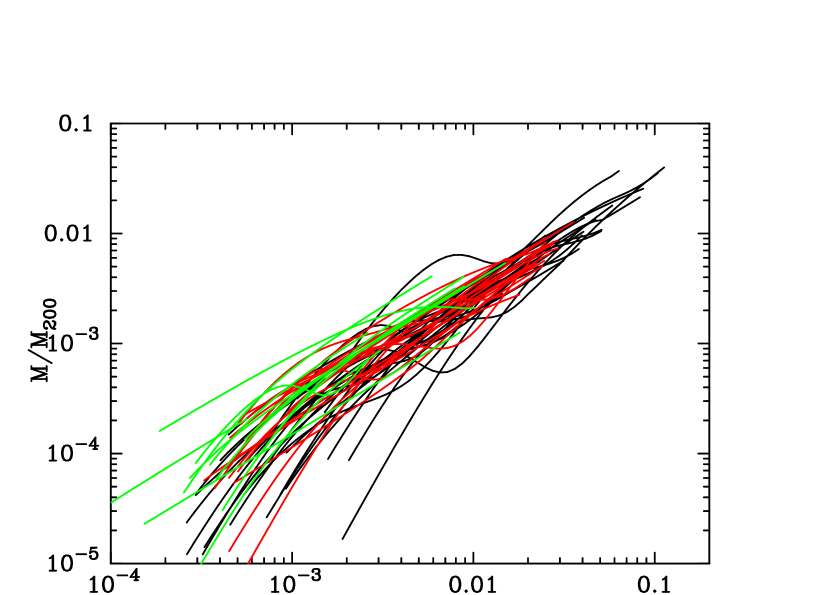
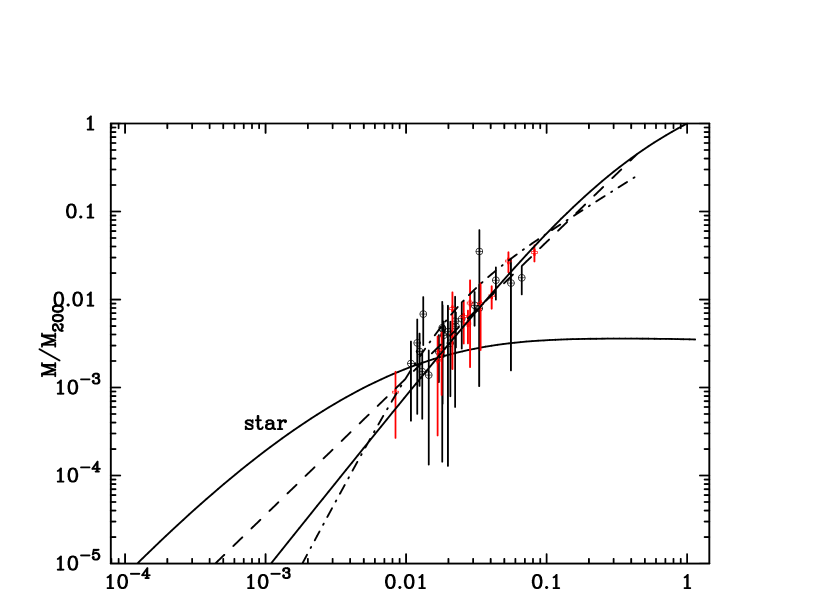
In figure 7, the scaled mass is plotted for all the deprojected points of sample galaxies. The mass profiles are obtained at (0.001–0.1) for EXG galaxies, and have a concave shape around 0.01, in good agreement with the previous subsection. These data can be compared with the scaled NFW mass profile and stellar mass profile. Here, the scaled NFW mass profile is expressed as
where ; here we assume the scaling radius . Therefore, only one parameter determines the shape of the mass profile: for the same , the scaled mass profile is identical independently of the system scale. We show the NFW profile with , which is a typical value for rich clusters (Lewis, Buote, & Stocke, 2003; Buote, & Lewis, 2004). The stellar mass profile is different among galaxies, since the effective radius and virial radius are different. Here, we plot the typical stellar mass profile, assuming kpc, , , and virial temperature of 0.6 keV. At the inner region, the mass profile goes along the typical stellar mass profile, and, at the outer region, it well matches the NFW profile. Comparing with the averaged mass profile of rich clusters in Pointecouteau, Arnaud, & Pratt (2005) (dashed line in figure 7), it is found that the scaled mass profile almost follows the NFW profile from X-ray bright elliptical galaxies (galaxy groups) to rich clusters. Using the data points beyond 10 kpc where the dark matter dominates, we fitted the profile with the NFW model by varying the concentration parameter , and obtained . Since the obtained data points can be fitted with the powerlaw model, and the inner slope of mass profile is also fitted to be . This value corresponds to the density inner slope of , somewhat larger than those of rich clusters (Lewis, Buote, & Stocke, 2003; Buote, & Lewis, 2004). This is partly due to that the mass used here includes not only dark matter but also a significant fraction of stellar mass at the inner region. Most of the above data points come from EXGs, while data points of CXGs are limited at the inner region of or (2–3), where the total mass is almost explained by the stellar mass. Nevertheless, we do not see any difference between EXG and CXG, and there is a hint of the dark matter halo around CXGs in figure 6.
3.4 Deprojection Analyses of Chandra and XMM-Newton data on Six Galaxies
Narrow field of view and low signal-to-noise ratio of the Chandra data do not allow us to investigate the mass profile up to 3, and thus we cannot constrain the dark matter content for X-ray faint galaxies (CXGs). Therefore, we utilized XMM-Newton data to overcome this limitations. Here, we analyzed the data of six galaxies, NGC 1399, NGC 5044, NGC 3923, NGC 4697, NGC 720, and IC 1459, which were observed with both Chandra and XMM-Newton. Combining both data, we trace the mass profiles precisely from inner to outer parts of galaxies by deprojection analysis, independently of the modeling function. The procedures of deprojections and spectral fittings are the same as described in the previous subsection, but in this case, we do not fix the temperature. The radii of annulus are not the same between Chandra and XMM-Newton data. The galaxy center region is finely divided for the Chandra data, while the XMM-Newton data cover the outer region with large steps of shell radii. We took common radii of annulus among three EPIC instruments. Spectra of MOS1 and MOS2 are summed up before deprojection, and we analyzed the deprojected spectra of PN and MOS1+2 simultaneously. The PN data of NGC 1399 and NGC 4697 cannot be analyzed, due to data acquisition error or severe background rate. The obtained profiles of the temperature and ISM density are consistent between Chandra and XMM-Newton within 15%.
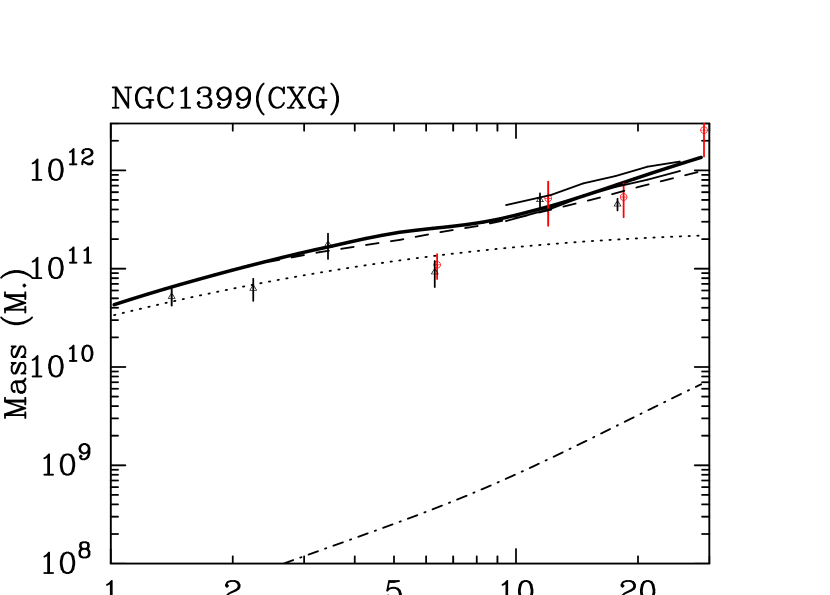
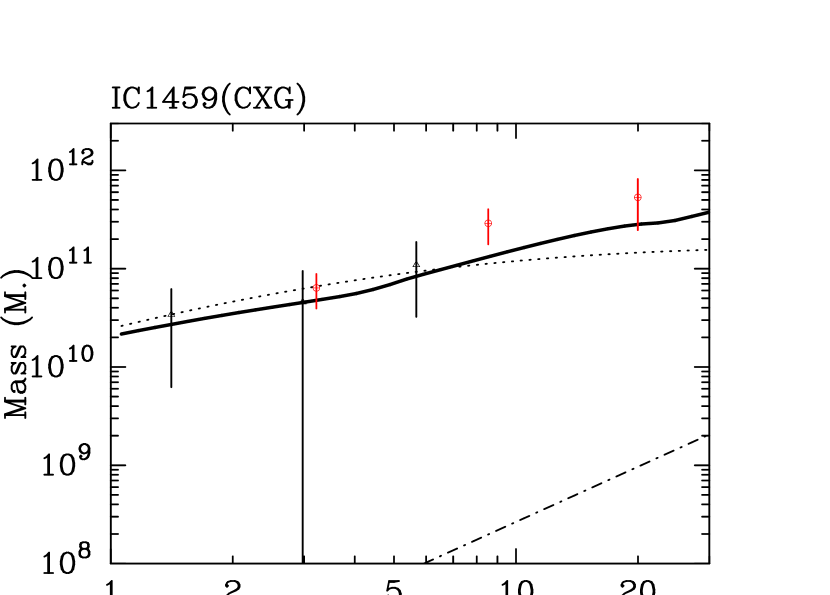
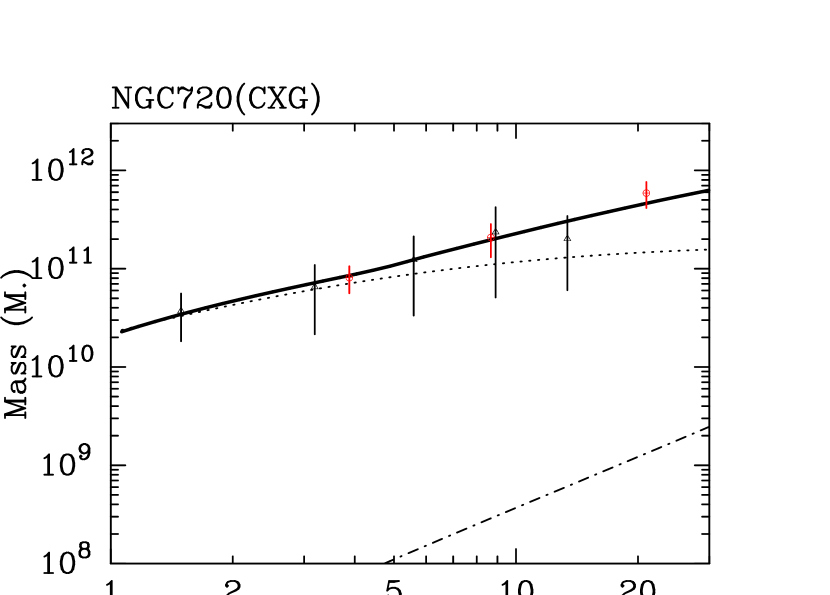
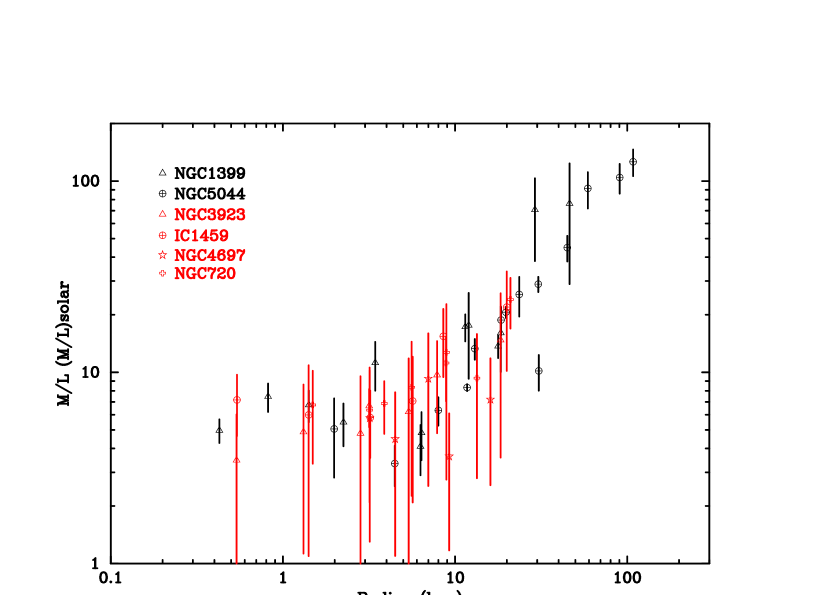
In figure 8, we plot an example of the mass profiles of CXGs obtained here. It can be seen that Chandra mass profiles at the inner region smoothly connect to XMM-Newton profiles at the outer region and data points of XMM-Newton give an estimation with a smaller error. It can be seen that the reults obtained here are almost consistent with those by the parameterization analyses of the Chandra data. The mass of CXGs can be traced beyond 10 kpc, and exceeds much the stellar mass at the outer region, as well as EXGs. In figure 9, we plot the radial profiles of the mass-to-light ratio of six galaxies. Within 10 kpc, the mass-to-light ratio is almost constant around 5–8, in good agreement with the results in the previous subsections. Beyond 10 kpc, the mass-to-light ratio increases significantly, even for CXGs, NGC 3923, NGC 720, and IC 1459. Although we cannot trace the mass of CXGs as far away as EXGs, the upturn of the mass-to-light profiles indicates that the dark matter halo exists around CXGs, as well as EXGs.
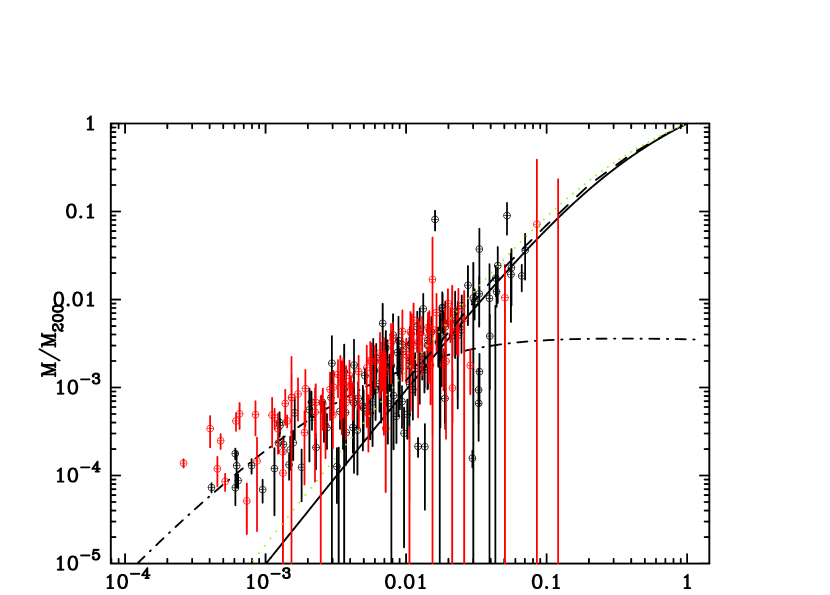
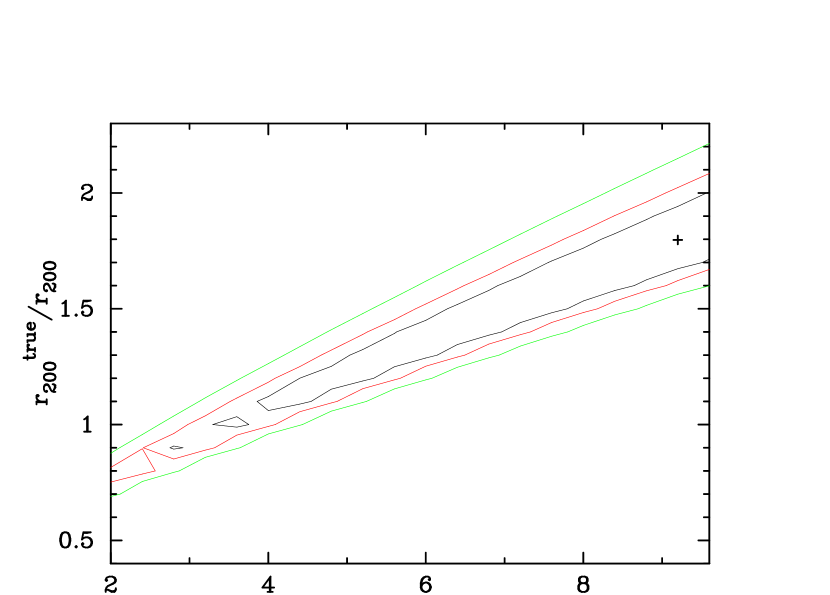
Using the data points beyond 10 kpc where the dark matter dominates to constrain the dark matter profile, as well as the previous subsection, we obtained for NFW profile and the density inner slope of for powerlaw profile. These are consistent with those for only the Chandra data. Therefore, we fitted the mass profile, including the Chandra data of other galaxies whose XMM-Newton data are not treated here. The results are shown in figure 10 left. We obtained and . Since we assumed the virial radius to be as in §3.2, this value of indicates the scaling radius kpc. In most cases, we cannot trace the mass profile up to here, we cannot determine the convex region in the NFW profile. This does not allow us to constrain the true virial radius . At fact, when we fit the mass profile with the NFW model which includes two parameters, and , the best-fit values of varies as shown in figure 10 right. We also tried to fit the profile with the King profile (King, 1962), and the core radius is constrained to be . We cannot rule out the King profile, but the King model cannot fit the mass profile if the scaling mass profile is the same shape as that of galaxy clusters. Since the stellar mass cannot be completely ignored around 10 kpc, the above values of and are thought to be upper or lower limit, respectively. We tried to fit the mass profile with the NFW and powerlaw model, by considering the typical stellar mass profile which is the same as that in §3.3. As a result, we obtained for the NFW model and for the powewlaw model. Therefore, considering the uncertainties of the assumed stellar mass, the parameters have a range of or .
4 Discussion
We systematically analyzed Chandra data of 53 elliptical galaxies, and obtained the temperature and ISM density profile to derive the mass profile. Galaxies are mainly classified into two types, based on the temperature and ISM density profile. One type (EXG) has a positive temperature gradient toward the outer radius and the ISM density is higher at the outer region. The other (CXG) has a declining or flat temperature profile and the ISM density is lower at the outer region. These corresponds to X-ray bright elliptical galaxies and X-ray faint ones, respectively. As well as “X-ray bright/faint”, the separation between EXGs and CXGs is ambiguous, and they are rather continuously linking with each other. Both types of galaxies which have been recognized in the previous works are now clearly distinguished by the temperature and gas density profiles. Nevertheless, the mass profile is consistent between two types of galaxies. The mass profile is well scaled by a virial radius rather than an optical-half radius , and smoothly connects to those of clusters of galaxies. This implies that structure formation by dark matter can be described in an unified way from rich clusters down to galaxies.
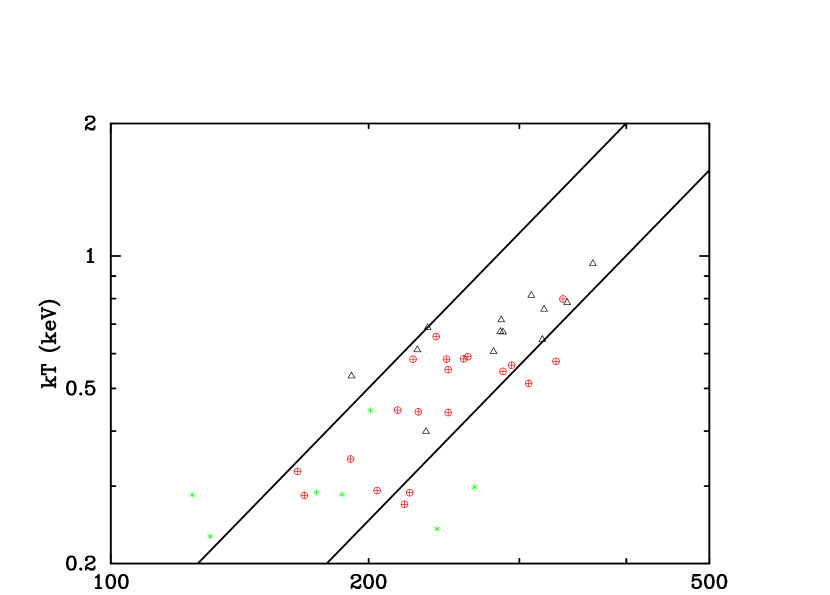
Higher temperature and higher density of hot gas at the outer region indicates that EXG is surrounded by the hot intragroup medium. At fact, the gas mass of some EXGs has found to be comparable to the stellar mass by the previous works (Matsushita et al., 1998; Mulchaey et al., 2003). Lower temperature at the inner region would correspond to the gravitational potential depth of galaxy itself. In figure 11, we plot the temperature of the innermost radius against the stellar velocity dispersion. Temperature roughly correlates with the velocity dispersion as with , consistent with the picture that ISM is heated by the stellar motion (Matsushita, 2001), in other words, gravitational energy. EXG shows somewhat higher temperature than CXG, indicating that the temperature of ISM is somewhat affected by the ambient hotter intragroup medium even at the innermost region. Therefore, we must pay attention to that ISM properties of EXG do not necessarily represent galaxy properties. On the other hand, VCXGs with lower deviate from the typical relation of higher CXGs, indicating that their ISM suffers non-gravity heatings such as supernovae and stellar mass loss or does not satisfy the hydrostatic equilibrium.
The mass profile well traces a stellar mass profile with a constant mass-to-light ratio of at the inner region of (0.001–0.01) or (0.1–1). Therefore, baryon mass dominates in the inner region of elliptical galaxies; a faction of the star mass is 53–62% at and 95.5–96.5% at when we assume the NFW mass profile of obtained in §3.4 and the stellar mass profile in §3.2, where the optical half radius is kpc, and is equivalent to 0.9 kpc. However, note that these are not very rigorous limits since composite mass models are not actually explicitly fit to the data. ratio of EXG increases steeply beyond , and thus requires a presence of massive dark matter halo, which is extended than stars as well as spiral galaxies. The crossing radius between stars and dark matter is around 10 kpc, quite similar to that of spiral galaxies with a similar mass scale, and thus the radial mass profile is not different between ellipticals and spirals; the difference is presence or absence of stellar disk components. These indicate that a double structure of gravitational potential in X-ray bright elliptical galaxies is mainly due to the different scale of mass concentration between stars and dark matter, rather than two distinct scales of dark matter. The mass profile is not well scaled by the optical-half radius . This is concerned with the fact that scatters widely among galaxies with similar . In other words, stellar distribution is different among galaxies with the same mass, independent of the gravitational potential, as indicated by Kodama & Matsushita (2000). Connection between individual galaxies and galaxy clusters is also an interesting issue, and X-ray bright elliptical galaxies are intermediate systems since they are often located at the center of galaxy groups. CDM structure formation theories do not give any distinct scales separating individual galaxies and clusters, while stellar distributions show a clear separation. Our results show that dark matter associated with cD galaxy itself is not distinguished with that of the surround galaxy group. This implies that cD galaxies evolved together with galaxy groups or clusters. XMM-Newton analyses of 10 galaxy clusters show that the scaled mass profile of these objects well trace the NFW profile (Pointecouteau, Arnaud, & Pratt, 2005). Considering it together with our results, the dark matter profile in elliptical galaxies or galaxy groups follow the NFW profile as well as galaxy clusters.
The slope of dark matter profile gives information on the properties of dark matter, and it is reported to be consistent with the CDM model for rich clusters (Arabadjis, Bautz, & Garmire, 2002; Lewis, Buote, & Stocke, 2003; Buote, & Lewis, 2004). As described in §3.4, the slope of mass profile at the inner region is and thus consistent with the NFW profile, but cannot rule out the self-interacting dark matter model (Spergel & Steinhardt, 2000) or adiabatic compression of dark matter (Prada et al., 2004). Our constraint is still poor due to the dominant stellar mass at the inner region. On the other hand, mass measurements of low-surface-brightness galaxies and dwarf irregular galaxies indicate no evidence of DM cusp profile at the center region (Moore et al., 1999; Coté, Carignan, & Freeman, 2000; de Blok, McGaugh, & Rubin, 2001). Therefore, measurement of the exact slope of ordinary elliptical galaxies is important to solve the above problem. The concentration parameter for the NFW model is obtained to be , somewhat smaller than that for rich clusters (Arabadjis, Bautz, & Garmire, 2002; Lewis, Buote, & Stocke, 2003; Buote, & Lewis, 2004; Pointecouteau, Arnaud, & Pratt, 2005). However, if the true virial radius is larger than the assumed one (Evrard, Metzler, & Navarro, 1996), a larger value of is allowed. Numerical simulations of the CDM halo predict a larger for lower-mass systems (Navarro, Frenk, & White, 1997; Bullock et al., 2001); for objects with the virial mass of , corresponding to that of elliptical galaxies. Our data allow if . Anyway, the mass around elliptical galaxies seems to be less concentrated than prediction, indicating that the formation epoch is recent and thus merger evolution of elliptical galaxies is preferred.
For X-ray dim galaxies, we cannot well constrain the dark matter content, but find some hints of increase for CXGs with . ASCA and ROSAT observations found X-ray emission of such CXGs up to (4–8). Extrapolating the constant temperature profile to this radius, a massive dark matter becomes necessary for these galaxies with . It is reported that intermediate luminous elliptical galaxies with do not need dark matter within 5 (Rix et al., 1997; Méndez et al., 2001; Romanowsky et al., 2003). Among galaxies they reported, the mass profile of NGC 4697 is analyzed up to in this paper. The at is consistent between our results and their works. Additionally, among four CXGs analyzed in subsection 3.4, NGC 720 and IC 1459 with show a hint of the increase toward the galaxy outskirts. Therefore, we suggest that ordinary elliptical galaxies commonly contain a massive dark matter halo. If CXG has a massive dark matter halo, they could also have an extended X-ray emission up to . Such an indication is also obtained from ASCA observations of galaxies and clusters (Fukazawa, Makishima, & Ohashi, 2004). In our sample, any less massive galaxies with do not show enough X-ray emission to trace the dark matter, and thus studies of less-luminous elliptical galaxies are also needed to resolve this issue unambiguously. Since it is probably very faint and cool, X-ray emissivity is too low to detect with Chandra. Therefore, further improvement of this study will be achieved by the low background instrument with a wide field-of-view, such as Astro-E2/Suzaku XIS.
References
- Arabadjis, Bautz, & Garmire (2002) Arabadjis, J. S., Bautz, M. W., & Garmire, G. P. 2002, ApJ 572, 66 Arnaboldi, M., Freeman, K. C., Gerhard, O., Matthias, M., Kudritzki, R. P., Méndez, R. H., Capaccioli, M., & Ford, H. 1998, ApJ 507, 759
- Buote, & Canizares (1998) Buote, D. A., & Canizares, C. R. 1998, MNRAS 298, 811
- Buote et al. (2002) Buote, D. A., Jeltema, T. E., Canizares, C. R. & Garmire, G. P. 2002, ApJ 577, 183
- Buote et al. (2003) Buote, D. A., Lewis, A. D., Brighenti, F., & Mathews, W. G. 2003, ApJ 594, 741
- Buote, & Lewis (2004) Buote, D. A., & Lewis, A. D. 2004, ApJ 604, 116
- Bullock et al. (2001) Bullock, J. S., Kollat, T. S., Sigad, Y., Somerville, R. S., Kravtsov, A. V., Klypin, A. A., Primack, J. R., Dekel, A., & Lewis, A. D. 2001, MNRAS 321, 559
- Coté, Carignan, & Freeman (2000) Coté, S., Carignan, C., & Freeman, K. C. 2000, AJ 120, 3027
- de Blok, McGaugh, & Rubin (2001) de Blok, W. J. G., McGaugh, S. S., & Rubin, V. C. 2001, AJ 122, 2396
- Davis et al. (1995) Davis, D. S., Mushotzky, R. F., Mulchaey, J. S., Worrall, D. M., Birkinshaw, M., & Burstein, D. 1995, ApJ 444, 582
- Dickey & Lockman (1990) Dickey, J. M., & Lockman, F. J. 1990, ARA&A 28, 215
- Evrard, Metzler, & Navarro (1996) Evrard, A. E., Metzler, C. A, & Navarro, J. F. 1996, ApJ, 469, 494
- Faber et al. (1989) Faber, S. M., Wegner, G., Burstein, D., Davies, R. L., Dressler, A., Lynden-Bell, D., & Terlevich, R. J. 1989, ApJS 69, 763
- Forman, Jones, & Tucker (1985) Forman, W., Jones, C., & Tucker, W. 1985, ApJ 293, 102
- Fukazawa, Makishima, & Ohashi (2004) Fukazawa, Y., Makishima, K., & Ohashi, T. 2004, PASJ 56, 965
- Gerhard et al. (2001) Gerhard, O., Kronawitter, A., Saglia, R. P., Bender, R. 2001, AJ 121, 1936
- Ikebe et al. (1996) Ikebe, Y., Ezawa, H., Fukazawa, Y., Hirayama, M., Ishisaki, Y., Kikuchi, K., Kubo, H., Makishima, K., et al. 1996, Nature, 379, 427
- Ikebe, Böhringer, & Katayama (2004) Ikebe, Y., Böhringer, H., & Katayama, T. 2004, ApJ 611, 175
- Jones et al. (2002) Jones, C., Forman, W., Vikhlinin, A., Markevitch, M., David, L., Warmflash, A., Murray, S., Nulsen, P. E. J. 2004, ApJ 567, L115
- Katayama (2003) Katayama, H. 2003, Ph-D Thesis, Osaka University
- King (1962) King, I. R. 1962, AJ 67, 471
- Kleyna et al. (2002) Kleyna, J., Wilkinson, M. I., Evans, N. W., Gilmore, G., & Frayn, C. 2002, MNRAS 330, 792
- Kochanek (1995) Kochanek, C. 1995, ApJ 445, 559
- Kodama & Matsushita (2000) Kodama, T., & Matsushita, K. 2000, ApJ 539, 149
- Kraft et al. (2004) Kraft, R. P., Forman, W. R., Churazov, E.; Laslo, N., Jones, C., Markevitch, M., Murray, S. S., & Vikhlinin, A. 2002, MNRAS 330, 792
- Kronawitter et al. (2000) Kronawitter, A., Saglia, R. P., Gerhard, O. E., & Bender, R. 2000, A&AS 144, 53
- Lewis, Buote, & Stocke (2003) Lewis, A. D., Buote, D. A., & Stocke, J. T. 2003, ApJ 586, 135
- Liedahl, Osterheld, & Goldstein (1995) Liedahl, D. A., Osterheld, A. L, & Goldstein, W. H. 1995, ApJ, 438, L115
- Loewenstein, & White III (1999) Loewenstein, M., White III, R. 1999, ApJ 518, 50
- Loewenstein, & Mushotzky (2002) Loewenstein, M., Mushotzky, R. F. 2002, astro-ph/0208090
- Mathews, & Brighenti (2003) Mathews, W. G., & Brighenti, F. 2003, ARA&A 41, 191
- Matsumoto et al. (1997) Matsumoto, H., Koyama, K., Awaki, H., Tsuru, T., Loewenstein, M., & Matsushita, K. 1997, ApJ 482, 133
- Matsushita et al. (1994) Matsushita, K., et al. 1994, ApJ, 436, L41
- Matsushita et al. (1998) Matsushita, K., Makishima, K., Ikebe, Y., Rokutanda, E., Yamasaki, N., & Ohashi, T. 1998, ApJ, 499, L13
- Matsushita (2001) Matsushita, K. 2001, ApJ, 547, 693
- McElroy (1995) McElroy, D. B. 1995, ApJS 100, 105
- Méndez et al. (2001) Méndez, R. H. et al. 2001, ApJ 563, 135
- Moore et al. (1999) Moore, B., Quinn, T., Governato, F., Stadel, J., & Lake, G. 1999, MNRAS 310, 1147
- Mulchaey et al. (2003) Mulchaey, J. S., Davis, D. S., Mushotzky, R. F., & Burstein, D. 2003, ApJS, 145, 39
- Navarro, Frenk, & White (1997) Navarro, J. F., Frenk, C. S., & White, S. D. M. 1997, ApJ 490, 493
- O’Sullivan, Forbes, & Ponman (2001) O’Sullivan, E., Forbes, D. A., & Ponman, T. J. 2001, MNRAS 328, 461
- O’Sullivan & Ponman (2004a) O’Sullivan, E., & Ponman, T. J. 2004a, MNRAS 349, 535
- O’Sullivan & Ponman (2004b) O’Sullivan, E., & Ponman, T. J. 2004b, MNRAS 354, 935
- Paolillo et al. (2002) Paolillo, M., Fabbiano, G., Peres, G., & Kim, D.-W. 2002, ApJ 565, 883
- Paolillo et al. (2003) Paolillo, M., Fabbiano, G., Peres, G., & Kim, D.-W. 2003, ApJ 586, 850
- Persic, Salucci, & Stel (1996) Persic, M., Salucci, P., & Stel, F. 1996, MNRAS 281, 27
- Pointecouteau, Arnaud, & Pratt (2005) Pointecouteau, E., Arnaud, M, & Pratt, G. W. 2005, astro-ph/0501635
- Prada et al. (2004) Prada, F., Klypin, A, Flix, J., Martinez, M., & Simonneau, E. 2004, astro-ph/0401512
- Rix et al. (1997) Rix, H.-W., de Zeeuw, P. T., Cretton, N., van der Marel, R. P., & Carollo, C. M. 1997, ApJ 488, 702
- Romanowsky et al. (2003) Romanowsky, A. J. et al. 2003, Science 301, 1696
- Saglia et al. (2000) Saglia, R. P., Kronawitter, A., Gerhard, O., & Bender, R. 2000, ApJ 119, 153
- Schindler (1996) Schindler, S. 1996, A&A 305, 756
- Smith et al. (2001) Smith, R. K., Brickhouse, N. S., Liedahl, D. A., & Raymond, J. C. 2001, ApJ, 556, L91
- Spergel & Steinhardt (2000) Spergel, D. N., & Steinhardt, P. J. 2000, Phys. Rev. Lett. 84, 3760
- Trinchieri, Fabbiano, & Kim (1997) Trinchieri, G., Fabbiano, G., & Kim, D. -W. 1997, A&A 318, 361


| Galaxy | SeqIDaaSequence number of the Chandra data | bb is a distance to the galaxy. is an optical blue luminosity. These are taken from O’Sullivan, Forbes, & Ponman (2001) and NED (NASA/IPAC EXTRAGALACTIC DATABASE). | bb is a distance to the galaxy. is an optical blue luminosity. These are taken from O’Sullivan, Forbes, & Ponman (2001) and NED (NASA/IPAC EXTRAGALACTIC DATABASE). | cc is an optical half radius (effective radius) taken from Faber et al. (1989). Values indicated by are assumed to be kpc, due to no available data. | ACIS | exp. timeddExposure and source count rate in the ACIS-S 3 or ACIS-I 0-3. | ctsddExposure and source count rate in the ACIS-S 3 or ACIS-I 0-3. |
|---|---|---|---|---|---|---|---|
| (Mpc) | ()) | (kpc,arcsec) | (sec) | (c/s) | |||
| IC1262 | 2018 | 142.0 | 10.33 | 8.4 12.22 | ACIS-S | 29797 | 1.345 |
| IC1459 | 2196 | 18.9 | 10.37 | 3.5 38.65 | ACIS-S | 55746 | 0.203 |
| M32 | 2017 | 0.7 | 8.36 | 0.1 38.65 | ACIS-S | 38372 | 0.130 |
| NGC507 | 317 | 67.2 | 10.96 | 25.1 77.11 | ACIS-S | 18364 | 1.507 |
| NGC533 | 2880 | 63.7 | 10.90 | 14.7 47.55 | ACIS-S | 37555 | 0.573 |
| NGC720 | 492 | 20.8 | 10.38 | 4.0 39.55 | ACIS-S | 37691 | 0.438 |
| NGC741 | 2223 | 61.1 | 10.90 | 15.4 52.13 | ACIS-S | 30199 | 0.280 |
| NGC1291 | 795 | 12.1 | 10.33 | 3.2 54.59 | ACIS-S | 37835 | 0.077 |
| NGC1316 | 2022 | 18.1 | 10.93 | 7.1 80.75 | ACIS-S | 23894 | 0.499 |
| NGC1332 | 4372 | 19.7 | 10.27 | 2.7 28.00 | ACIS-S | 56391 | 0.148 |
| NGC1395 | 799 | 20.5 | 10.44 | 4.5 45.41 | ACIS-I | 24423 | 0.251 |
| NGC1399 | 319 | 18.1 | 10.52 | 3.7 42.38 | ACIS-S | 55794 | 2.171 |
| NGC1404 | 2942 | 18.1 | 10.35 | 2.3 26.74 | ACIS-S | 29198 | 1.102 |
| NGC1407 | 791 | 20.6 | 10.58 | 7.2 71.97 | ACIS-S | 46155 | 0.408 |
| NGC1550 | 3186 | 48.5 | 10.33 | 6.0 25.53 | ACIS-I | 9934 | 1.589 |
| NGC1553 | 783 | 14.4 | 10.63 | 4.6 65.63 | ACIS-S | 22725 | 0.290 |
| NGC1600 | 4283 | 60.0 | 11.03 | 13.8 47.55 | ACIS-S | 23575 | 0.235 |
| NGC1700 | 2069 | 56.1 | 10.53 | 3.7 13.71 | ACIS-S | 39293 | 0.149 |
| NGC1705 | 3930 | 4.9 | 8.44 | 0.3 11.67 | ACIS-S | 48208 | 0.034 |
| NGC2434 | 2923 | 14.1 | 9.89 | 2.8 40.47 | ACIS-S | 40819 | 0.214 |
| NGC2681 | 2061 | 10.0 | 9.48 | 4.0 82.46††footnotemark: | ACIS-S | 78928 | 0.031 |
| NGC2865 | 2020 | 36.5 | 10.48 | 2.1 11.67 | ACIS-S | 27871 | 0.160 |
| NGC3115 | 2040 | 8.8 | 10.10 | 1.5 36.07 | ACIS-S | 35646 | 0.068 |
| NGC3377 | 2934 | 10.0 | 9.72 | 1.6 33.66 | ACIS-S | 39593 | 0.003 |
| NGC3379 | 1587 | 10.0 | 10.06 | 1.7 35.25 | ACIS-S | 30680 | 0.062 |
| NGC3585 | 2078 | 16.1 | 10.39 | 3.1 39.55 | ACIS-S | 35245 | 0.068 |
| NGC3607 | 2073 | 19.8 | 10.46 | 6.3 65.63 | ACIS-I | 38448 | 0.098 |
| NGC3923 | 1563 | 17.9 | 10.52 | 4.6 53.35 | ACIS-S | 18887 | 0.262 |
| NGC4125 | 2071 | 25.9 | 10.80 | 7.5 59.86 | ACIS-S | 64086 | 0.196 |
| NGC4261 | 834 | 31.5 | 10.70 | 5.9 38.65 | ACIS-S | 32492 | 0.329 |
| NGC4325 | 3232 | 111.1 | 10.29 | 4.0 7.41††footnotemark: | ACIS-S | 30038 | 1.257 |
| NGC4365 | 2015 | 15.9 | 10.34 | 4.4 57.16 | ACIS-S | 40379 | 0.116 |
| NGC4374 | 803 | 15.9 | 10.57 | 4.2 54.59 | ACIS-S | 28427 | 0.757 |
| NGC4382 | 2016 | 15.9 | 10.64 | 4.2 54.59 | ACIS-S | 39700 | 0.147 |
| NGC4472 | 321 | 15.9 | 10.90 | 8.0 104.02 | ACIS-S | 37071 | 2.064 |
| NGC4494 | 2079 | 21.3 | 10.62 | 4.7 45.41 | ACIS-S | 23602 | 0.152 |
| NGC4552 | 2072 | 15.9 | 10.29 | 2.3 30.00 | ACIS-S | 54370 | 0.366 |
| NGC4555 | 2884 | 90.3 | 10.86 | 1.8 4.01 | ACIS-S | 29718 | 0.129 |
| NGC4621 | 2068 | 15.9 | 10.32 | 3.6 46.46 | ACIS-S | 24787 | 0.060 |
| NGC4636 | 323 | 15.9 | 10.51 | 7.8 101.65 | ACIS-S | 47885 | 2.829 |
| NGC4649 | 785 | 15.9 | 10.73 | 5.7 73.64 | ACIS-S | 32327 | 1.316 |
| NGC4697 | 784 | 15.1 | 10.55 | 5.5 75.36 | ACIS-S | 145366 | 0.108 |
| 4727–4729 | |||||||
| NGC5018 | 2070 | 30.2 | 10.57 | 3.7 24.95 | ACIS-S | 30449 | 0.074 |
| NGC5044 | 798 | 30.2 | 10.70 | 11.5 78.91 | ACIS-S | 20415 | 6.250 |
| NGC5102 | 2949 | 4.2 | 9.29 | 0.5 26.13 | ACIS-S | 34162 | 0.092 |
| NGC5171 | 3216 | 99.1 | 10.42 | 12.3 25.53 | ACIS-S | 34624 | 0.258 |
| NGC5253 | 2032 | 3.6 | 8.96 | 0.4 22.76 | ACIS-S | 55791 | 0.152 |
| NGC5846 | 788 | 22.9 | 10.66 | 7.0 62.68 | ACIS-S | 24680 | 1.526 |
| NGC5866 | 2879 | 13.2 | 10.32 | 2.6 40.47 | ACIS-S | 33685 | 0.033 |
| NGC6861 | 3190 | 34.7 | 10.42 | 3.8 22.76 | ACIS-I | 21384 | 0.295 |
| NGC6868 | 3191 | 34.7 | 10.58 | 6.5 38.65 | ACIS-I | 23414 | 0.272 |
| NGC7618 | 802 | 74.8 | 10.06 | 4.0 11.00††footnotemark: | ACIS-S | 14804 | 0.763 |
| NGC7619 | 2074 | 40.0 | 10.58 | 6.2 32.15 | ACIS-I | 26592 | 0.307 |
| Galaxy | SeqIDaaSequence number of the XMM-Newton data | exp. timebbExposure time of the EPIC-MOS1, -MOS2, and -PN. |
|---|---|---|
| (ksec) | ||
| IC 1459 | 0135980201 | 30,30,28 |
| NGC 720 | 0112300101 | 20,20,18 |
| NGC 1399 | 0012830101 | 23,23,– |
| NGC 3923 | 0027340101 | 33,33,31 |
| NGC 4697 | 0153450101 | 46,47,– |
| NGC 5044 | 0037950101 | 22,22,17 |
| Galaxy | RadiusaaThe inner and outer radii to integrate the spectrum. | Galactic bbThe fitting results with APEC model. is a temperature, is an X-ray luminosity of the thermal emission in the range of 0.2–5 keV, and is an X-ray luminosity of the hard emission in the range of 2–10 keV. | bbThe fitting results with APEC model. is a temperature, is an X-ray luminosity of the thermal emission in the range of 0.2–5 keV, and is an X-ray luminosity of the hard emission in the range of 2–10 keV. | bbThe fitting results with APEC model. is a temperature, is an X-ray luminosity of the thermal emission in the range of 0.2–5 keV, and is an X-ray luminosity of the hard emission in the range of 2–10 keV. | bbThe fitting results with APEC model. is a temperature, is an X-ray luminosity of the thermal emission in the range of 0.2–5 keV, and is an X-ray luminosity of the hard emission in the range of 2–10 keV. | /d.o.f.bbThe fitting results with APEC model. is a temperature, is an X-ray luminosity of the thermal emission in the range of 0.2–5 keV, and is an X-ray luminosity of the hard emission in the range of 2–10 keV. | typeddEXG or CXG is a galaxy with the hot gas electron density at 10 kpc to be more or less than cm-3, respectively. VCXG is a galaxy whose X-ray emission is limited within 10 kpc. |
|---|---|---|---|---|---|---|---|
| (arcsec) | ( cm-2) | (keV) | (erg s-1) | (erg s-1) | |||
| IC1262 | 0–240 | 2.43ccThe column density is left to be a free parameter. | 1.56 | EXG | |||
| IC1459 | 0–240 | 1.17 | 1.58 | CXG | |||
| M32 | 12–100 | 6.38 | 0.91 | VCXG | |||
| NGC507 | 0–240 | 5.23ccThe column density is left to be a free parameter. | 2.18 | EXG | |||
| NGC533 | 0–240 | 3.07ccThe column density is left to be a free parameter. | 2.06 | EXG | |||
| NGC720 | 0–240 | 1.58 | 2.17 | CXG | |||
| NGC741 | 0–240 | 4.44 | 1.60 | EXG | |||
| NGC1291 | 0–90 | 2.24 | 1.66 | VCXG | |||
| NGC1316 | 0–240 | 2.13 | 2.45 | CXG | |||
| NGC1332 | 0–240 | 2.30 | 2.06 | CXG | |||
| NGC1395 | 0–240 | 1.94 | 1.89 | CXG | |||
| NGC1399 | 0–240 | 1.49ccThe column density is left to be a free parameter. | 6.02 | EXG | |||
| NGC1404 | 0–240 | 1.51ccThe column density is left to be a free parameter. | 1.80 | CXG | |||
| NGC1407 | 0–240 | 5.42ccThe column density is left to be a free parameter. | 1.70 | EXG | |||
| NGC1550 | 0–240 | 11.24 | 1.47 | EXG | |||
| NGC1553 | 6–120 | 1.50 | 1.97 | CXG | |||
| NGC1600 | 0–240 | 4.86 | 1.33 | EXG | |||
| NGC1700 | 0–120 | 4.76 | 1.96 | EXG | |||
| NGC1705 | 0–60 | 3.85 | 1.02 | VCXG | |||
| NGC2434 | 0–120 | 12.23 | 1.37 | CXG | |||
| NGC2681 | 0–34 | 2.48 | 1.47 | VCXG | |||
| NGC2865 | 0–80 | 6.31 | 1.27 | CXG | |||
| NGC3115 | 0–240 | 4.61 | 0.84 | VCXG | |||
| NGC3377 | 0–30 | 2.78 | 1.16 | VCXG | |||
| NGC3379 | 12–18 | 2.78 | 0.85 | VCXG | |||
| NGC3585 | 0–150 | 5.60 | 1.19 | CXG | |||
| NGC3607 | 0–240 | 1.48 | 0.98 | CXG | |||
| NGC3923 | 0–240 | 6.30 | 1.29 | CXG | |||
| NGC4125 | 0–240 | 1.82 | 1.38 | CXG | |||
| NGC4261 | 0–240 | 1.58 | 1.54 | CXG | |||
| NGC4325 | 0–240 | 2.14ccThe column density is left to be a free parameter. | 1.75 | EXG | |||
| NGC4365 | 0–240 | 1.61 | 1.33 | CXG | |||
| NGC4374 | 0–240 | 2.78 | 1.36 | CXG | |||
| NGC4382 | 0–240 | 2.50 | 1.31 | CXG | |||
| NGC4472 | 0–240 | 1.62ccThe column density is left to be a free parameter. | 5.02 | EXG | |||
| NGC4494 | 0–40 | 1.50 | 1.28 | VCXG | |||
| NGC4552 | 0–120 | 2.56 | 1.36 | CXG | |||
| NGC4555 | 0–240 | 1.33 | 1.28 | EXG | |||
| NGC4621 | 0–80 | 2.17 | 0.60 | VCXG | |||
| NGC4636 | 0–240 | 1.82ccThe column density is left to be a free parameter. | 5.51 | EXG | |||
| NGC4649 | 0–240 | 2.13ccThe column density is left to be a free parameter. | 4.57 | EXG | |||
| NGC4697 | 0–240 | 2.14 | 1.62 | CXG | |||
| NGC5018 | 0–150 | 7.14 | 1.21 | CXG | |||
| NGC5044 | 0–240 | 4.94ccThe column density is left to be a free parameter. | 3.79 | EXG | |||
| NGC5102 | 0–240 | 4.32 | 1.26 | VCXG | |||
| NGC5171 | 0–40 | 1.94 | 1.59 | CXG | |||
| NGC5253 | 0–120 | 3.88 | 1.57 | VCXG | |||
| NGC5846 | 0–240 | 4.24ccThe column density is left to be a free parameter. | 2.93 | EXG | |||
| NGC5866 | 0–74 | 1.47 | 1.60 | VCXG | |||
| NGC6861 | 0–240 | 5.01 | 1.39 | EXG | |||
| NGC6868 | 0–240 | 4.96 | 1.14 | EXG | |||
| NGC7618 | 0–240 | 11.93 | 2.66 | EXG | |||
| NGC7619 | 0–240 | 5.04 | 1.19 | CXG |
| Galaxy | aa and is the gas temperature at the innermost radial bin and 10 kpc in the radial temperature profile. When the number of the radial bin is smaller than 5, we adopt the temperature in table 3 as . “—” for indicates that is smaller than 10 kpc, or the number of the radial bin is smaller than 5. The parentheses in the column represent the averaged annular radius (in unit of arcsec) where is obtained. | aa and is the gas temperature at the innermost radial bin and 10 kpc in the radial temperature profile. When the number of the radial bin is smaller than 5, we adopt the temperature in table 3 as . “—” for indicates that is smaller than 10 kpc, or the number of the radial bin is smaller than 5. The parentheses in the column represent the averaged annular radius (in unit of arcsec) where is obtained. | bb is an order of the polynomial function modeling the temperature profile. indicates that the profile is jointed between the inner and outer region. See text in detail. is a number of the model component which fits the radial X-ray surface brightness profile. The modeling of the AGN point source is not included in this number. | bb is an order of the polynomial function modeling the temperature profile. indicates that the profile is jointed between the inner and outer region. See text in detail. is a number of the model component which fits the radial X-ray surface brightness profile. The modeling of the AGN point source is not included in this number. | ccA number of deprojected spectra on Chandra data. | ddThe maxiums detection radius (kpc). | eeThe mass-to-light ratio at an effective radius , obtained by the parameterization analysis in §3.2. | ffThe hot gas electron density at 10 kpc. | typeggEXG or CXG is a galaxy with the hot gas electron density at 10 kpc to be more or less than cm-3, respectively. VCXG is a galaxy whose X-ray emission is limited within 10 kpc. |
|---|---|---|---|---|---|---|---|---|---|
| (keV, arcsec) | (keV) | (kpc) | (cm-3) | ||||||
| IC1262 | 1.040.26 (9) | 1.210.27 | 2††footnotemark: | 2 | 9 | 273.94 | 31.61 | 12.40 | EXG |
| IC1459 | 0.610.11 (5) | 0.380.22 | 2††footnotemark: | 1 | 7 | 36.41 | 4.33 | 1.42 | CXG |
| M32 | 0.340.07 (56) | — | 0 | 1 | — | 0.35 | 20.61 | — | VCXG |
| NGC507 | 0.990.29 (10) | 1.070.08 | 2 | 2 | 6 | 129.58 | 17.79 | 7.44 | EXG |
| NGC533 | 0.590.07 (7) | 1.280.22 | 2††footnotemark: | 3 | 9 | 122.81 | 22.71 | 9.39 | EXG |
| NGC720 | 0.640.18 (7) | 0.490.28 | 2††footnotemark: | 2 | 12 | 40.11 | 7.30 | 1.80 | CXG |
| NGC741 | 0.610.14 (7) | 1.320.19 | 2 | 2 | 6 | 117.82 | 20.80 | 4.62 | EXG |
| NGC1291 | 0.310.02 (45) | — | 0 | 1 | — | 5.22 | 5.12 | — | VCXG |
| NGC1316 | 0.610.09 (7) | 0.440.21 | 2††footnotemark: | 1 | 9 | 17.55 | 3.47 | 1.62 | CXG |
| NGC1332 | 0.590.07 (7) | 0.410.28 | 2 | 2 | 5 | 27.27 | 7.67 | 0.85 | CXG |
| NGC1395 | 0.590.20 (24) | 0.680.19 | 2 | 1 | 4 | 69.77 | 8.38 | 0.28 | CXG |
| NGC1399 | 0.840.03 (5) | 1.190.05 | 2††footnotemark: | 2 | 16 | 34.93 | 10.95 | 3.96 | EXG |
| NGC1404 | 0.560.05 (7) | 0.450.08 | 2††footnotemark: | 1 | 4 | 34.93 | 5.51 | 0.52 | CXG |
| NGC1407 | 0.760.11 (7) | 0.950.13 | 2††footnotemark: | 3 | 8 | 39.75 | 21.21 | 2.01 | EXG |
| NGC1550 | 1.150.30 (18) | 1.190.12 | 2 | 3 | 9 | 172.47 | 23.95 | 18.26 | EXG |
| NGC1553 | 0.270.19 (19) | 0.370.12 | 2 | 1 | 5 | 27.87 | 3.74 | 1.22 | CXG |
| NGC1600 | 0.830.10 (12) | 1.560.38 | 2 | 2 | 4 | 115.68 | 10.58 | 3.38 | EXG |
| NGC1700 | 0.440.19 (5) | 0.330.12 | 2 | 2 | 2 | 32.36 | 6.26 | 2.04 | EXG |
| NGC1705 | 0.190.02 (30) | — | 0 | 1 | — | 1.39 | 5.31 | — | VCXG |
| NGC2434 | 0.320.19 (34) | 0.290.28 | 0 | 2 | 5 | 27.12 | 5.32 | 0.90 | CXG |
| NGC2681 | 0.360.02 (17) | — | 0 | 2 | — | 1.60 | — | — | VCXG |
| NGC2865 | 0.330.10 (40) | — | 0 | 1 | — | 62.79 | 2.41 | 0.24 | CXG |
| NGC3115 | 0.320.02 (120) | — | 0 | 1 | — | 4.24 | 4.04 | — | VCXG |
| NGC3377 | 0.250.05 (15) | — | 0 | 1 | — | 1.41 | — | — | VCXG |
| NGC3379 | 0.520.30 (15) | — | 0 | 1 | — | 0.82 | 13.93 | — | VCXG |
| NGC3585 | 0.310.02 (75) | — | 0 | 2 | — | 11.60 | 2.75 | 0.76 | CXG |
| NGC3607 | 0.630.28 (29) | 0.530.31 | 2 | 2 | — | 28.55 | 4.50 | 1.37 | CXG |
| NGC3923 | 0.490.16 (7) | 0.400.15 | 2 | 2 | 4 | 34.44 | 6.85 | 1.26 | CXG |
| NGC4125 | 0.440.24 (7) | 0.360.06 | 2 | 1 | 9 | 37.46 | 4.82 | 1.89 | CXG |
| NGC4261 | 0.560.08 (5) | 1.100.58 | 2††footnotemark: | 2 | 5 | 60.71 | 9.52 | 1.45 | CXG |
| NGC4325 | 0.650.10 (7) | 0.920.04 | 2 | 3 | 9 | 214.20 | 6.55 | 25.02 | EXG |
| NGC4365 | 0.340.23 (10) | 0.480.33 | 2 | 3 | — | 30.70 | 8.10 | 0.82 | CXG |
| NGC4374 | 0.570.09 (5) | 0.720.12 | 2††footnotemark: | 1 | 11 | 15.43 | 7.27 | 0.63 | CXG |
| NGC4382 | 0.360.25 (12) | 0.360.36 | 2 | 2 | 3 | 22.99 | 2.72 | 1.45 | CXG |
| NGC4472 | 0.650.04 (7) | 0.940.04 | 2††footnotemark: | 2 | 10 | 30.70 | 6.93 | 5.65 | EXG |
| NGC4494 | 0.260.14 (20) | 0.290.11 | 0 | 1 | — | 5.05 | 4.64 | — | VCXG |
| NGC4552 | 0.570.07 (7) | 0.420.16 | 2††footnotemark: | 2 | 9 | 143.89 | 7.56 | 0.95 | CXG |
| NGC4555 | 0.680.16 (5) | 1.120.48 | 2 | 2 | — | 119.93 | 1.20 | 3.57 | EXG |
| NGC4621 | 0.250.05 (40) | — | 0 | 1 | — | 4.55 | 4.80 | — | VCXG |
| NGC4636 | 0.530.06 (7) | 0.650.01 | 2 | 2 | 30 | 30.70 | 15.74 | 5.70 | EXG |
| NGC4649 | 0.860.04 (5) | 0.800.07 | 2††footnotemark: | 1 | 5 | 30.70 | 9.15 | 2.57 | EXG |
| NGC4697 | 0.310.07 (23) | 0.320.06 | 0 | 1 | 6 | 29.20 | 3.56 | 0.88 | CXG |
| NGC5018 | 0.320.02 (75) | — | 0 | 1 | — | 21.80 | 3.21 | 0.99 | CXG |
| NGC5044 | 0.680.08 (7) | 0.810.02 | 2 | 2 | 17 | 58.24 | 15.53 | 20.47 | EXG |
| NGC5102 | 0.230.01 (120) | — | 0 | 1 | — | 0.58 | 2.65 | — | VCXG |
| NGC5171 | 0.770.48 (48) | 0.650.14 | 0 | 2 | 4 | 18.73 | 18.19 | 1.71 | CXG |
| NGC5253 | 0.330.14 (9) | — | 2 | 1 | 5 | 0.69 | 11.59 | — | VCXG |
| NGC5846 | 0.710.14 (7) | 0.640.05 | 2††footnotemark: | 2 | 9 | 44.18 | 6.70 | 7.17 | EXG |
| NGC5866 | 0.330.02 (37) | — | 0 | 1 | — | 4.66 | 4.46 | — | VCXG |
| NGC6861 | 0.680.10 (18) | 0.980.15 | 2 | 2 | 4 | 123.98 | 13.32 | 2.08 | EXG |
| NGC6868 | 0.680.25 (35) | 0.660.14 | 2 | 2 | 4 | 119.95 | 5.71 | 2.35 | EXG |
| NGC7618 | 0.800.19 (12) | 0.700.07 | 2 | 3 | 6 | 144.22 | 26.45 | 9.66 | EXG |
| NGC7619 | 0.780.14 (8) | 0.880.11 | 2 | 2 | 6 | 144.56 | 13.77 | 1.04 | CXG |
| Optical | X-ray | X-ray | |||
|---|---|---|---|---|---|
| Galaxy | aaThe total mass obtained by the optical works. Typical measurement error is 10–20%, but systematic errors in converting the mass-to-light ratio in Kronawitter et al. (2000) into the mass are possibly 50%. | bbThe total mass and mass-to-light ratio in this work. Typical error is 30%. | bbThe total mass and mass-to-light ratio in this work. Typical error is 30%. | RadiusccThe radius at which the mass-to-light ratio or the total mass is calculated. | Referencedd1: Kronawitter et al. (2000), 2: Arnaboldi et al. (1998), 3: Saglia et al. (2000), 4: Rix et al. (1997), 5: Méndez et al. (2001) |
| () | () | (arcsec, ) | |||
| NGC 1316 | 5.6 | 200, 2.5 | 2 | ||
| NGC 1399 | 10.9 | 42, 1.0 | 1 | ||
| 11.6 | 60, 1.4 | 3 | |||
| NGC 2434 | 4.9 | 24, 0.6 | 1 | ||
| 4.9 | 24, 0.6 | 4 | |||
| NGC 3379 | 13.9 | 35, 1.0 | 1 | ||
| NGC 4374 | 7.3 | 57, 1.0 | 1 | ||
| NGC 4697 | 3.8 | 95, 1.2 | 5 | ||
| NGC 5846 | 8.4 | 83, 1.3 | 1 |